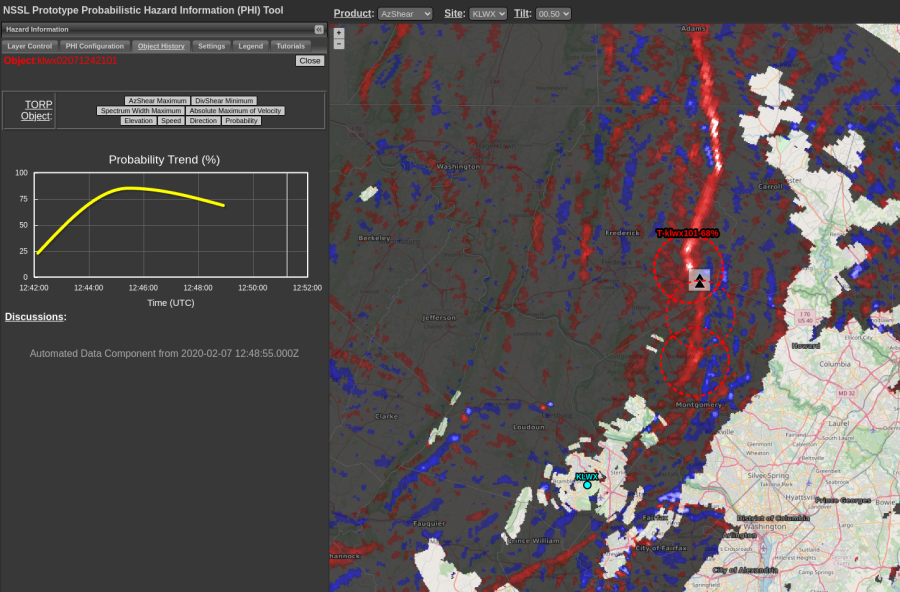
I am finding the trend graphs of the Torp and AzShear to be very helpful for situational awareness during the tracking of a storm/object. Seeing the trend helps warning decisions to extend or end a warning. I think it would be fantastic to be able to view the trend graphs in AWIPS and be able to view multiple object trend graphs at the same time. I also think a nice enhancement would be to have the probability value displayed inside the display icon would be really helpful for the warning forecaster to be able to quickly glance and see probabilities overlaid on radar data without the need to sample (and the icon could and should still be color coded).
Flash