Using GLM

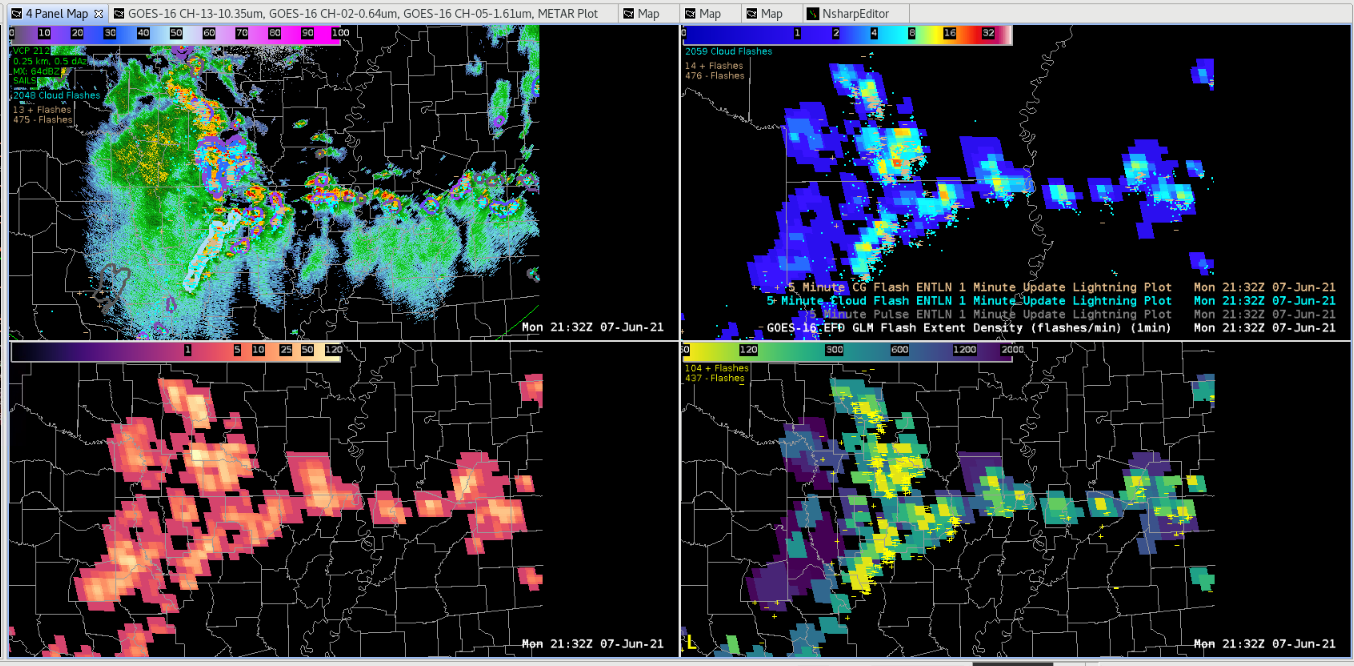
Using the minimum flash area to show where the smaller lightning strikes occur but is associated with stronger updraft with cells building faster (Yellow) to generate lightning. Larger lightning strikes occur in the stratiform area of the precipitation field where charge building is slower (Purple). This is also a good way to indicate convective mode as the system translates from individual (SuperCell) to a linear mode.

(Upper Left – ProgSvr/Ref), (Upper Right – Flash Extent Density), (Lower Left – Optical Energy), (Lower Right – Minimum Flash Area) Note the area of enhancement behind the main convective line. This is stratiform lightning strikes where the charges are slower to build vs. the convective linear line, and individual cells out in front of the storm.
Note the differences from the previous image as the Optical/FED and Minimum Flash Area has less flashes. This is due to the building of the charges.
A four panel of GR2 where reflectivity (Upper Left), and ZDR (Lower Right) depict linear striations (above melting level – 30 dBz) to show the build-up of charges in the stratiform area of the storm. A good way to use it is for IDSS and the likeability of lightning strikes developing.

Using NUCAPS (Modified vs. Unmodified). Why the CAP at mid-levels noted in Arkansas? Is this reasonable or an artifact of the program that isn’t real.

Unmodified
Modified

– wxboy65

Tags: None