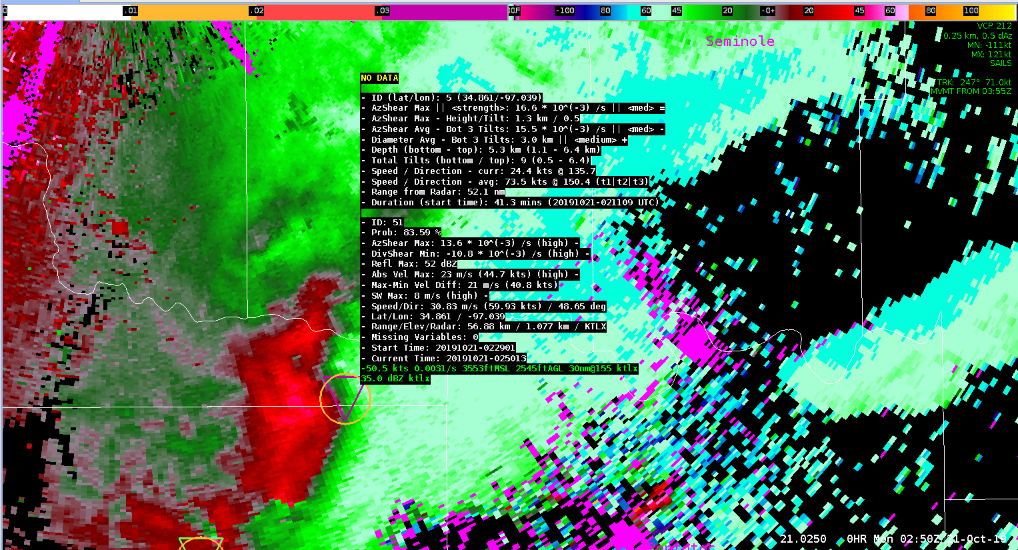
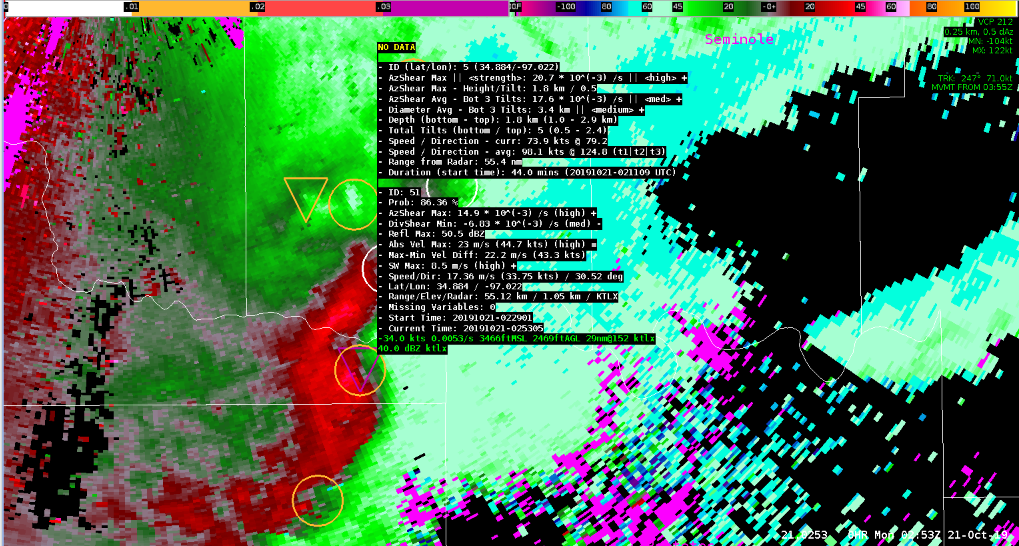
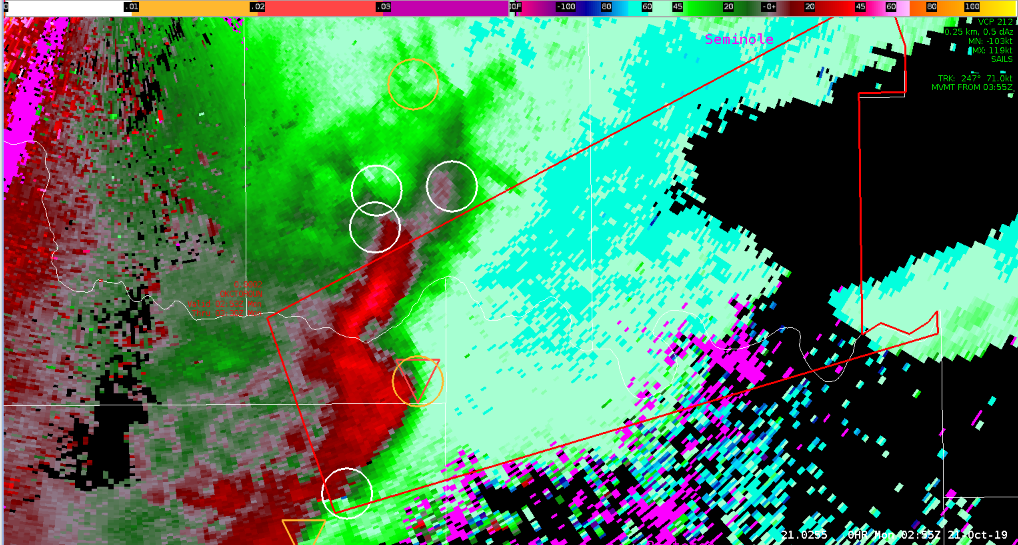
This was a great example where both the NTDA and NMDA algorithms acted as a confidence nudger for a warning decision – ultimately resulting in positive warning lead time ahead of a tornado. Interrogating a local surge in a line of severe thunderstorms southeast of TLX at 0250Z, this area was a prime focus for potential tornadogenesis given line-normal 0-3km Bulk Shear of ~40kts according to RAP13KM data (using the Three Ingredients Method). Scanning aloft quickly, a tightening mesocyclone was in progress which led to a tornado warning decision. By this time, I did notice quickly increasing trends in NTDA probabilities (83.59% at 0250Z, 86.36% at 0252Z) which by this time, I was already beginning to draw the TOR in Warngen. Seeing this display update while drawing the warning gave enough confidence to not second doubt anything, and to “pull the trigger”.
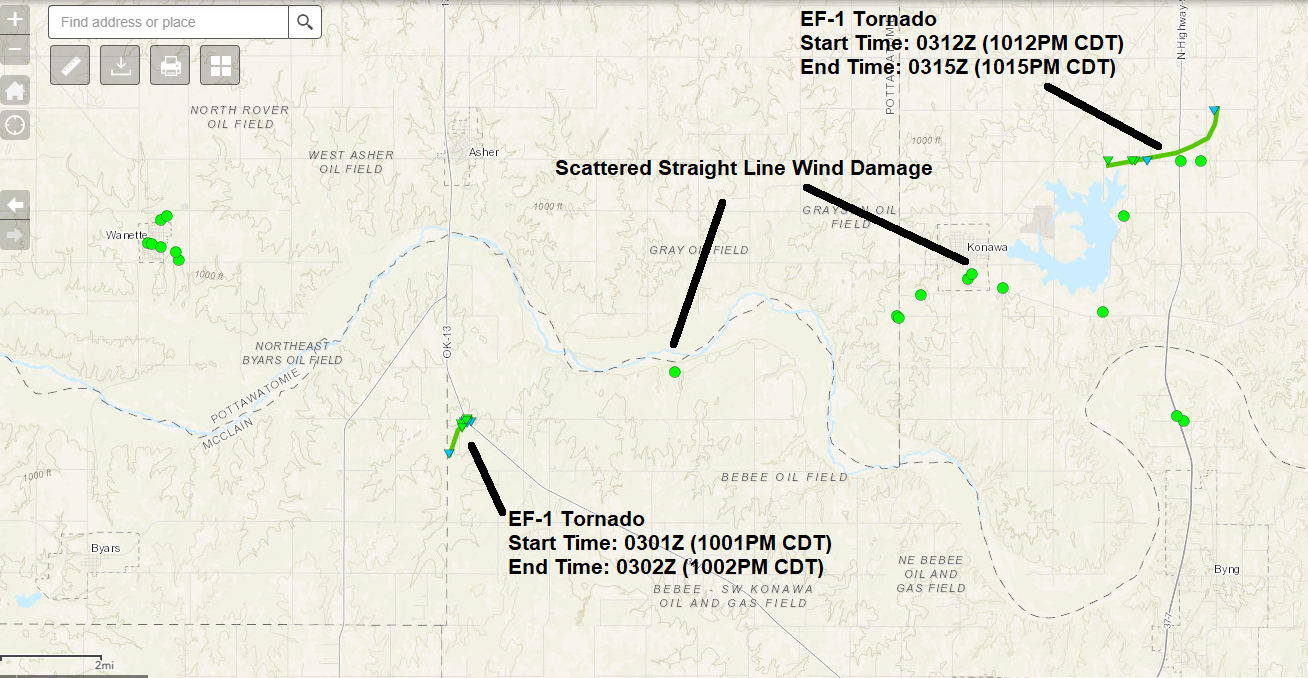
The warning came across at 0253Z, providing a 8 minute lead time to the first tornado (past survey analysis performed looking at the Data Assessment Toolkit shows a small EF-1 tornado touched down at 0301Z).


Did the NTDA/NMDA algorithms make my decision? No, and honestly I am not sure when or where it would. What this does show is how these tools provided the confidence needed to make the decision, which in a stressful situation is vital. Confidence is hard to come by when making warning decisions, as there are so many tools (sometimes too many). I would safely say the NTDA/NMDA algorithms provided extra confidence to my warning decision which ultimately led to a positive lead time from my tornado warning. Great tool!
– Dusty Davis
