First Warning for the Project (ICT)

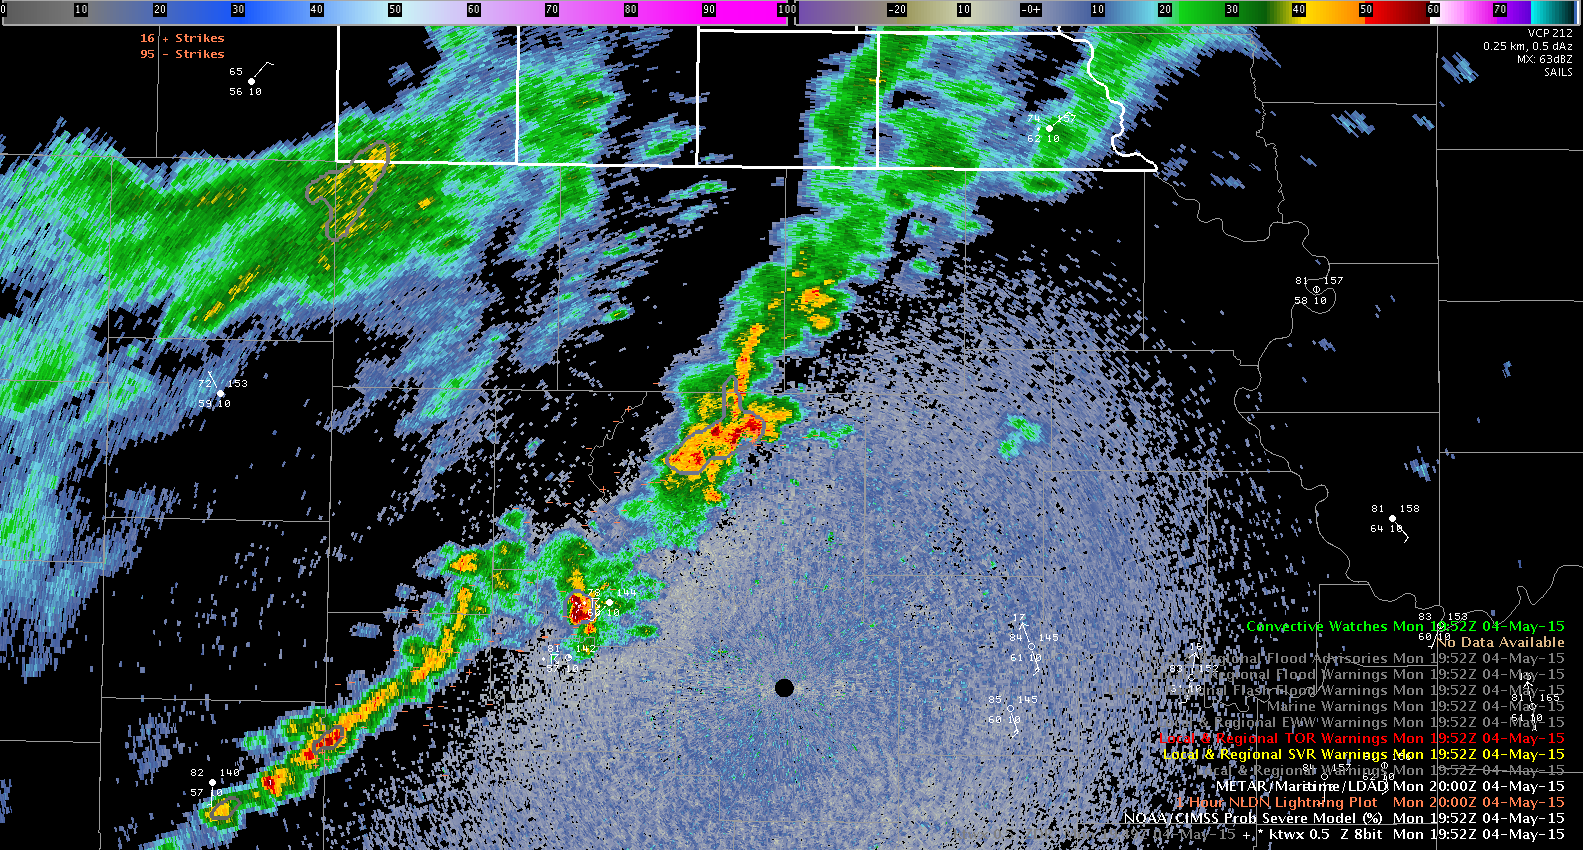
With the move to ICT we were able to issue our first warning of the project. The storm that was previously discussed re-intensified after splitting. The increasing reflectivity aloft led to the MEHS data to give a hail estimate of 1.55″ and pushed the ProbSevere up from 58% to 95%.

20150504_2147Z_ICT_ProbSevere

Thus, a warning was issued for that cell.

20150504_2155Z_ICT_ProbSevere_FirstWarn

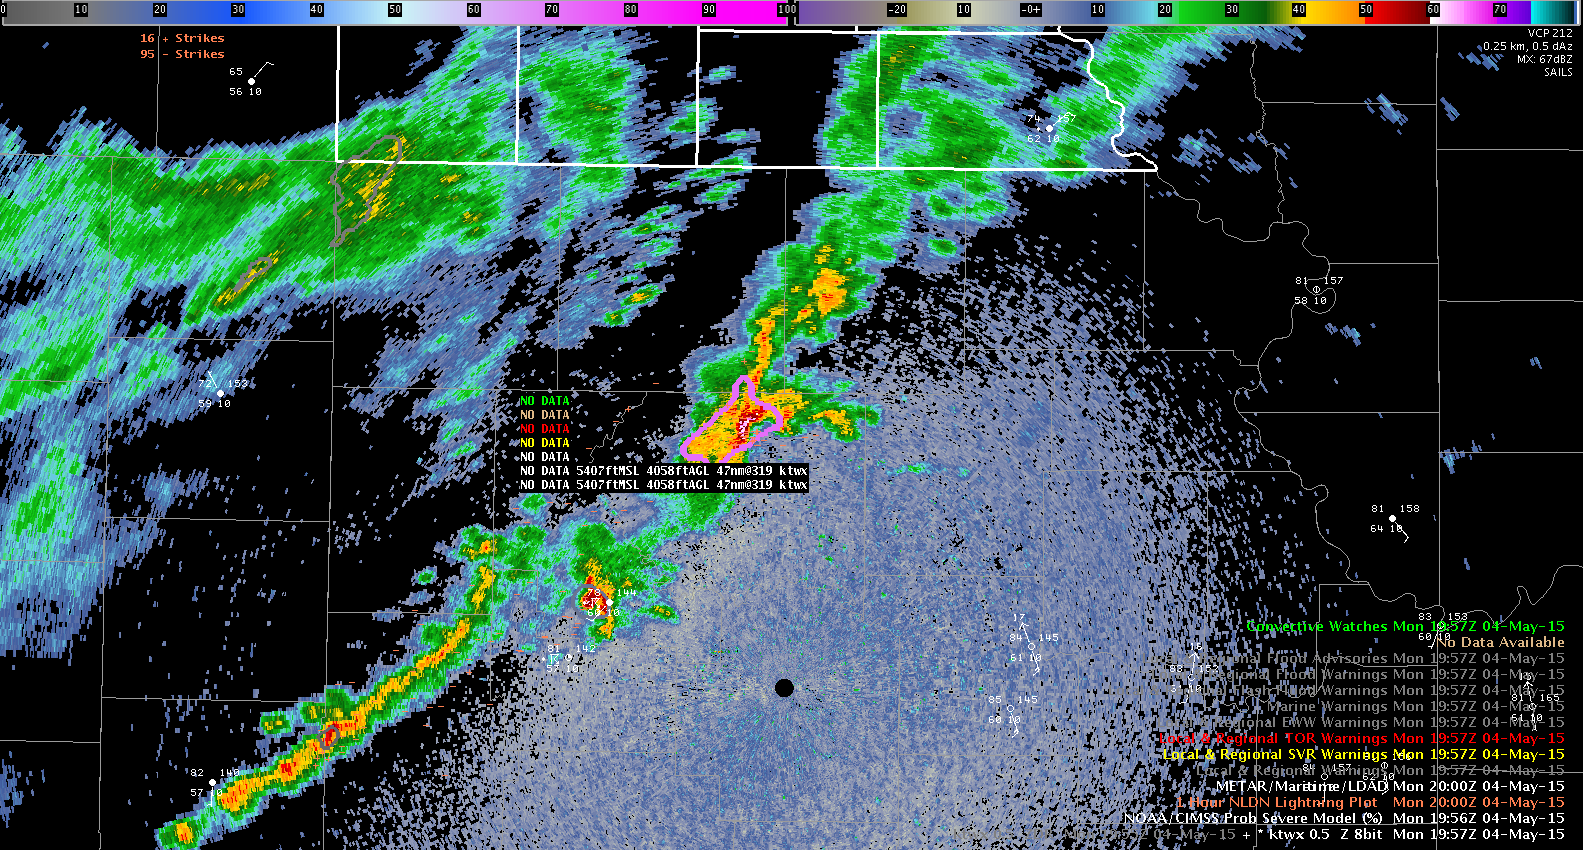
To the northwest, a storm in DDC started to take a right turn right around the same time as a series of 2-3 sigma lightning jump values (orange in bottom left screen). Those values occurred as the storm intensified on radar and led to the ProbSevere values rising from 80% to 97% as it was nearing the cwa. Also, notice the overshooting top detection in the lower right screen.

20150504_2149Z_ICT_SecondWarn

With all of those values and the expected movement into the cwa, issued a warning for the ICT area for the storm.

20150504_2205Z_ICT_SecondWarn

-SRF

Tags: None

Convective Initiation Success!

Looking back at the big picture and focusing on the GOES-R convective initiation, there was not much showing in our area of responsibility (TOP) but further south in northern Oklahoma I noticed some increasing probabilities at 1900 UTC.

1900_CI

15 minutes later at 1915 UTC the CI probability jumped to 90% on the east side of a cluster of identified clouds while there were also 40% probs on the west side.

1915_CI

Immediately after this time it was evident there was convective development was occurring as seen in this 2000 UTC satellite image below.

2000_CI

By 2030 UTC some CG lightning strikes were noted seen in the image below.  Radar at 2030 UTC also included.

2030_CI

2030Radar


Jack Bauer

Tags: None

Moved to ICT

With limited convection in the OAX area, we have moved over to ICT. The ICT CWA is along the same boundary, but now is on the southern side.

20150504_2000Z_VisAndLAPCAPE

Taking at the quick look at the radar, there is a strong thunderstorm over the north-western part of the CWA. I decided to use the ProbSevere data as a quick overview and found the MRMS MESH data (hail size ~1″) to be very helpful in giving a quick look at the current expectations on the storm. I also found the satellite indicators to be helpful with the switch to indicate the current state of the storm (Mature).

20150504_2125Z_ICT_Radar_ProbSevere

Starting to see some increase in the eastern cell while typing this and will follow up this blog post with additional information. -SRF

Tags: None

CI before severe thunderstorm

CI was 81 at 1830z in northern Jeff Davis County (first image). By 1901z 0.5 deg reflectivity (image 2) showed the first greater than 35 dBZ returns. By 1945z the Probability of Severe was 27 percent (image 3). Severe hail, 1.75 inches, was reported at 2008z through 2025z (image 4). By 2049z the storm had a massive Three-Body Scatter spike (image 5).

Time from the 81 percent chance of CI to hail report was 98 minutes.

Time from the first 35 dBZ returns to hail report was 67 minutes.

Time from 27 percent Probability of Severe to hail report was 23 minutes.

CI ahead of severe storm

1901zMay4radar

MAF prob svr 1945Z

MAF LSR

MAF TBSS 2049Z

-Lynford

Last three images from Vivian Darkbloom

Tags: None

Prob Severe Color Curve/Polygon thickness

I like the gradual color change and polygon thickness increase as the probabilities increase. See the image below for an example of the lower prob (thin blue) vs the higher prob (thick pink) and some gradients in between. This allows a warning forecaster the opportunity to quickly filter the sub-severe storms and focus on the potential for stronger convection in other areas.

ProbSevereColorCurve

Brick Tamland

Tags: None

A Quick First Look at GOES-R CI

Forecasters are working in the Midland, Texas county warning area investigating all of the products that are available to them for evaluation this week.  Like my earlier post on lightning observations available at HWT, this post is a quick highlight of the GOES-R CI.

The image below came from 4 May 2015 at 2000 UTC.  The GOES-R CI (upper left) highlights a region with 60+% probabilities.  The upper right shows the Earth Networks 1 minute lightning observations while the lower left shows the radar reflectivity.

GOES-R CI at 2000 UTC for 4 May 2015 in the Midland, TX CWA.

By 2036 UTC, a small cell with 40+ dBZ is observed (circled) and shown below.

GOES-R CI at 4 May 2015 at 2036 UTC showing initiation 36 minutes after CI indicated 60% probabilities.
Tags: None

ProbSvr and the Development of a Supercell in Northeastern Kansas

The storm of interest began to develop in a weak line of showers around 1930 UTC.  Surface obs through the area indicate temperatures in the lower 80s and dewpoints in the upper 50s to low 60s.  ProbSvr indicated around a 10% chance of the storm becoming severe.  The storm slowly strengthened over the next 20 minutes, but the Prov Svr remained around 10%.  From 19:52 to 19:57 UTC, the storm intensified rapidly, and the Prob Svr jumped from 13% to 72% (time of two radar scans)

ktopProbsvr10ktopProbsvr72

It appears the storm is beginning to root along the E-W warm frontal boundary through the region.  At 20:11Z, ProSvr MRMS MESH indicates 2″ in diameter hail in the highest dBz core.  This area correlates well with lower values of Zdr of near or just below 0 dB.ktopProbsvr2011utc

Although I did not see any hail reports while I was watching the storm, the first severe wind gust report (60 mph) occurred at 20:30 UTC, about 32 minutes after the ProbSvr rapidly increased.  Because I used the site radar (KTWX), there was a slight lag in the availability of the ProbSvr data.

Tags: None

Valid period for Level 3 DTAs may be too long

Noticed how a storm may briefly increase to 40 flashes/min, yielding a level 3 DTA for a cell. See the images below which highlight that although the DTA threshold was met for briefly for a few minutes, the successive flash rates dropped below the 40 flash/min threshold for minutes thereafter. The DTAs may be more useful for operational forecasters if the valid time were reduced from 45 mins to 30 mins. This would reduce the amount of products that may clutter up the radar interrogation process.

DTA2046Z DTA2049Z DTA2051Z DTA2054Z DTA2057Z DTA2059Z DTA2102Z

Brick Tamland

Tags: None

Severe Storm in Midland’s CWA

Now that we have a verified severe storm in Midland’s area, let’s see how the lightning jump and probability severe algorithm worked.

MAF prob svr 1945Z

At 1945Z, the algorithm showed a severe probability of 27%. The lightning jump was nothing to jump about.

MAF prob svr 1950Z

With the next 0.5 deg scan at 1950Z, the probability skyrocketed to 83%.

MAF jump 2031Z

At 2031Z, a 3 sigma lightning jump occurred. Severe probability was 93% at this time.

MAF TBSS 2049Z

By 2049Z, the cell grew into this beast. Max reflectivity on the 0.5 deg tilt was 75.5 dBZ @ 16000 ft MSL/12230 ft AGL. A prominent TBSS had developed on the storm by 2040Z.

MAF LSR

The LSR associated with this storm is shown here. Severe hail was observed beginning at 308 PM CDT/2008 GMT. In this case, the lightning jump occurred over 20 minutes after the storm began to produce severe hail. However, the probability severe did provide a lead time of about 20 minutes.

-V. Darkbloom


Tags: None

East and West Lightning data

Below is an image where the western cell was in the western US section of the thunderstorm alert area and the eastern cell was in the eastern US section of the thunderstorm alert area. Both sections are in the Midland CWA. Note the long lift of products loaded to have both cells in a Level 1 thunderstorm alert. Why was there no Level 2 alert on the eastern cell? It had 12 or more flashes for 2 to 3 minutes.

east West Ligtning trends

This set up with a set boundary will be cumbersome when it crosses through any CWA.

-Lynford


Tags: None