CI in a Different Environmental Conditions

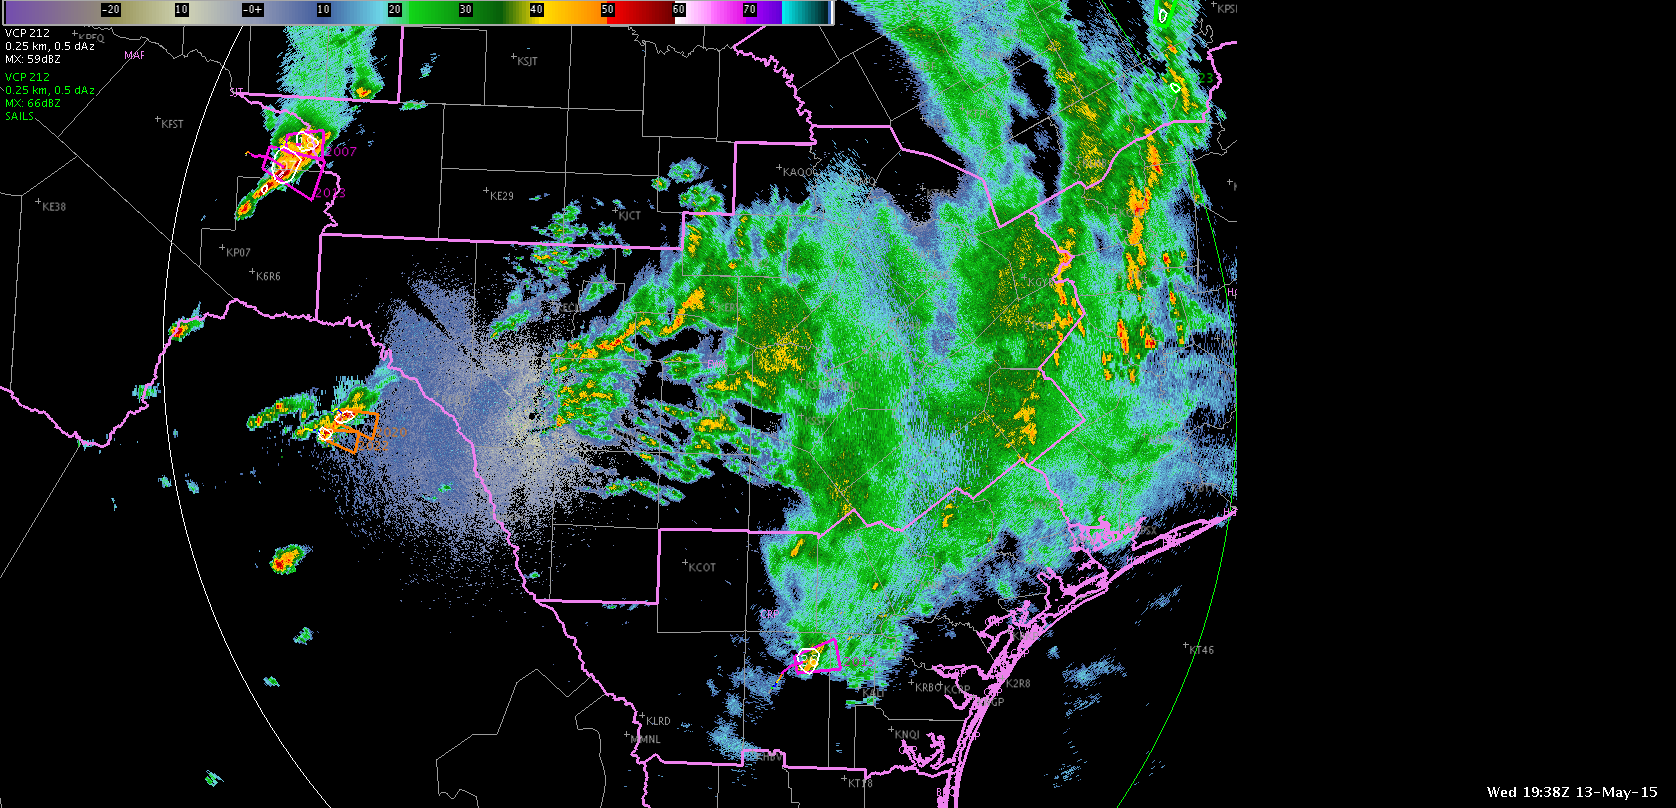
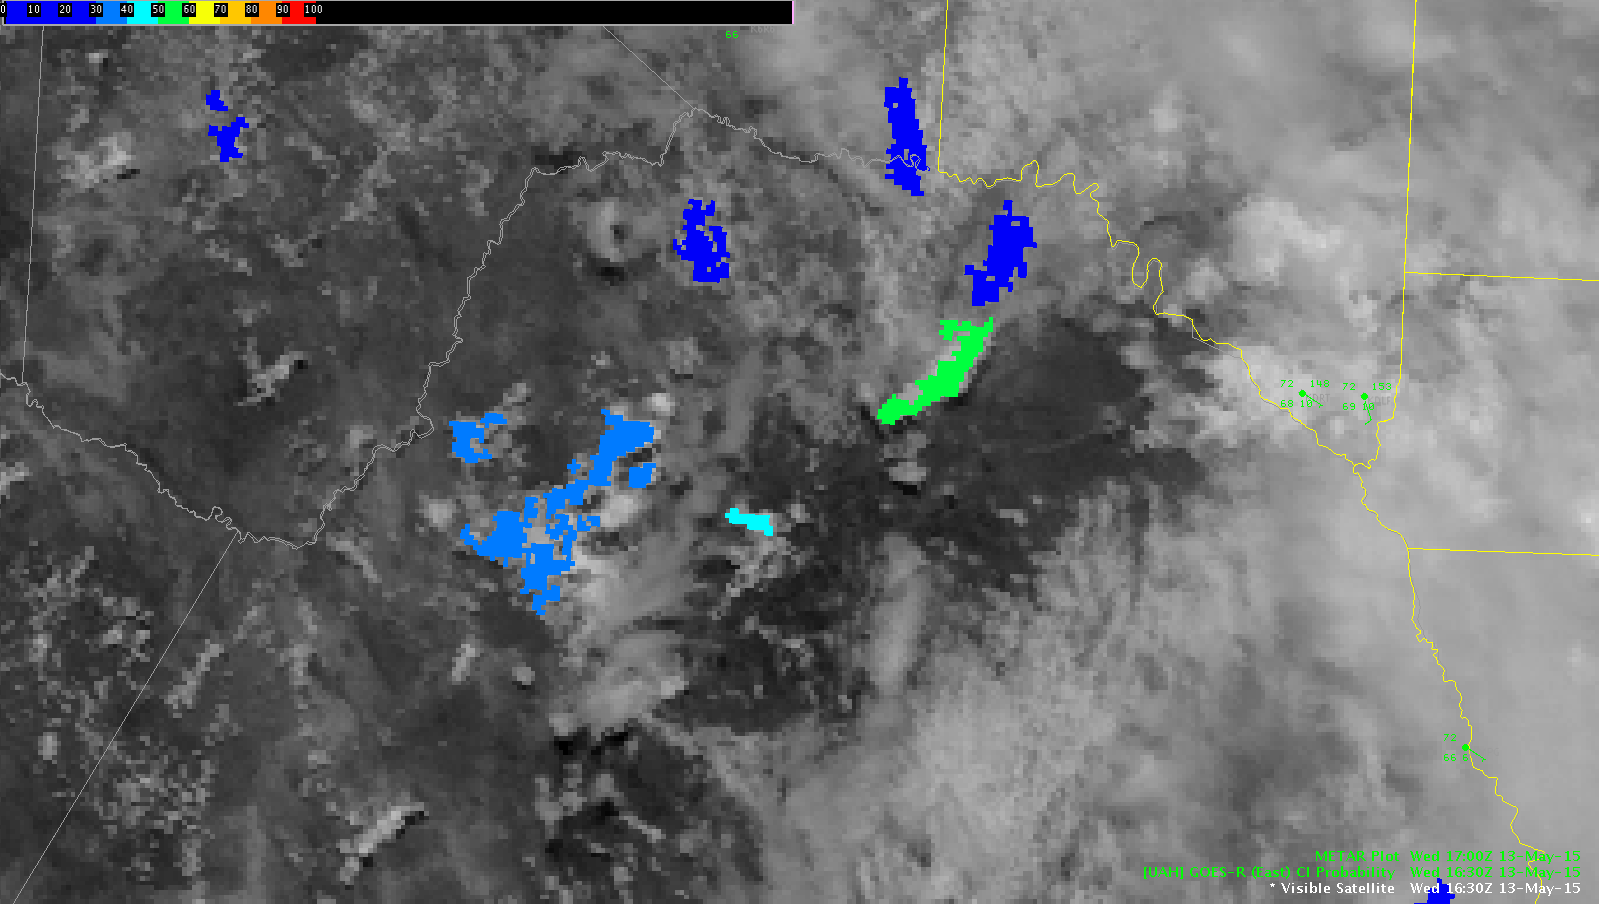
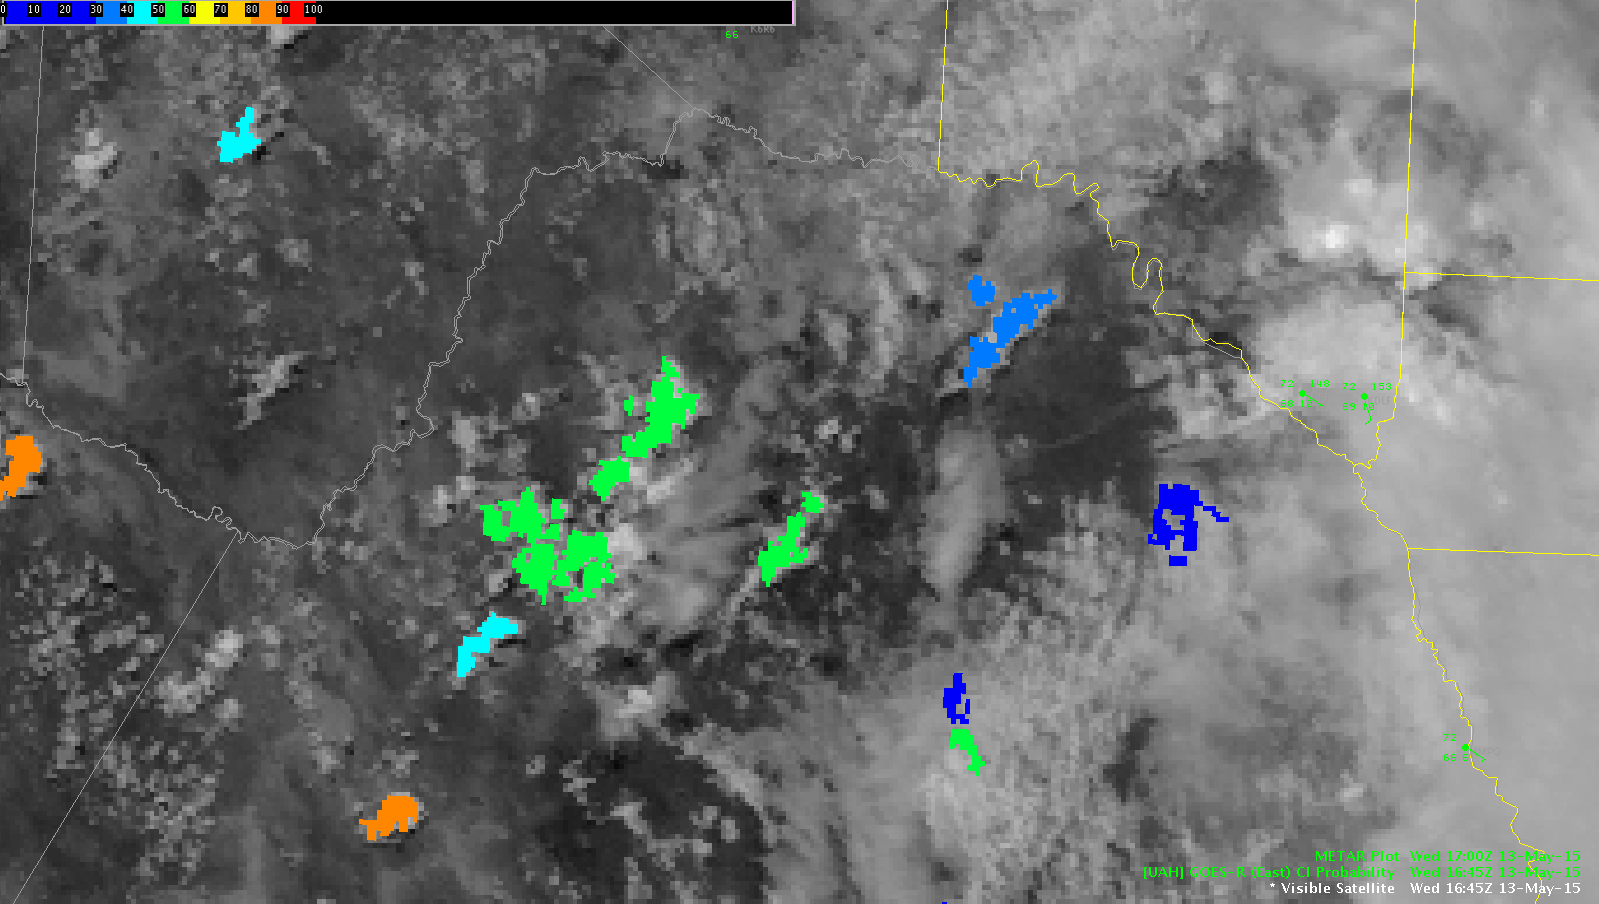
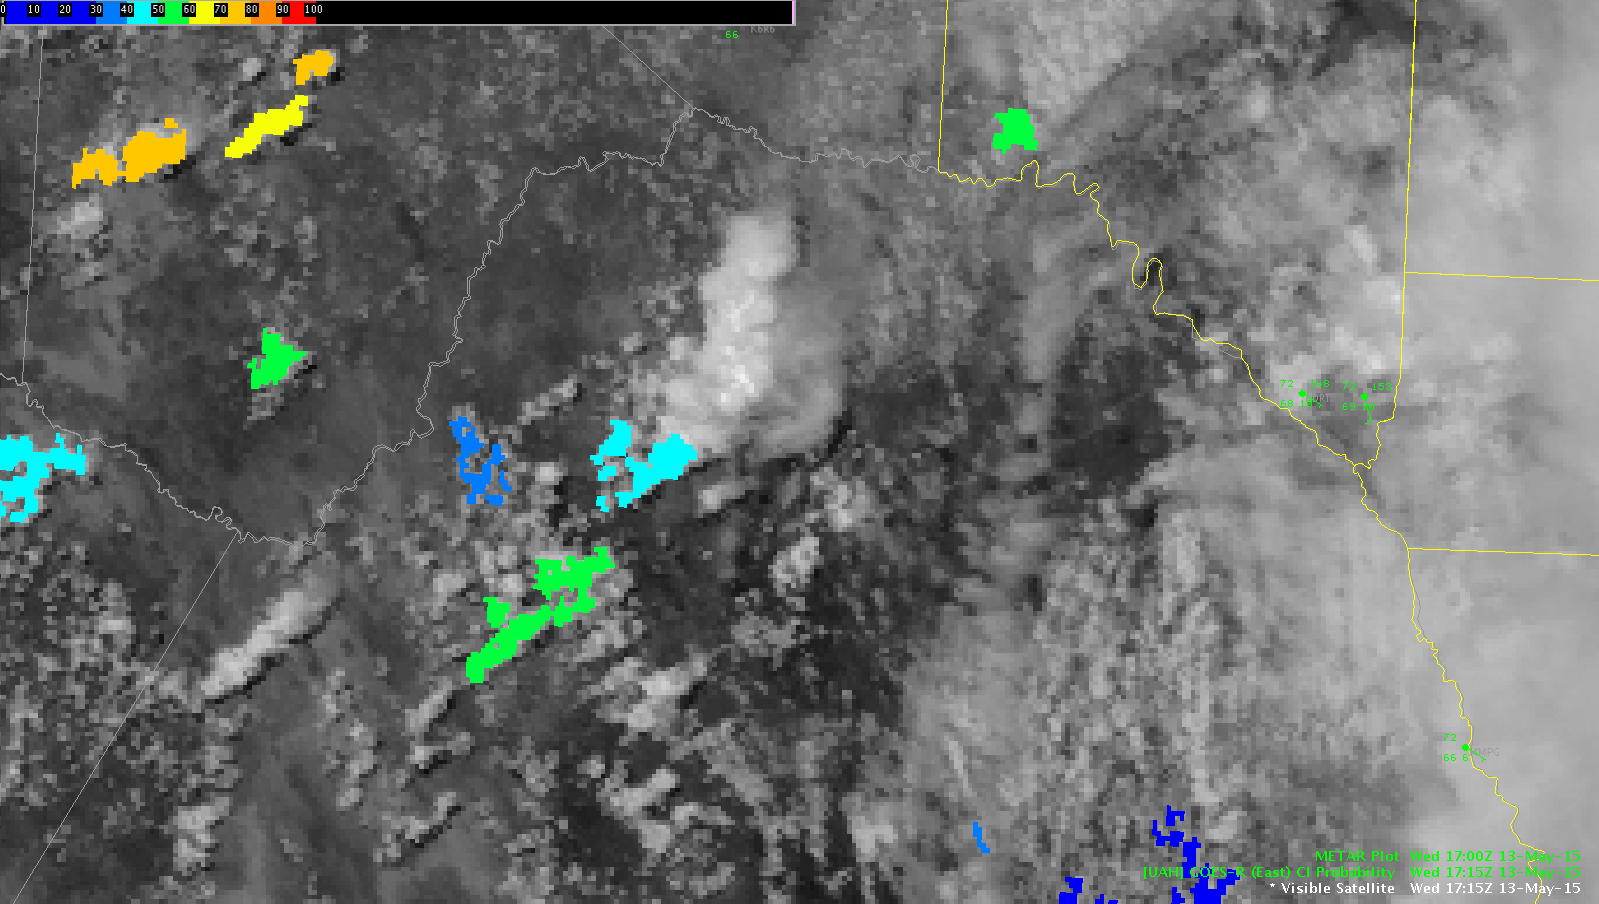
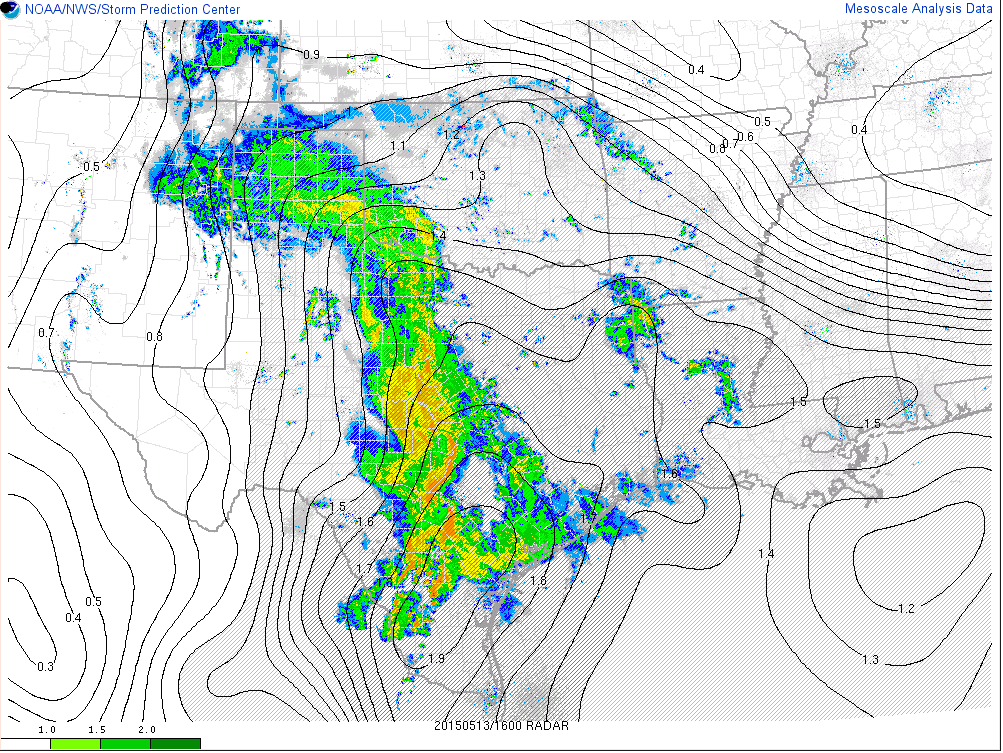
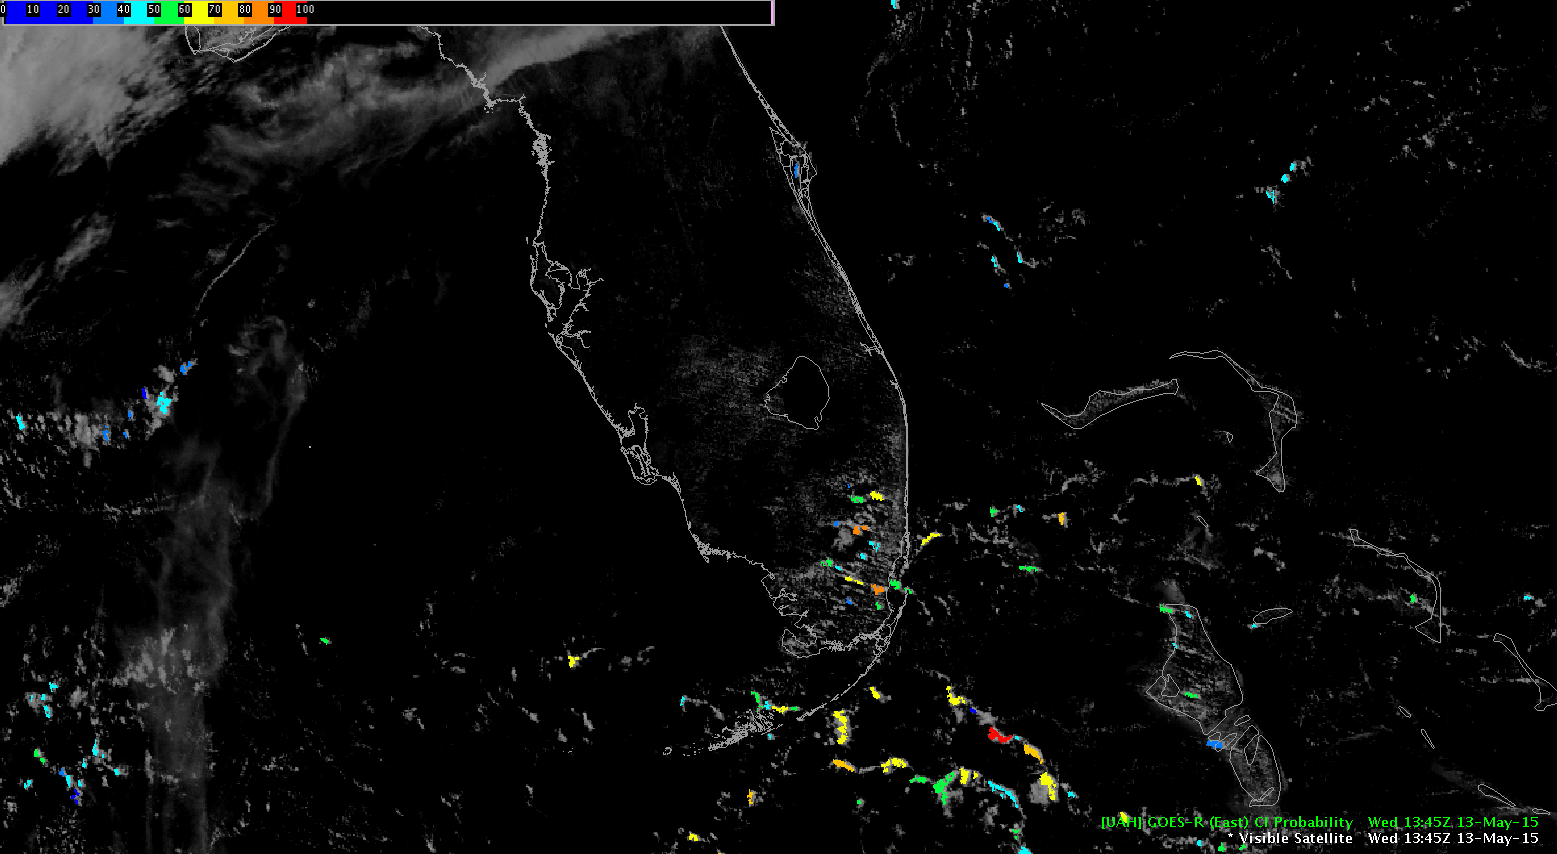
Here is an example where the convective initiation algorithm performed poorly (click to animate):

CILOOP
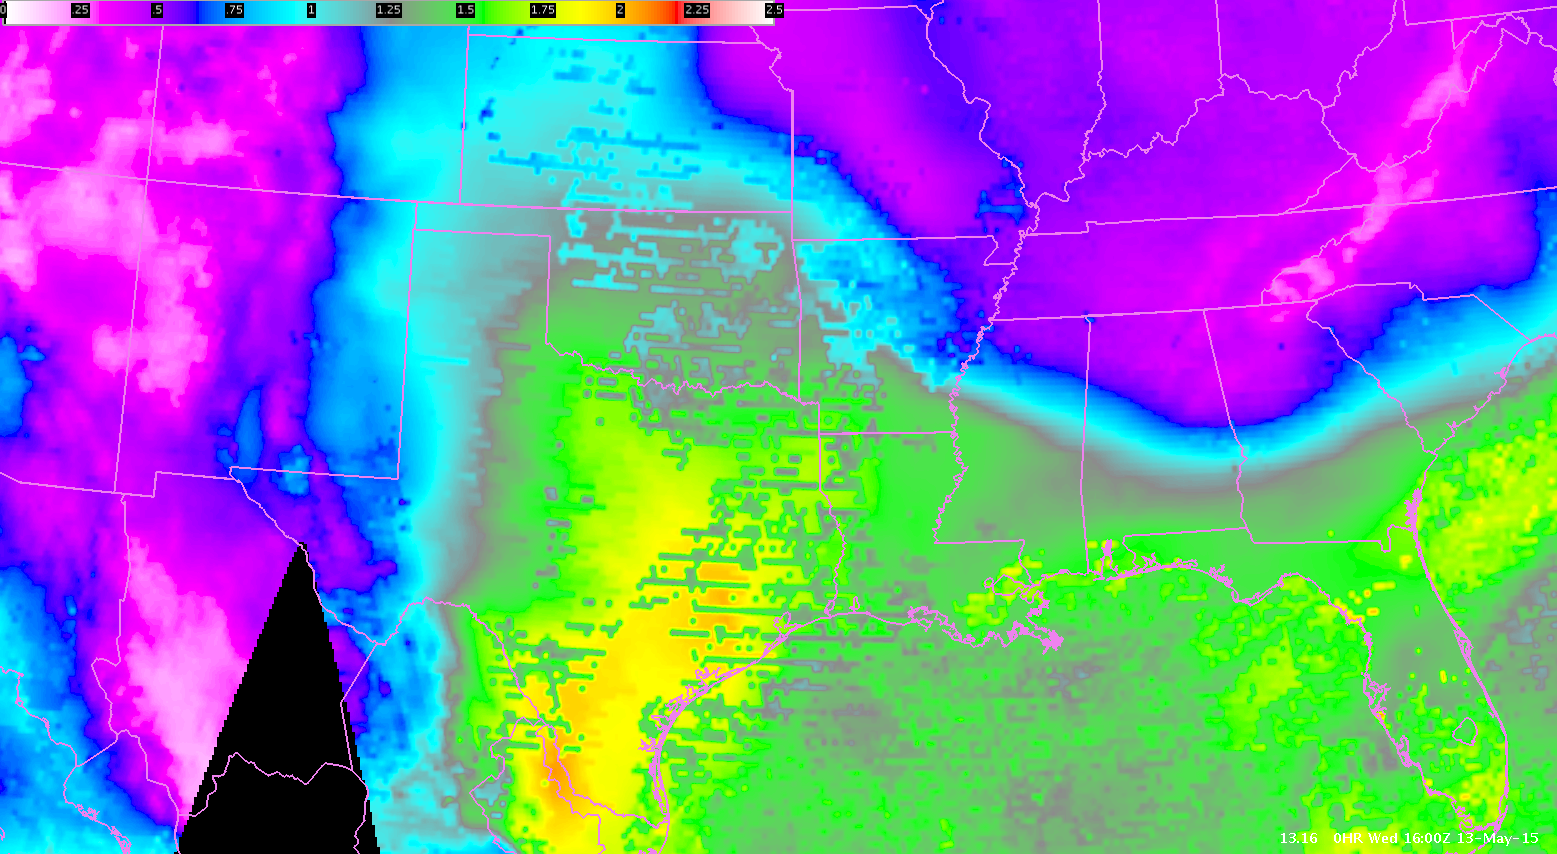
In this example, both instability and shear were very weak:mucpeshr

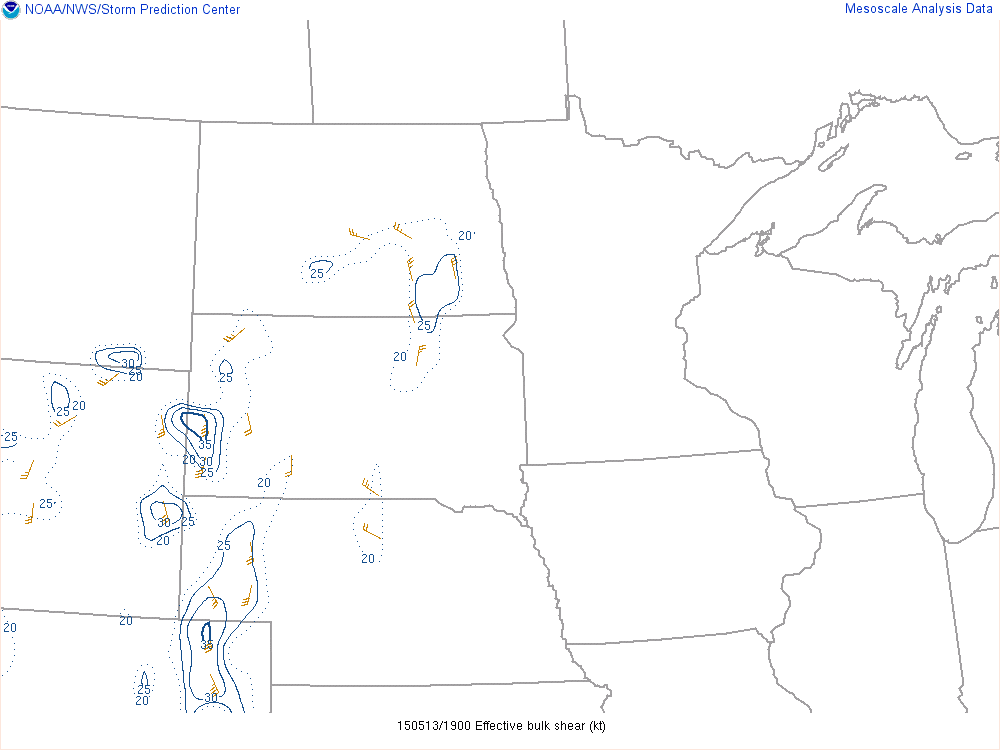
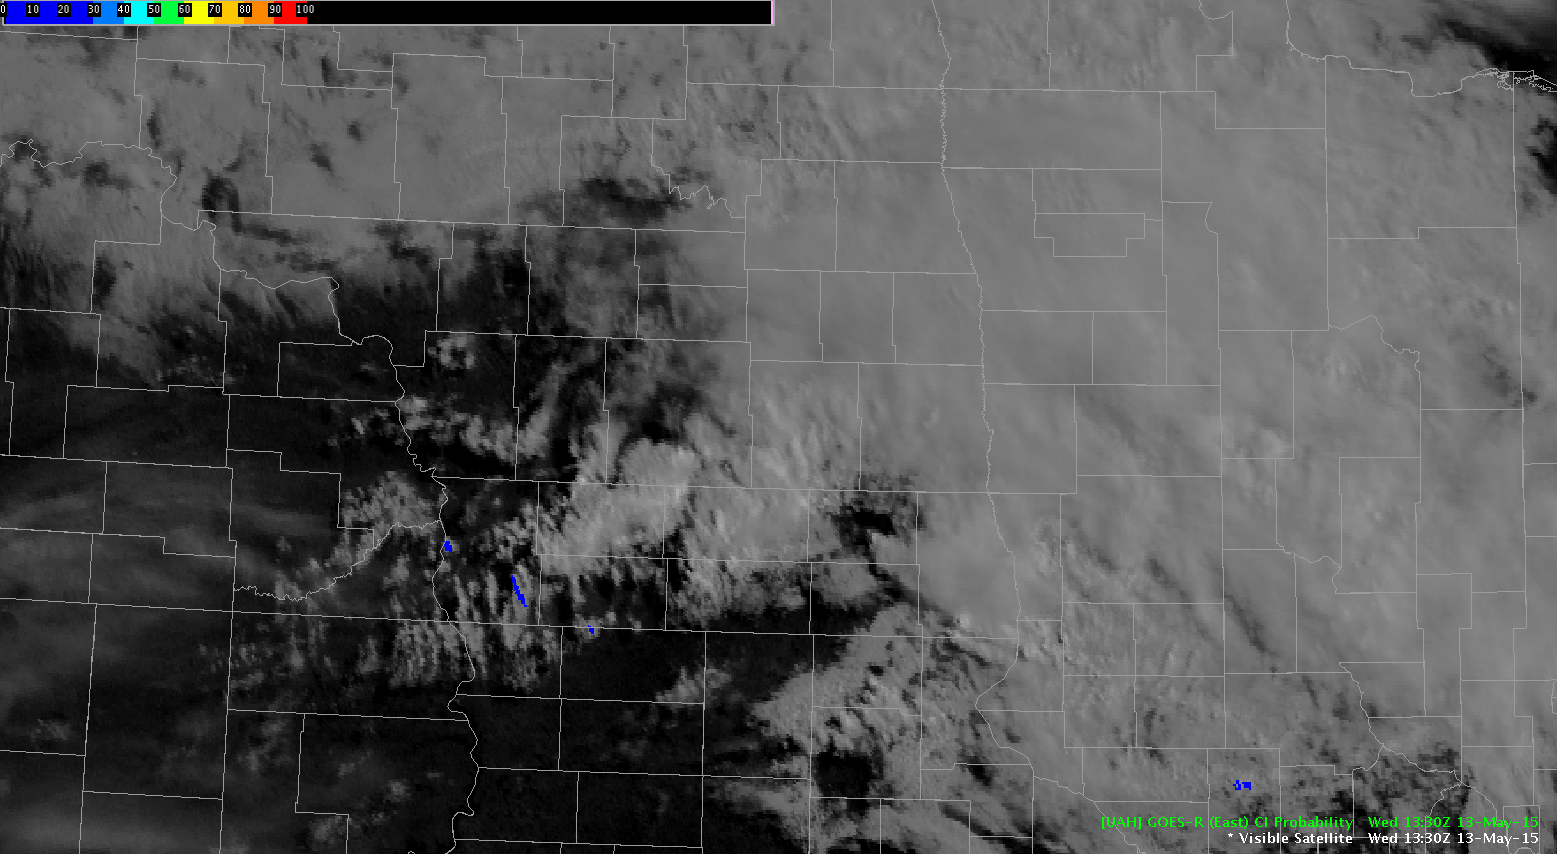
In contrast, here is an example where the convective initiation algorithm performed well (click to animate):

CLILOOP2In this example, there was moderate instability, but shear was still weak:

mucp2 eshr2
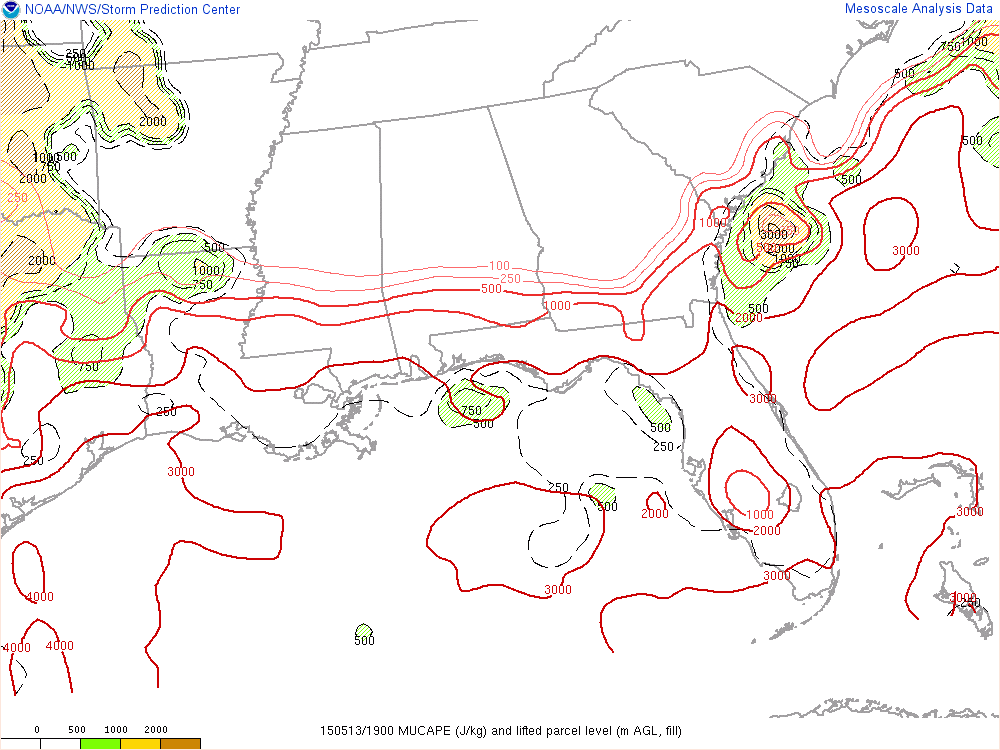
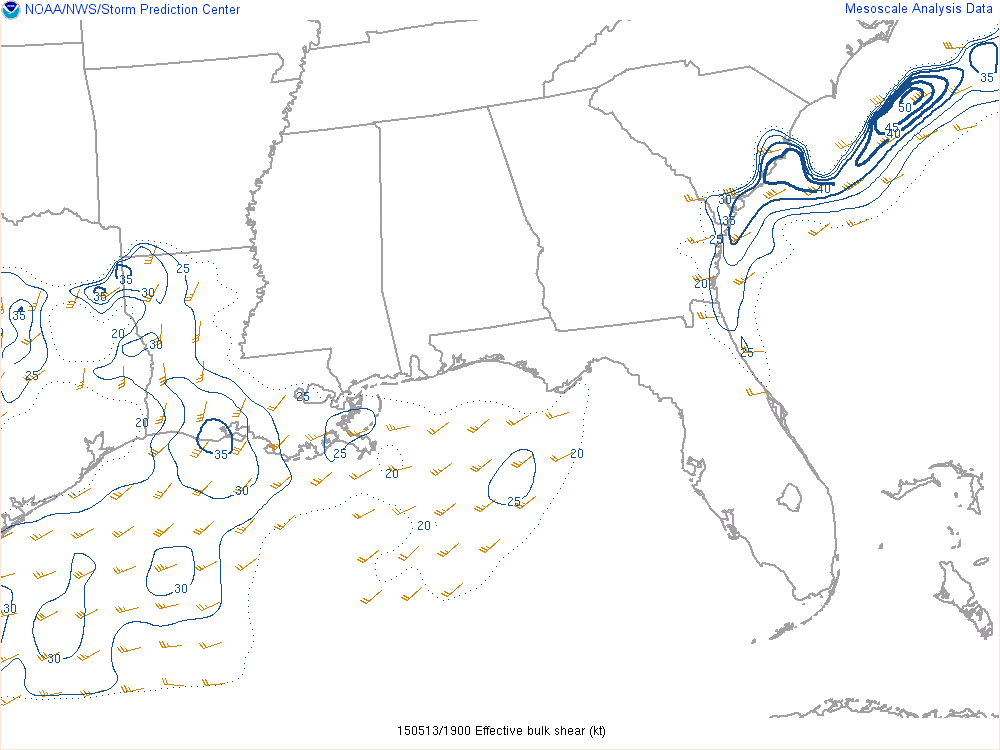
From these examples, it appears the convective initiation algorithm (which uses environmental parameters) doesn’t do as good a job in poor environmental conditions. The algorithm especially seems sensitive to instability.

Polarimetric Researcher

Tags: None

Pre-Convective Forecast for EWX (San Antonio)

Main issue for today is airmass recovery behind initial eastward propagating MCS now located at the eastern edge of our CWA. Our western half of the CWA more favored for SVR this afternoon due to a greater chance of recovery. Current CAPE profiles from the GOES sounder indicate ongoing airmass recovery along the western edge of our CWA, with CAPE values approaching 1000 J/K in the west and AOB 400 J/KG in the east. CIN is rather low/near zero over most of the area, so storm coverage could be high, which would limit overall severe potential.

CAPE
18Z GOES CAPE

However, model guidance suggests that afternoon CAPE profiles (~1000-1500 J/KG) and deep layer shear (~40 kts) will be favorable for organized convection, with potential for severe hail/wind and perhaps an isolated tornado with any supercell structures that could develop.

ERTEL

Tags: None

ENI Alerts for the big picture

One good thing about these ENI alerts is using them in a large scale picture. This doesn’t help “too” much at the local WFO scale but looking at a swatch of tstorms over a large regional area, you can easily pinpoint the stronger storms. I see a lot of aviation impacts with this in terms of CAWS issuance and Convective Sigmets. They look at the entire country for convection and this can help draw their eyes to the strongest storms.


I can also see the ENI alerts being useful for storms coming from Mexico. It may not have good radar coverage but with the probsvr and the ENI, those offices can better see these storms coming into the area.


Alertswed


Lauren13


Tags: None

CI Trends over Mexico

The CI product did a pretty good job of capturing the initiation of cells to our west over Mexico. The image below at 1630Z shows CI values over the center of the image at 31%. The next scan (1645Z) showed an increase to 53% and by the next scan (1715 Z) CI dropped out since the cell had initiated. It would have been interesting to see what CI trends would have provided if the satellite was in RSO or if there would have been a scan at 1700Z.

CI-mexico-3
1630 UTC
1645 UTC
1645 UTC
CI-mexico-5
1715 UTC

ERTEL

Tags: None

Lots of ProbSvr

Here is an example of where ProbSvr can hurt and help. In a large swatch of rainfall and embedded thunderstorms, the ProbSvr picks up almost everything. This would be a situation where “turning off” the model under a certain percentage would hide these probs that are under 5-10%. It gets messy!


probsvrwed

Lauren13

Tags: None

DTA Polygon Direction

Dangerous Thunderstorm Alerts from ENI continue to be evaluated. In an environment with more isolated cells, the ENI displays are cleaner and more user friendly (decreased clutter). These cells are more long lived today, which reduces the DTA polygons from jumping all around with quickly developing storms that are short lived (Florida case observed yesterday). My concern with the DTA polygons today revolve around the storm movement indicated by these polygons. As the storm area increases lightning concentration will change, which seems to be throwing off storm direction. I am not sure what variables DTAs use to determine direction, but I have observed a few odd changes with polygon directions from minute to minute (1 minute update).

These following two images show the issue, they are one minute apart..the environment could not have changed that drastically…

UFFSU

051315 dta polygon direction

051315 DTA polygon direction 2

Tags: None

Lightning Spikes, Prob Severe Follows

I am noticing a trend that ENI Lightning Jumps are acting as a precursor in today’s environment to increased Prob Severe probabilities. The trend is developing after a few observations with early initiations in the far west part of our CWA border.  The first image is an example of an ENI jump, please focus on upper right panel (data point 2).

051315 eni spikes

Prob Severe has been a very helpful tool through the week. As we analyze more discrete cells developing and moving east into the SJN CWA. In this cases, our data display from ENI has been much cleaner and seems to help guide the forecaster.  The correlation to lightning jumps and storm intensification will continue to be monitored in today’s environment. The image below demonstrates the increasing prob severe probability just minutes after our ENI lightning jump (bottom left panel, <70%)..

UFFSU

051315 prob severe bump after eni

Tags: None

SPC Mesoanalysis vs. GOES-R LAP Algorithm Precipitable Water

Here is an example of precipitable water (PW) from the SPC Mesoanalysis and observed from the GOES-R LAP Algorithm:SPC_PWGOES_PW-1While there are slight discrepancies between the two data sets (and obvious noise in the GOES-R data), they are actually fairly similar with respect to trends and location of the highest PW values. The gradients of PW match very closely. This tool will be very useful to track increasing precipitable water.

Polarimetric Researcher

Tags: None

Lightning Data Inconsistencies

4-Panel Image: Upper left is PGLM Total Lightning using PGHG (Houston) Flash Extent Density.  No Lightning data is picked up.  Upper right is PGLM Total Lightning using PGHG (Houston) 6 minute summation.  No Lightning data is picked up.  Lower right is the Lightning Jump Detection Algorithm (200 km).  Minimal returns.  Lower left is the Lightning Jump Detection Algorithm (600 km).  Minimal returns.  However, the large image (right side of screen) shows 5 minute ENTLN lightning data.  It is picking up data along the Grimes/Madison County border.2

-Champion

Tags: None

CI Prob Performance in Cirrus

CI Prob shows several areas for possible thunderstorm development in central and west Texas. While CI Prob has yet to verify at the time of this blog post for much of the region, it has done a very good job in eastern MAF CWA.  The CI Prob increased from 1630 in this region when nothing was showing on radar or prob severe. CI Prob led the way.

1630z    051315 1630 CI cirrus

As the storms initiated, CI Prob continued to indicate growth of other cells. This, too, was verified on in the far west portion of SJT CWA. This provides forecasters with more confidence in CI Prob, even initialized under cirrus in this event, as additional storms are forming along this area.

1745z  051315 1745 CI Prob

UFFSU


Tags: None