Lightning Jump Max product

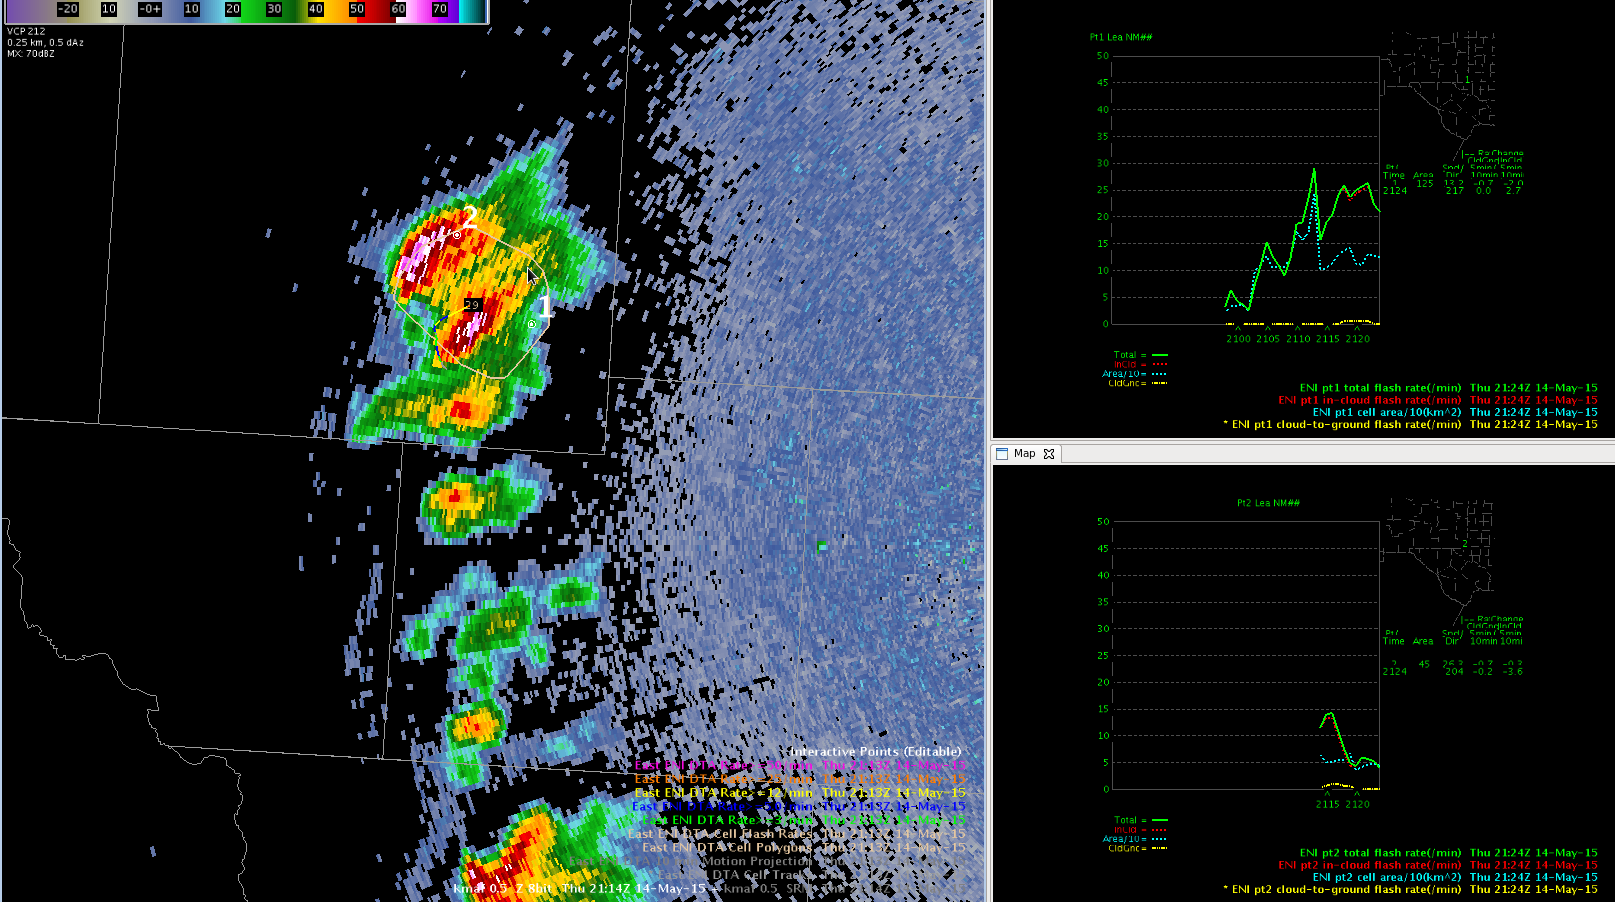
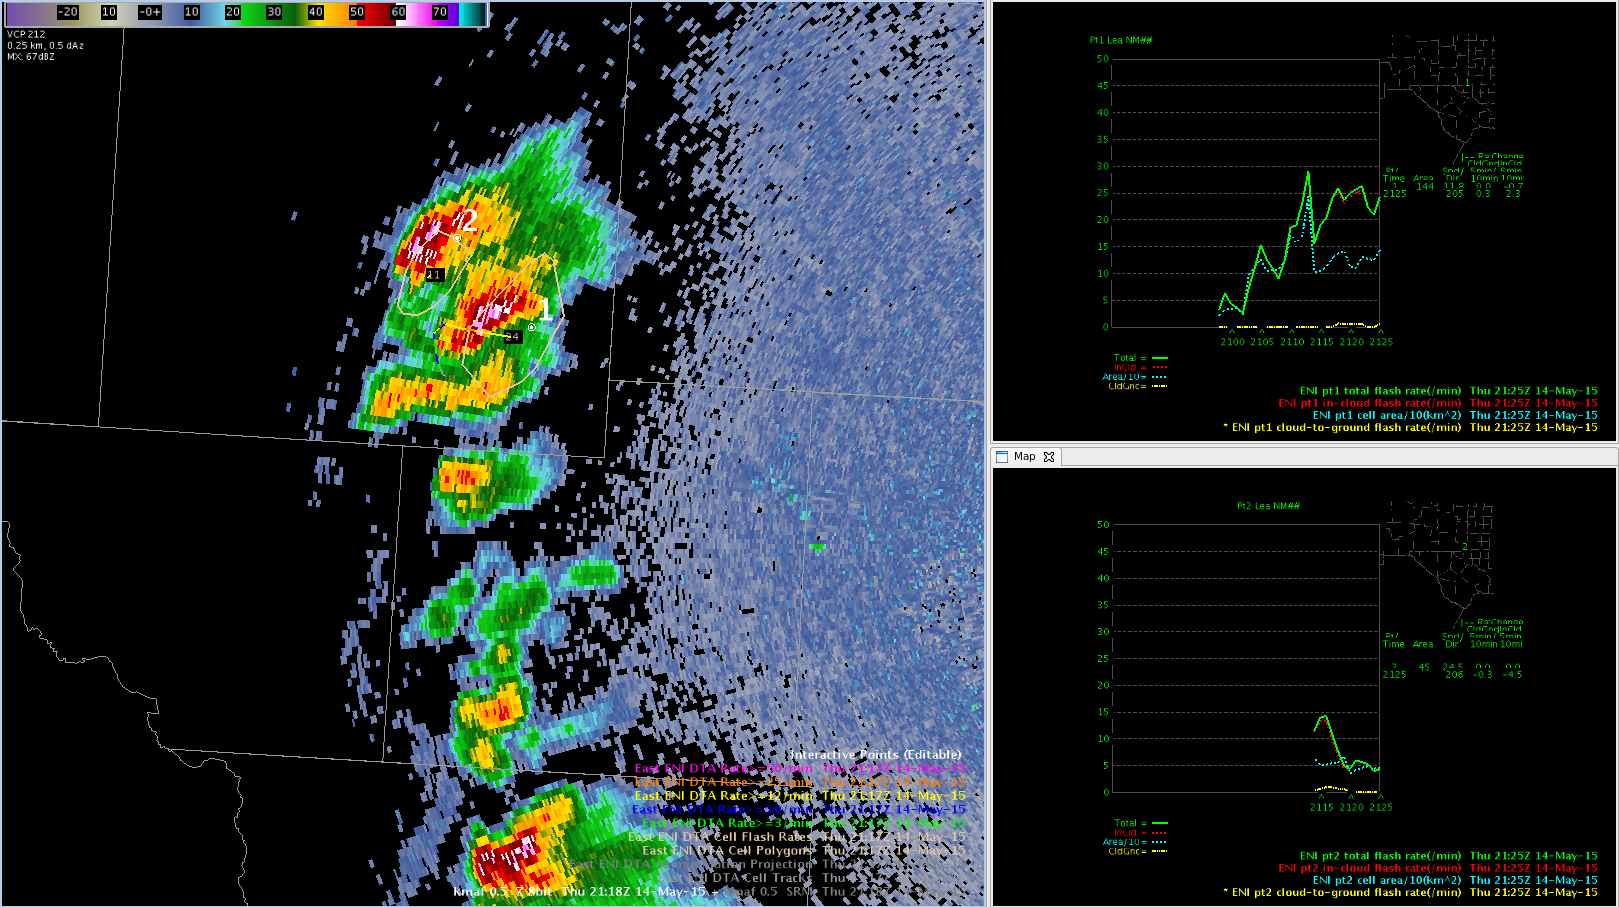
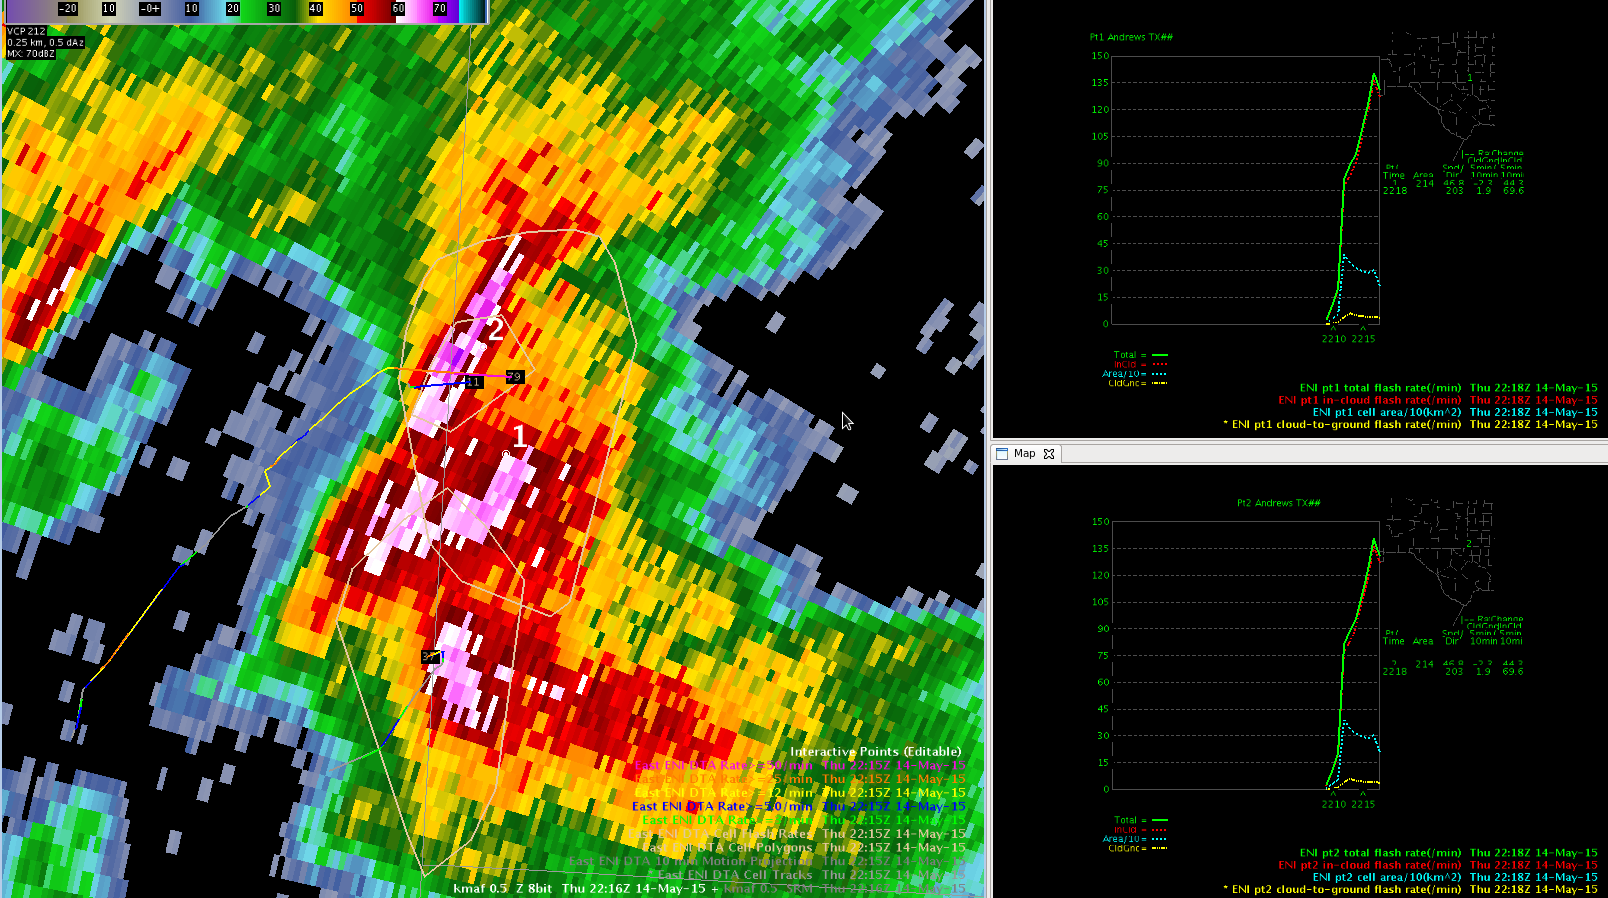
Someone probably already mentioned this, but it would be helpful to get a product for the lightning jump that displays the max jump value over a time period. The jumps can come and go so quickly with the 1-min data that you can miss large, but quick jumps if you’re not watching it constantly. A 5 or 6-min max value product might be more useful for warning operations when you are typically looking at several things at once and don’t have time to constantly monitor the one Lightning Jump 1-min data.

~Regina Phalange

Tags: None

LJDA/pGLM First Experimental Products to Capture Intensification

Had an example where the lightning jump detection algorithm and the pGLM flash extent density did an excellent job of capturing rapid intensification of a new cell (the one on the right) in the southern part of our CWA. The lightning jump detection algorithm had a 4-5 sigma jump at the same time that the flash extent density showed a nice cluster of flashes.These features are seen at the very end of the gif loop below. Just a quick color map note: the default color map for the pGLM data looked the best for the high flash rates. The other two color maps were too messy to be of use.

PGLM
Press to loop

When we noticed this, we quickly looked at All Tilts base data and observed a Zdr column extending well above the freezing level. Using these two pieces of information we issued a warning on the storm. Shortly after, ProbSevere and MRMS MESH/Z above -20 increased rapidly.

ProbSevere
Press to loop

Ertel/Regina Phalange

Tags: None

CI Prob Day in Review

CI Prob really struggled today in MAF. It struggled to indicate much convection at all. There was a layer of clouds over the cwa that persisted through the forecast period. This was the most disappointing performance for CI during this workshop. It was not a useful tool today. Satellite data, Prop Severe and radar were more effective in that order…as development on satellite was very easy to distinguish before reflectivity appeared on radar.  UFFSU

CI recap for day

Tags: None

Splitting Lightning Cell Tracking

Here is an example with Earth Networks Cell Lightning Cell tracking where a single cell split into two.

In the image below, there is a single cell detected by the tracking algorithm:

beforesplit_croppedA few minutes later, the single cell splits into two:

aftersplit_croppedThe top right panel is the time series of lightning at point 1; the bottom right panel is the time series of lightning at point 2.

Note the lightning and area of point 1 decreases substantially around 2115 UTC. This is coincident with data coming into point 2. This shows the importance of taking into consideration the area when seeing trends in lightning. In this case, the decrease of lightning was because the cell at point 1 decreased in size and split into a second cell at point 2. This is why a time series began appearing for point 2 at the same time there was a decrease at point 1.

Polarimetric Researcher

Tags: None

New Warning Help

While watching the storms redevelop…I utilized a screen with the -20C MRMS data, the ProbSvr model  and the ENI thunderstorm alerts. I had a TimeSeries on another plot as well.

2258Z.. Focus on the pink circle in the middle. This is where it first pulsed from 27-74%.

newwarning-1

2300z the ProbSvr pulsed to  82%

newwarning-2

2302Z…ProbSvr was 82% and I saw the -20C reflectivity jump to 62dbz.

newwarning-3

at 2304Z… probSvr was 95%

newwarning-4


The SVR went out at 2306. And ProbSvr remained at 95%.


I could have look at this a little earlier and probably warned at 2302 looking back. But for the record, once I looked at it.. all I did was look at the display that is in the screen captures and only went through the all tilts once. So in reality.. I would have had to maybe wait a scan or two in all tilts to process before issuing. Where here, with the MRMS data and ProbSvr I was confident issuing quicker than I would have with legacy abilities.


Lauren13

Tags: None

East/West Lightning Data Confusion

Working in west TX, it was a nightmare trying to use the lightning data because the line cut through 1/3 of the CWA.  The east data was used in the bottom right screen (4-Panel) and the west data was used in the bottom left screen (4-Panel).  A better boundary has to be chosen that’s more friendly for these CWA’s.

32 34

-Champion

Tags: None

ProbSvr Helping Warning Expiration

I utilized ProbSvr again today to help me to determine whether or not to let a warning expire or continue it. I also have the -20C MRMS height under this and that has also helped. My warning was supposed to expire at 2245z. I skipped a few screen captures for the sake of time/space.

2234Z ProbSvr was still at 90%

warningexpire-1

2238Z.. ProbSvr is down to 77%

warningexpire-3

At 2240Z…ProbSvr down to 75%

warningexpire-4

Here at 2244Z…probsvr is down to 74%

warningexpire-6


Although these probs are still fairly high.. the trend down was enough to let me expire it and the trend continued after expiration.


Lauren13

Tags: None

ENI Strike Rate

When using ENI data, forecasters must have a good handle on the “typical” amount of lightning displayed in “average” storms. There have been numerous severe storms in MAF cwa, but they have been low on lightning strikes. We opted to configure DTAs manually today triggering alerts for 75 strikes per minute. As a result of our new configured rate, we had very few DTAs and the DTAs that were triggered were accurate. However, this high threshold also missed a few severe thunderstorms in the southern portion of the cwa.  There must be local guidance given within each office on where DTAs should be set in order to be most productive with its use.

This photo shows DTAs in north part of MAF cwa, however it is actively missing severe thunderstorms producing hail that are ongoing in the southern portion of the cwa. UFFSU

Configured DTA

Tags: None

ENI Active Time Series Error

At about 2128Z the ENI point lightning data for the storm in Reeves County TX dropped to zero and then started picking it up again (right image).  The algorithm appeared to split the cell in two and then combine it again.  (I wasn’t able to screenshot the image of this).  This was wrong because it was a lone cell that had a SVR warning with it and a TBSS earlier.  There was no redevelopment outside of the storm.  The algorithm should be able to handle these lone storms and it didn’t.30

-Champion

Tags: None

Circle in a Circle with Lightning Cell Tracking

Here is an example with Earth Networks Cell Lightning Cell tracking where there was a circle within a circle:

doublecircle2In this example, point 1 is in the interior circle and point 2 is in the outside circle. Note that the time series are the exact same for both circles. This situation would be confusing to a warning forecaster.

Polarimetric Researcher

Tags: None