
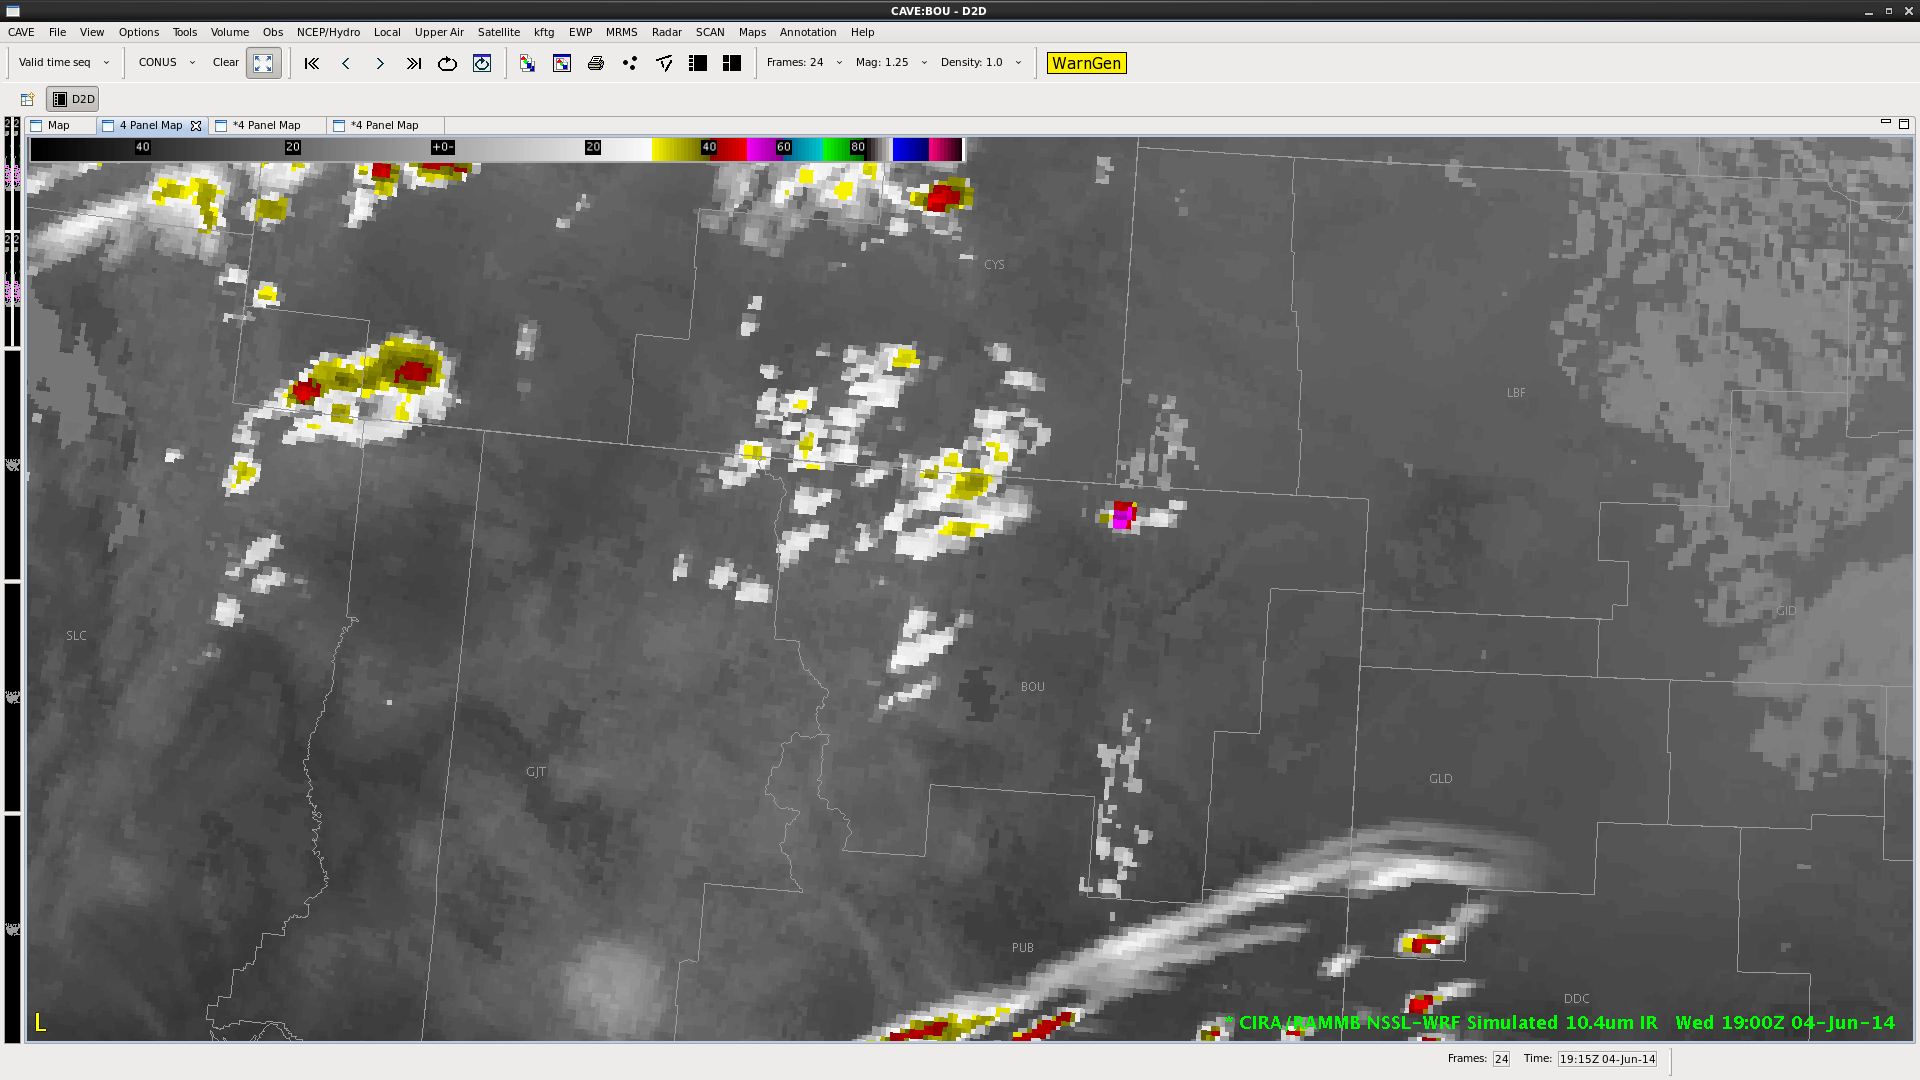
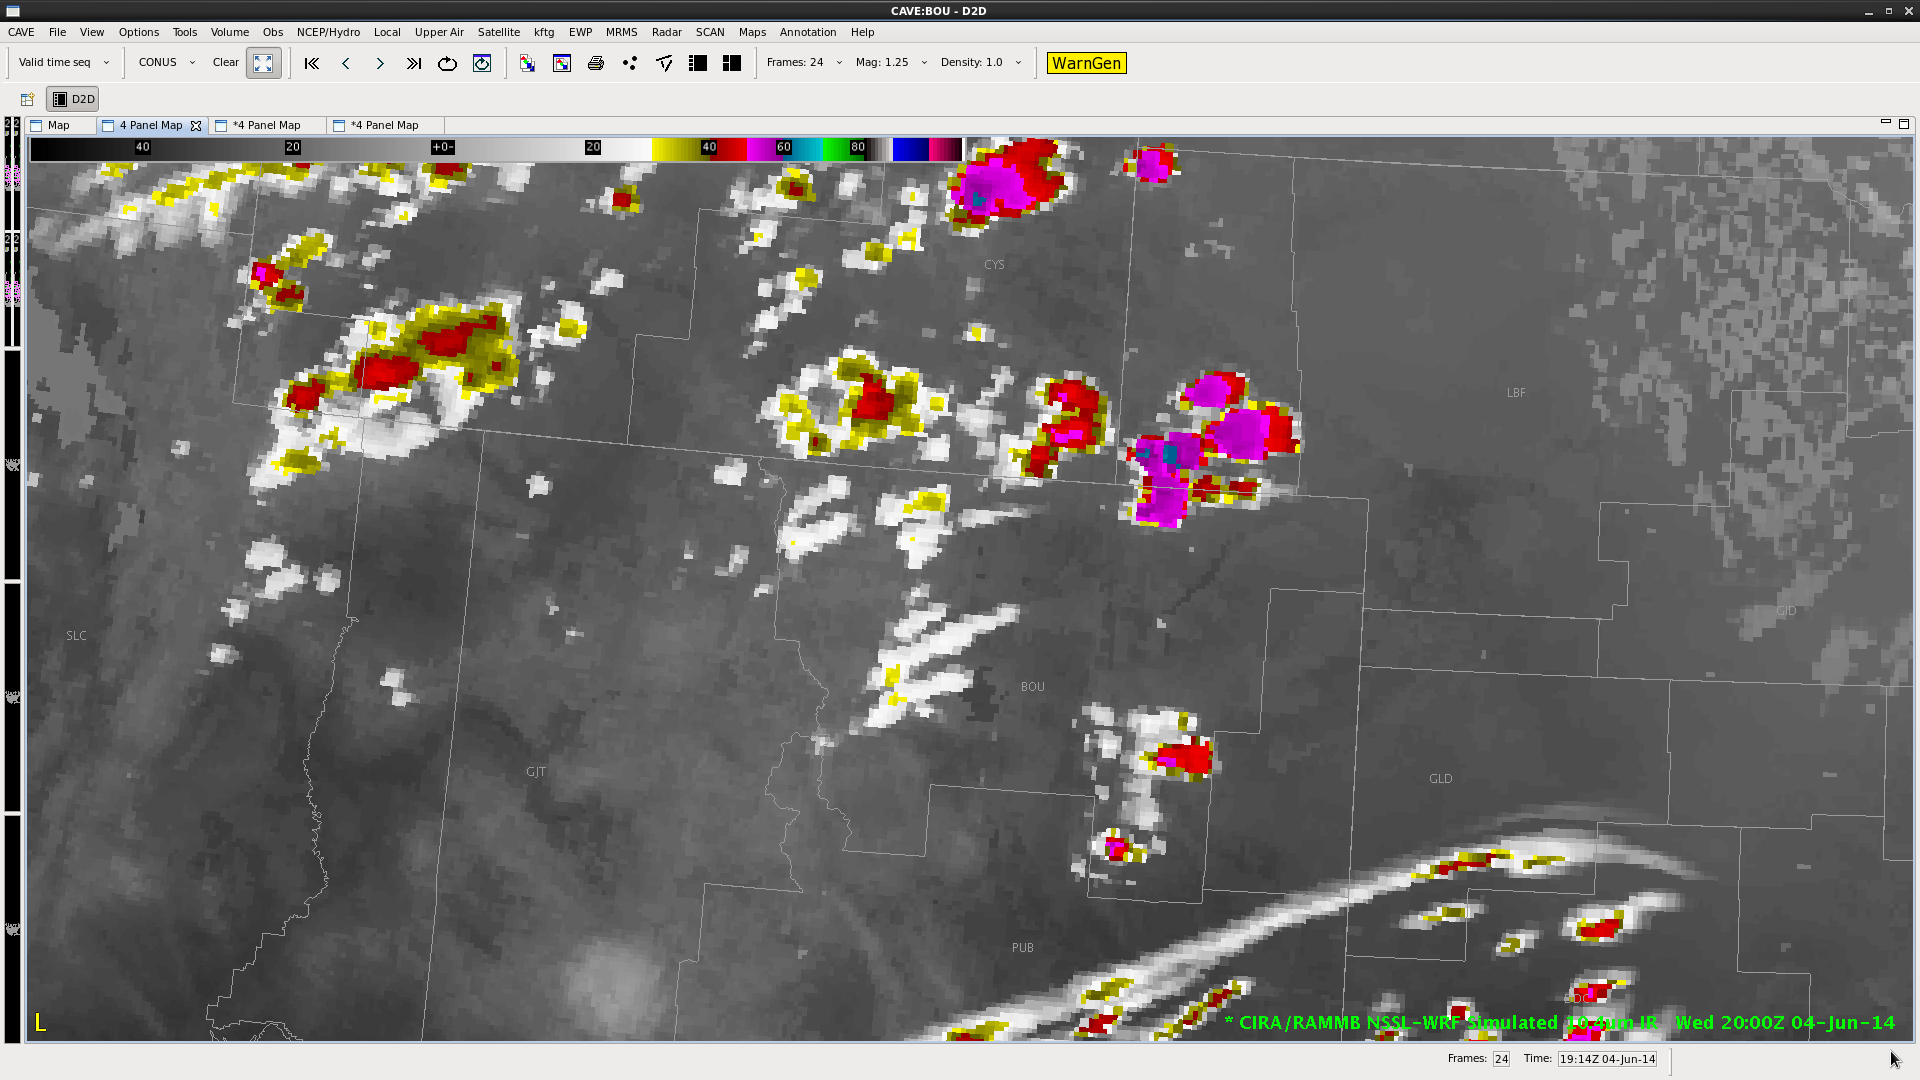
The top two images show the change in forecast IR satellite output over the course of an hour. There is a good amount of enhancement during that time and, as shown in the third image at the bottom of the page, there are some enhanced cloud features with CI values in the 40-60 percent range. This would be a case (where convective initiation is likely within the hour) where having 15 minute WRF simulated IR imagery would be helpful.
 -KP
-KP