WY convection this PM

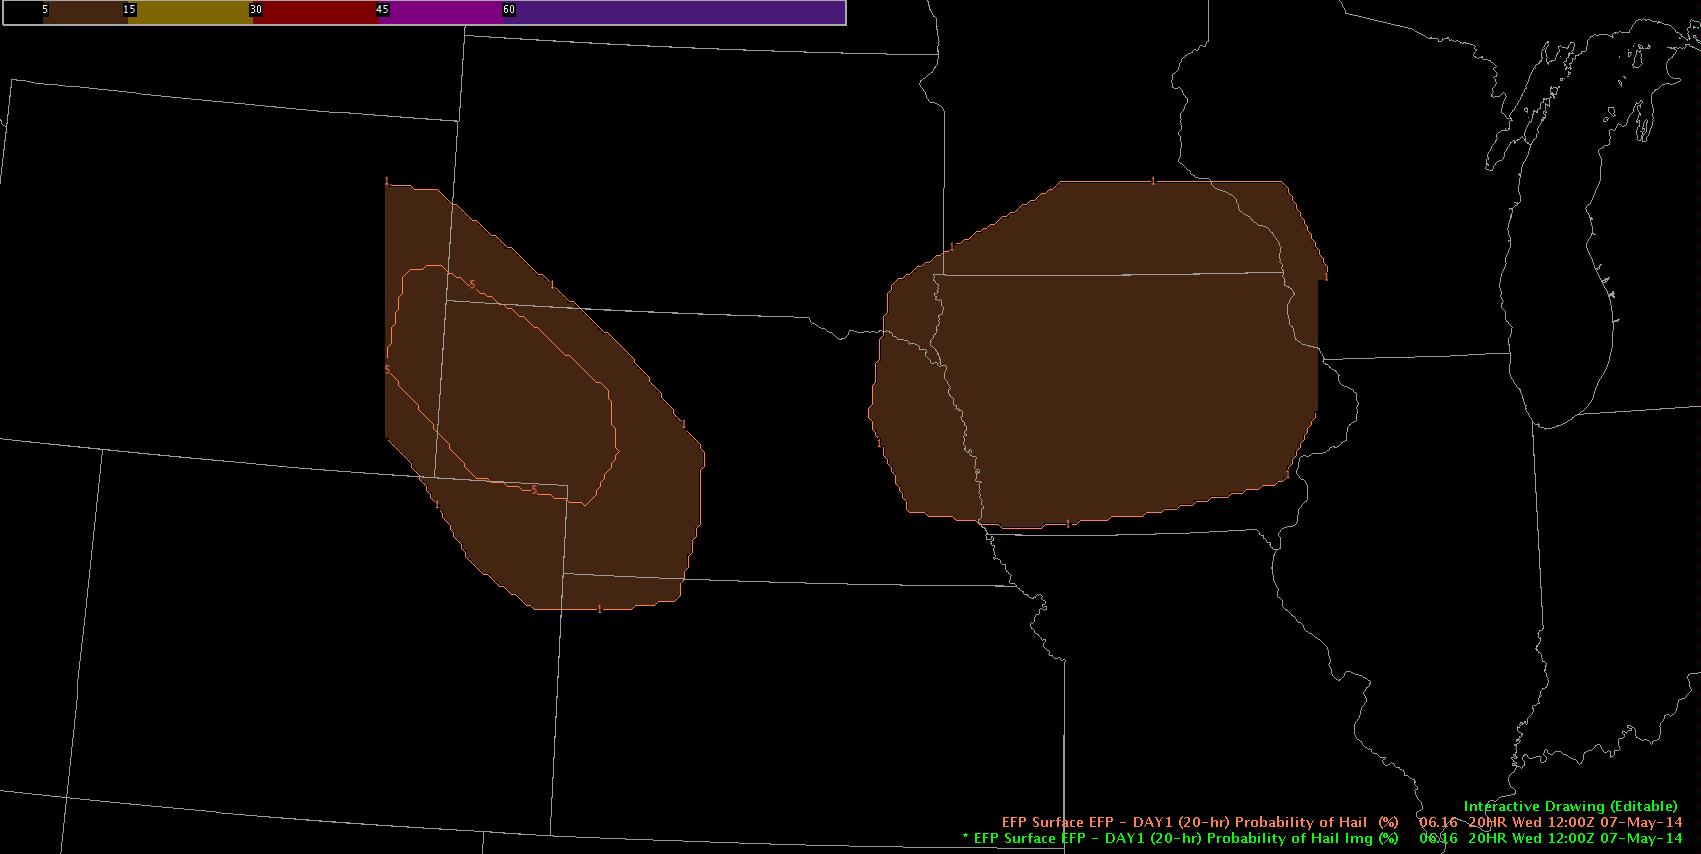
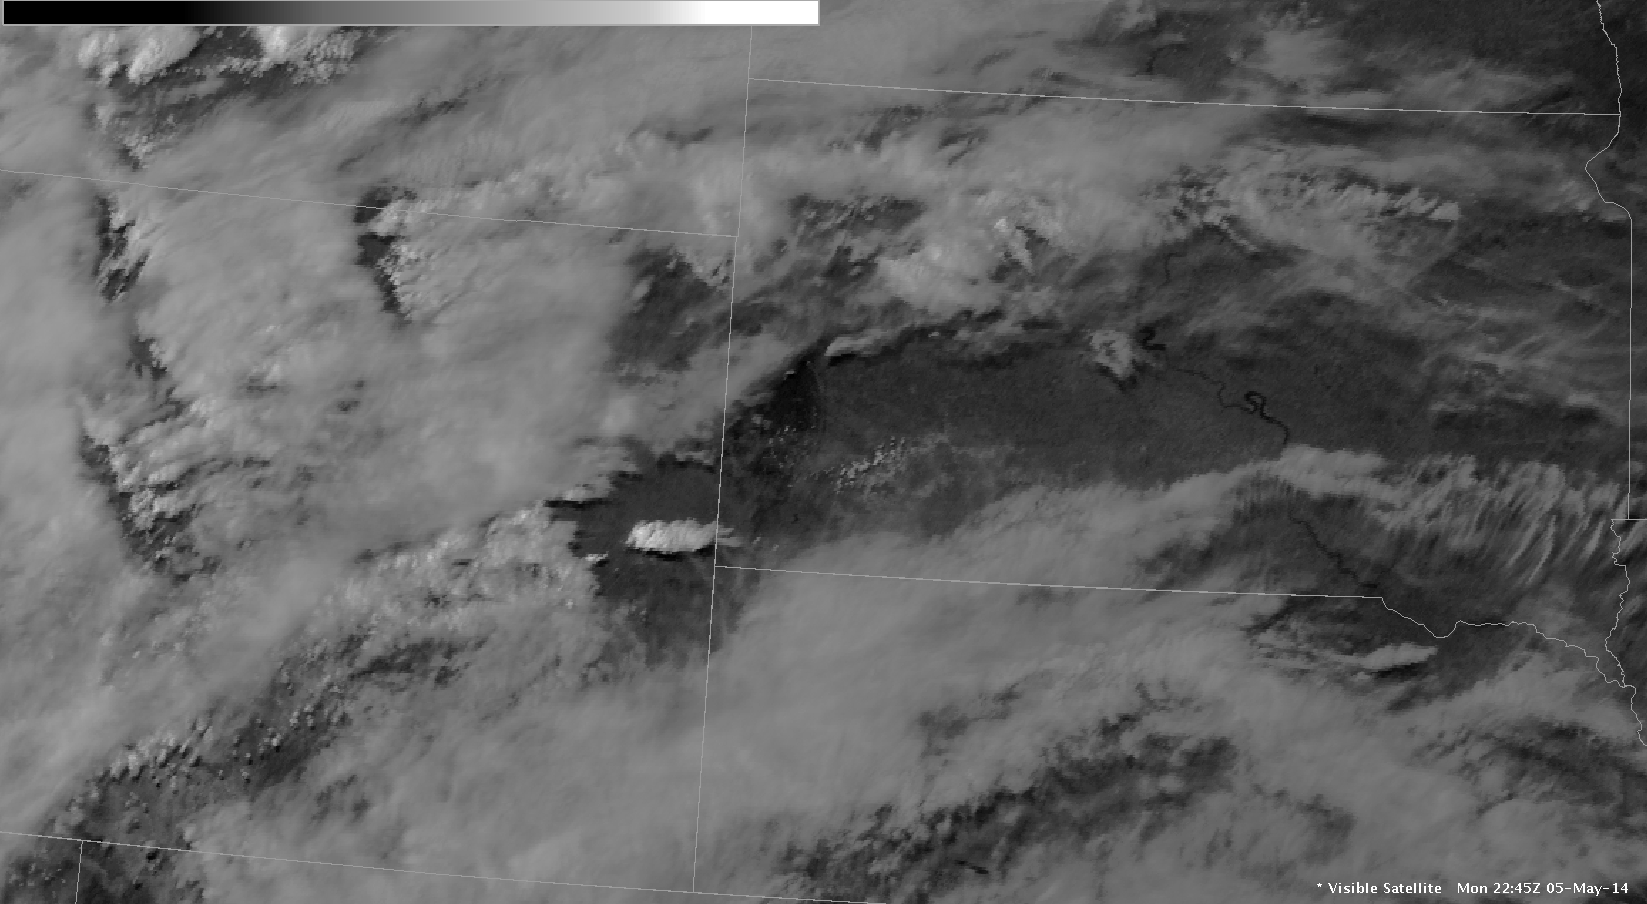
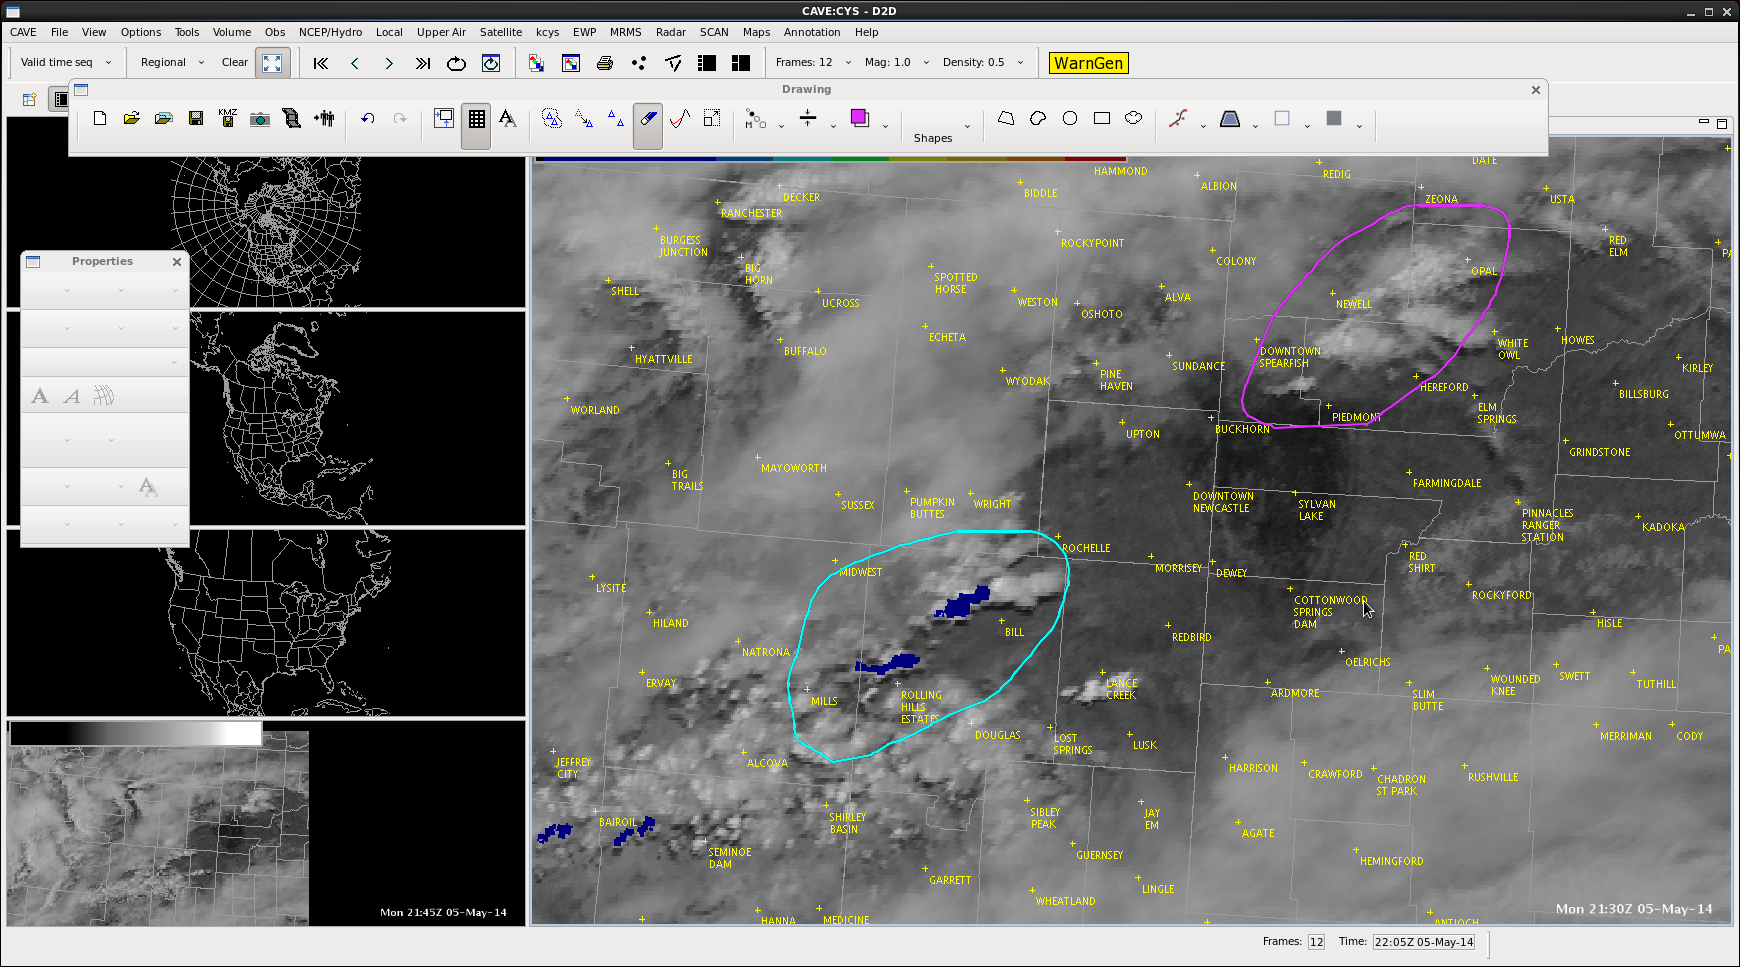
Monitoring eastern WY, western NE in an area outlooked for the possibility for some severe storms.

Was going to provide an outlook concerning the pros/cons concerning getting convection to launch…but storms developed in central WY that are headed east.

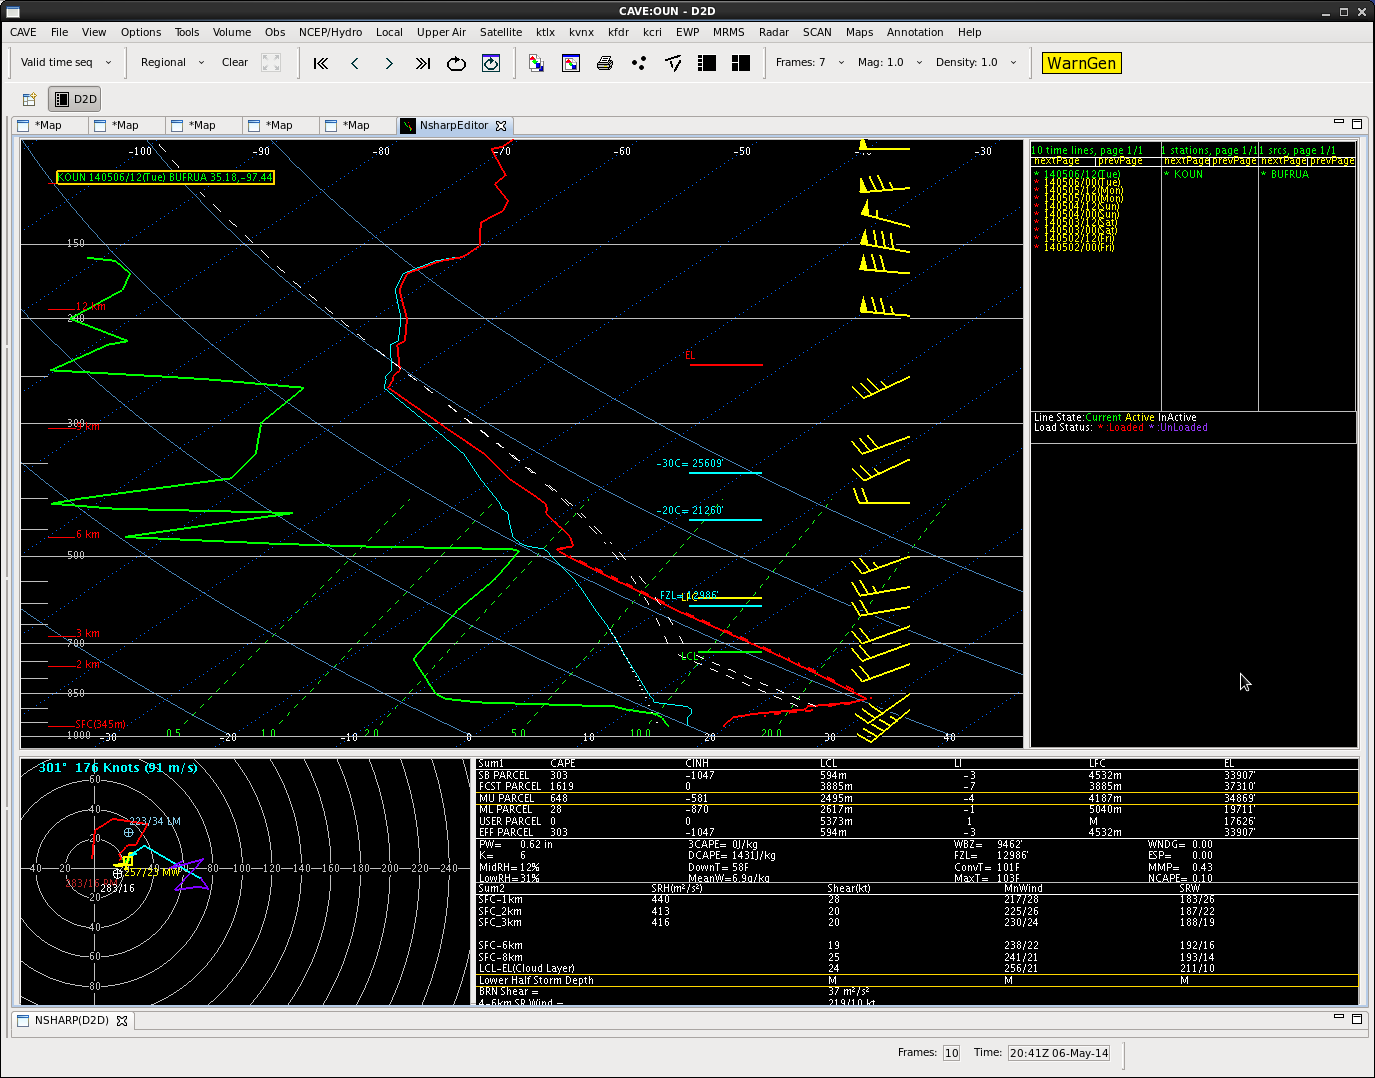
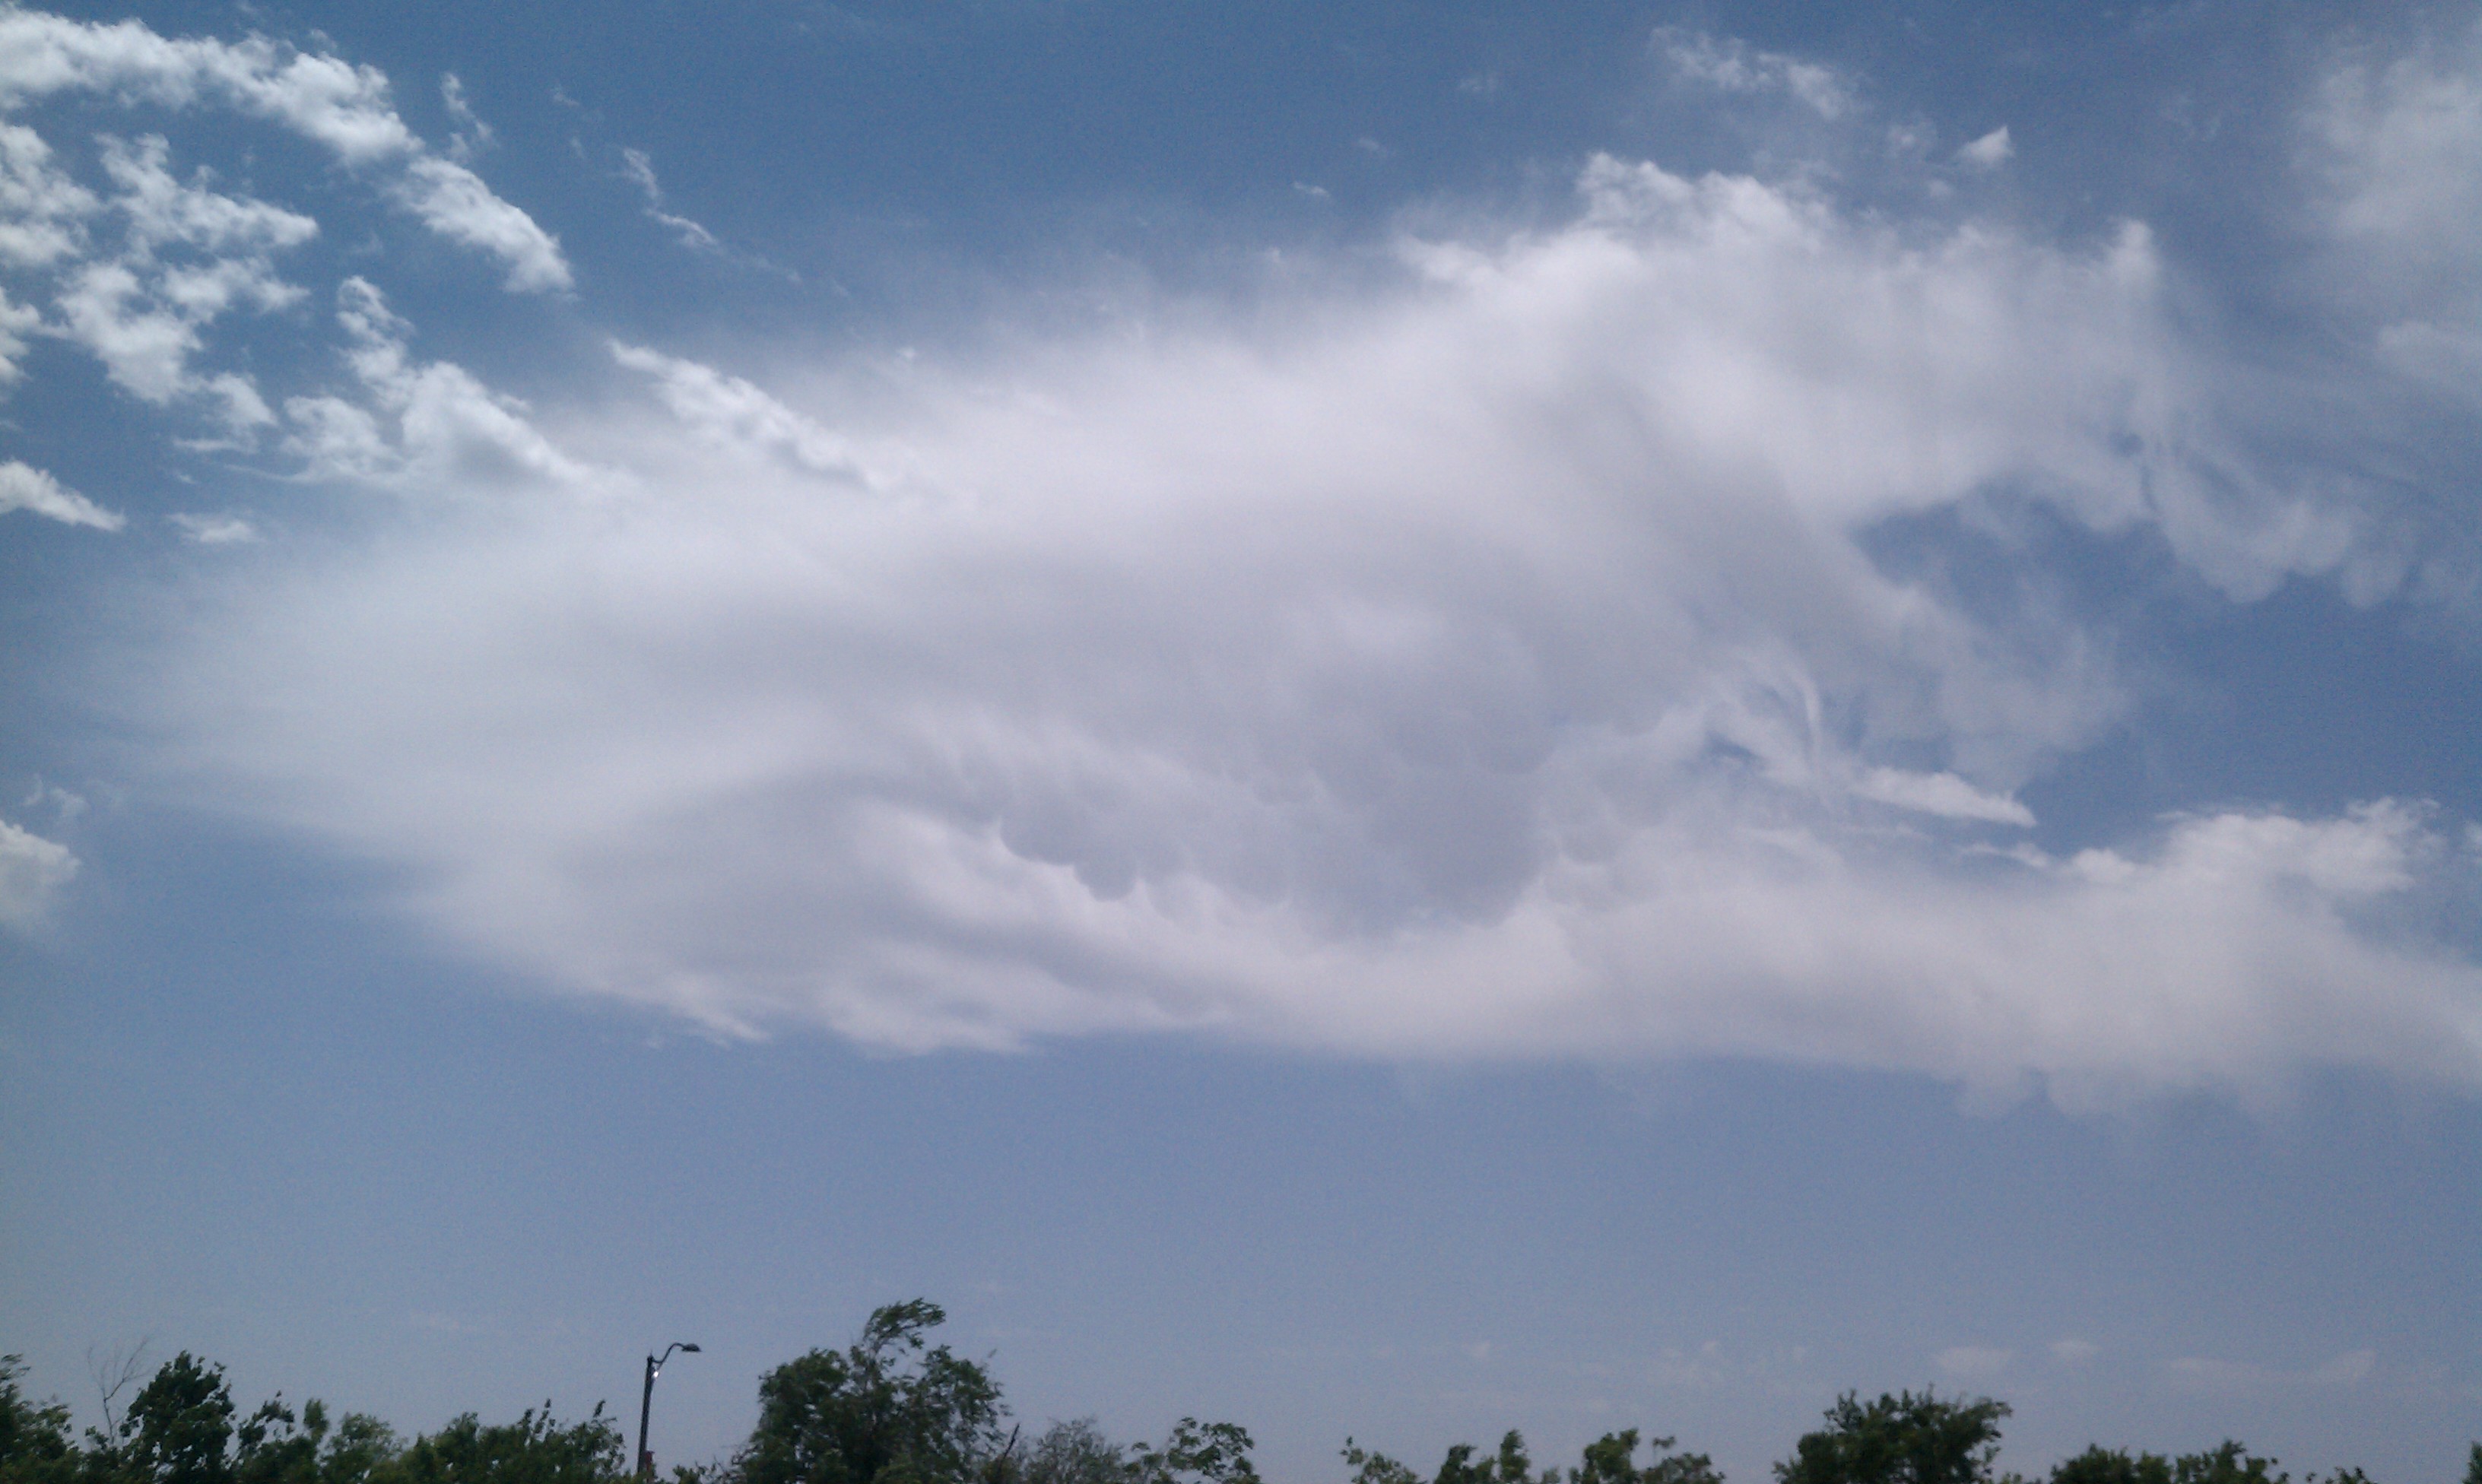
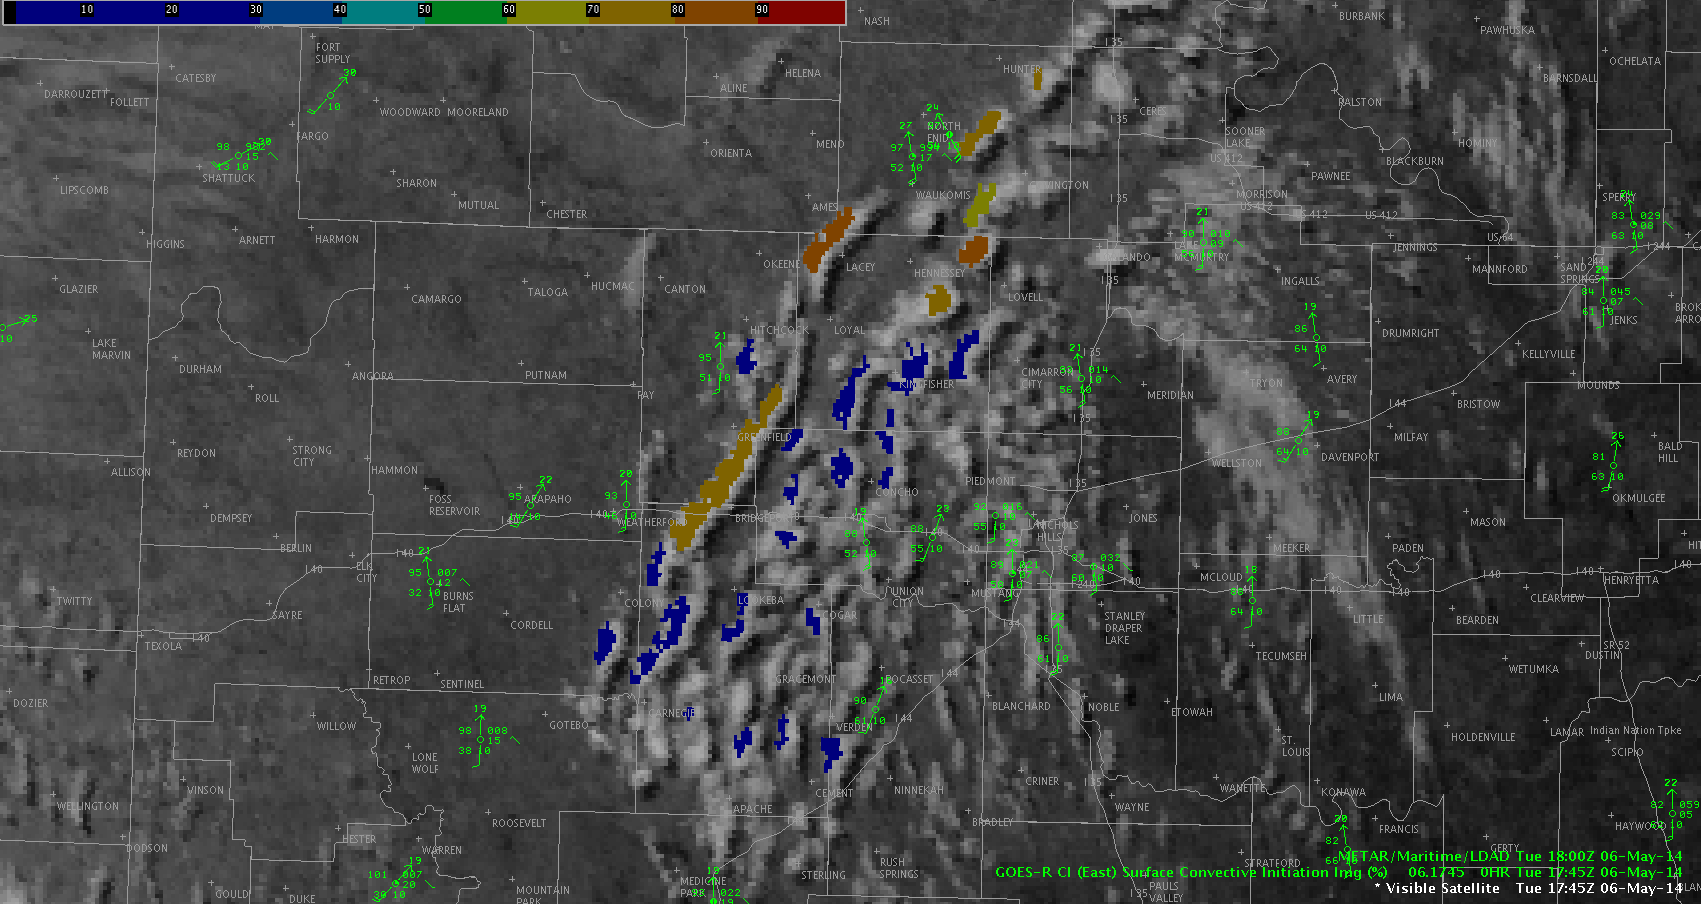
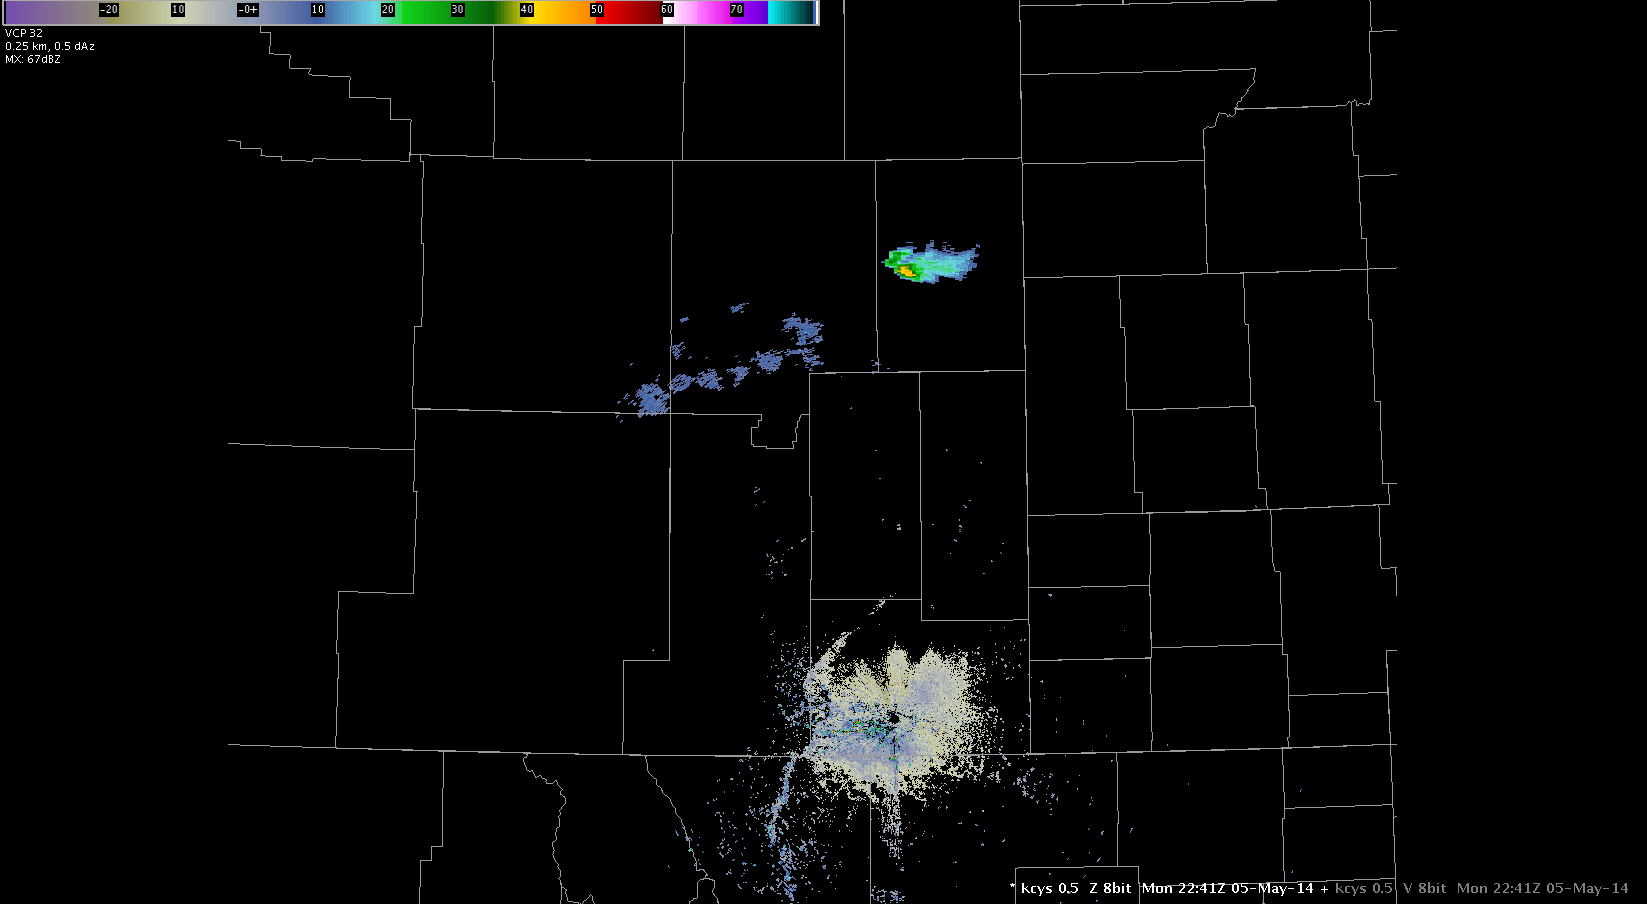
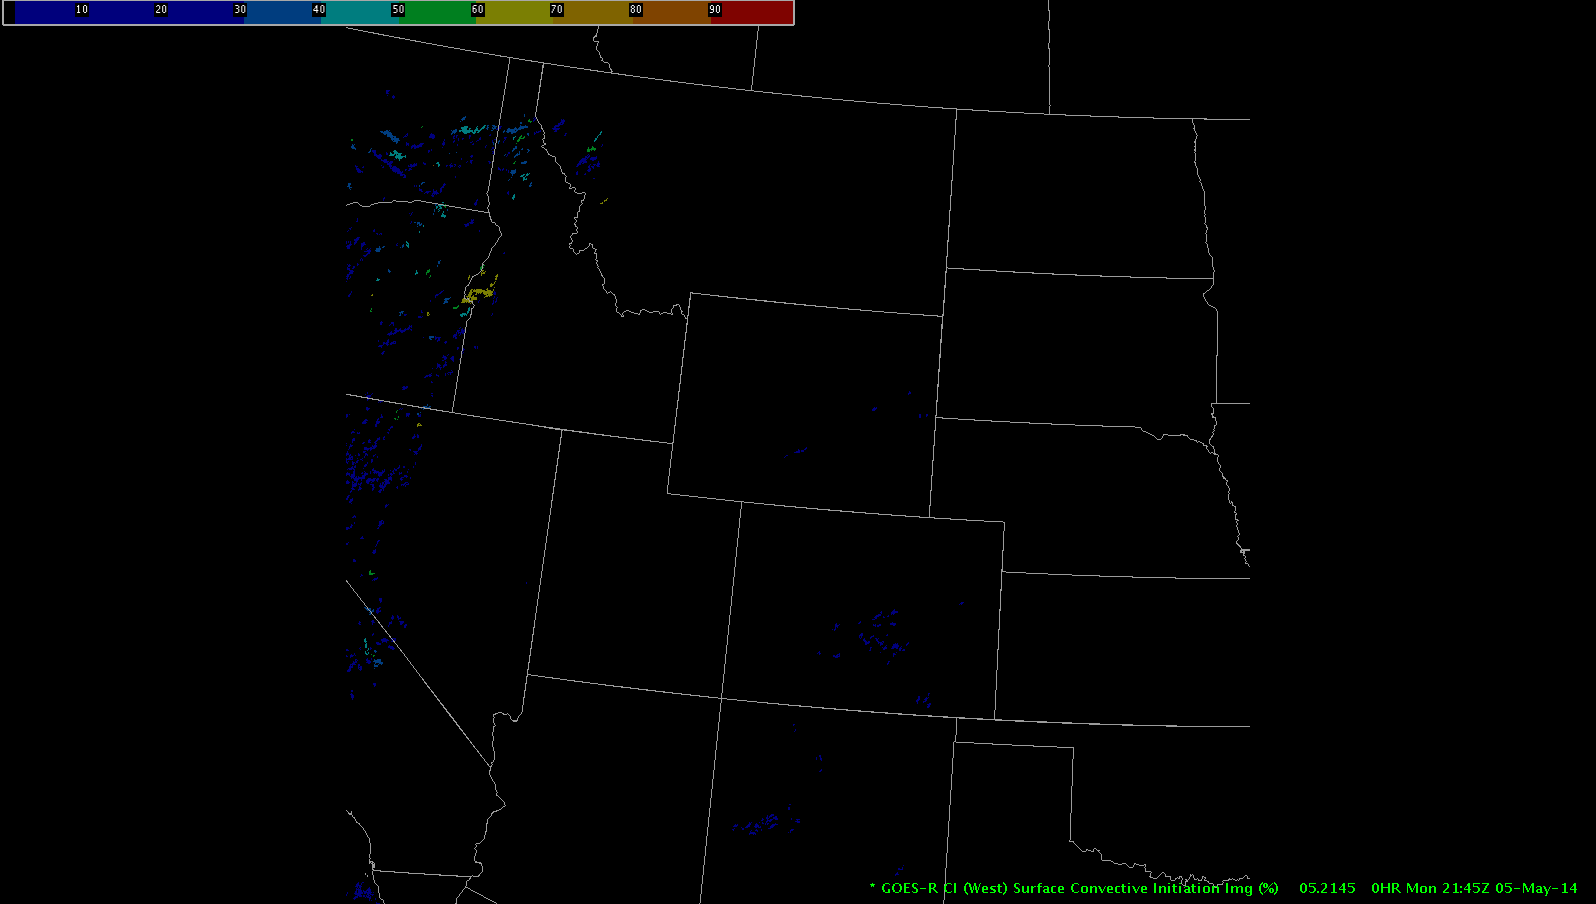
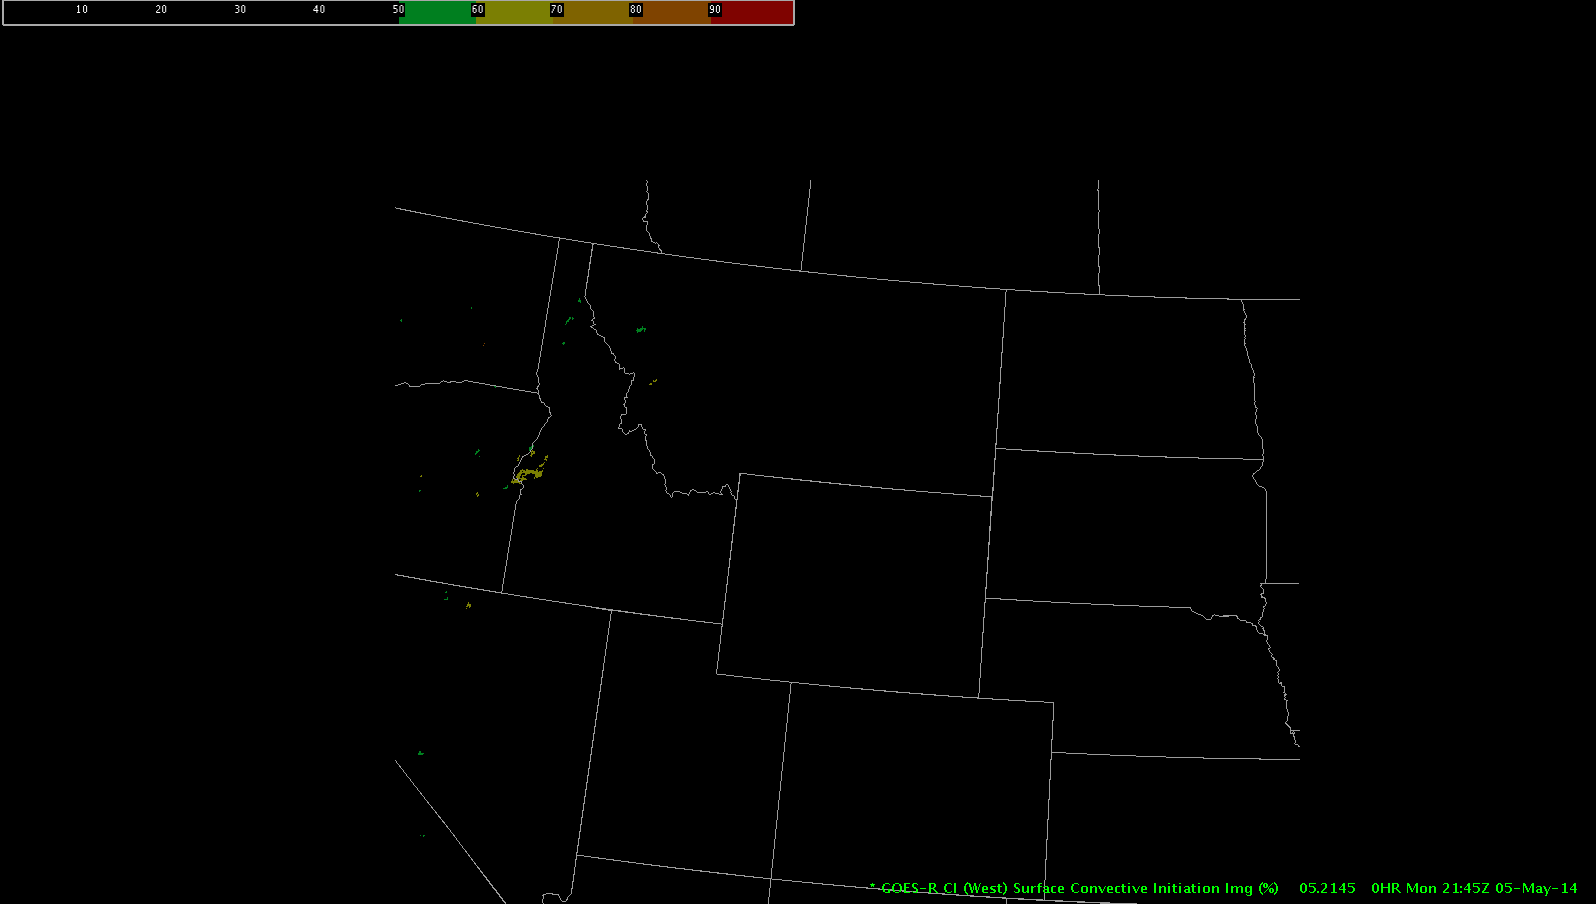
A severe storm developed…Probsevere was all over it.  CI was not a very useful tool as this developed due to quite a bit of cirrus

Also for the first time today saw an overshooting top.  It did display on the already severe storm.  Interesting is the fact that we need to mentally adjust to the parallax between this product and actual radar truth.  Products will not match up lat/lon to lat/lon!—db


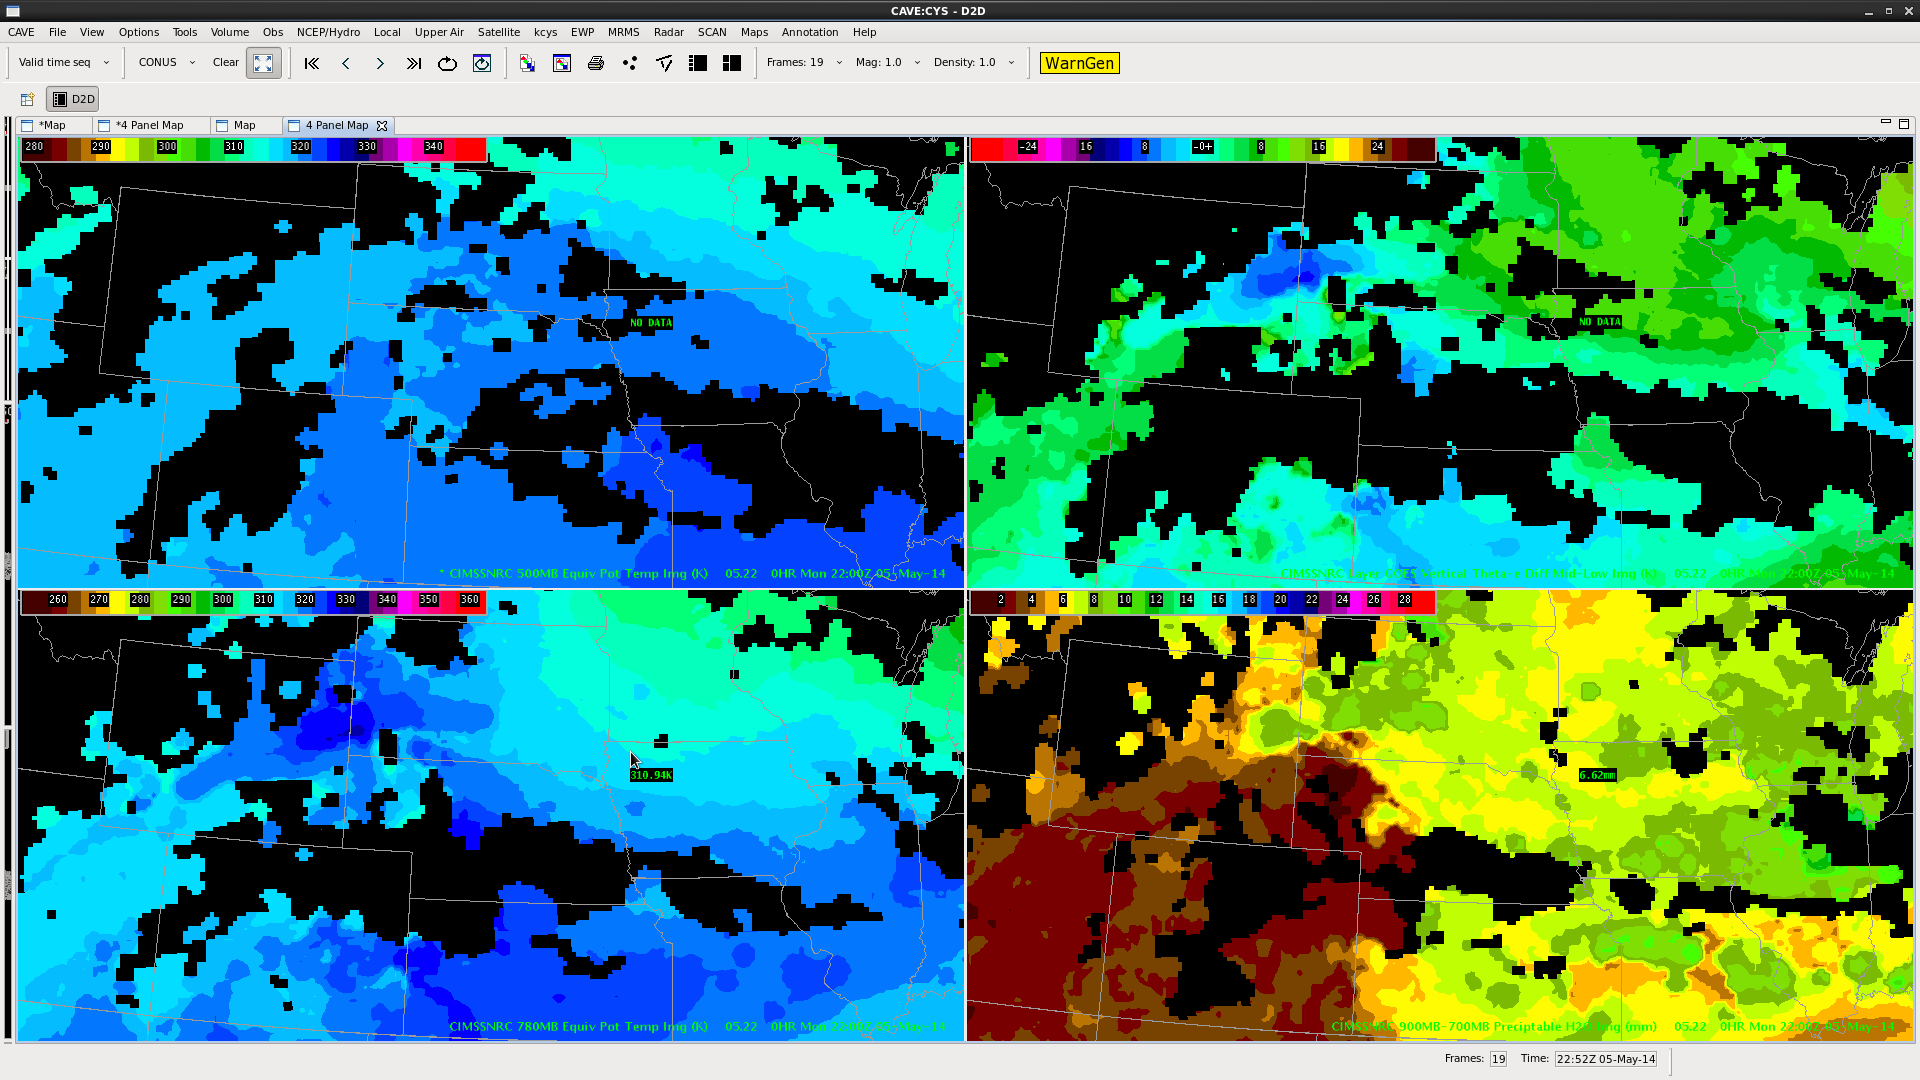
Update 2115Z:  storm still strong with possible severe hail…but has shown some weakening.  Overshooting top detection is no longer pinpointing anything,  Storm does continue to travel along a maximum in instability as seen in the vertical theta-e differences.  Interesting is that, while the forecast keeps that general instability around and along a path to the northeast of this storm, the Nearcast model also brings the highest instability back through to the west of where these storms are occurring.  Meaning current convection would be moving from higher to lower instability, relatively speaking—db

Tags: None

EWP Big Spring Day 2: 6 May 2014

We chose to sectorize the forecasters to two different regions…  Cheyenne, WY for Thoren/Bickford and Norman, OK for Rudge / Maples.

The forecasters have been asked to provide a mesosale forecast/graphicast discussion for each region (on the blog) by 2100 UTC.

The Wyoming group overlaps a bit with the forecast area of the EFP for day 1:

EFP_outlook

Though current convection is located farther westward in mountainous terrain.

Meanwhile the OK group is watching mixing in central and western Oklahoma:
sat_OK_animation

Nothing severe at the moment, but some interesting features including virga / mammatus visible at the same time:

IMAG0767

Expectation for severe weather increase Wed / Thurs for the experiment.

-K. Calhoun, Week 1 Coordinator

Tags: None

5 May CI Detection

5May14 1745Z CI Det

During afternoon cumulus development CI depicted higher probabilities upwards of 80%. Radar did not show much in the way of any precipitation. Sounding data showed very dry air in the low and mid levels with elevated instability, which may support virga. Physical observations were taken by a staff member, who stated that virga was evident. So far, the CI tool is proving to be more of an awareness tool. In a dry air environment forecasters would need to take initiative by investigating soundings to see if these high probabilities are legitimate. I would find that an 80% probability may create the “cry wolf” mindset if they do not verify more often. Would there be a way to incorporate sounding data to mitigate this issue?

Tags: None

Daily Summary: EWP Day 1

Our focus for Day 1 of operations was primarily training.  Forecasters were asked to examine each of the experimental products and produce blog posts as they saw interesting features.  The goal of this time period was to familiarize the forecasters not only with the products themselves, but also with AWIPS2 and the menu locations plus the process of screenshots and blogging.

Weather was relatively quiet throughout the CONUS, but we chose to operate in the Sterling, VA (LWX) and Cheyenne, WY (CYS) county warning areas.  Though no severe warnings were issued, the forecasters were able to examine almost all the products they would see this week.

SPC Storm Reports 5 May 2014.

In future weeks, it was suggested by the forecasters that a bit more time is spent in hands-on led training.  More specifically, the SAD screens should be utilized bringing up each experimental product with a corresponding PI-led discussion.

-K. Calhoun, Week 1 Coordinator

Tags: None

EWP Status for 6 May 2014: 1-9 pm Shift

EWP Status for 6 May 2013: 1-9 pm Shift

We will begin the day in the HWT for the EFP briefing at 1pm before reconvening in the DevLab at 1:30 pm for a day 1 debrief.

A variety of locations are possible for operations on Tuesday: (1) Cheyenne or North Platte CWAs (terrain induced w/possible hail threat). (2) Des Moines CWA or larger MS Valley Region (though this appears to likely be capped or delayed until overnight) or (3) Dryline activity in Western OK through South Texas (probability appears low in this region).  None of these options are highly appealing at the moment, but hopefully the situation will evolve and become a bit clearer before operations begin.

-K. Calhoun, Week 1 Coordinator

Tags: None

Nearcast Convection

I had been scouring through some of the satellite and radar images in East Central Wyoming. WV/IR was showing some of the higher cloud tops through Southeast Wyoming. At one point a small area was depicted on the OTD. At this time, there was no activity on radar through southeast Wyoming.

On visible satellite, clouds began to develop in East Central Wyoming. This is where some of the first radar returns were coming in at 40+ dbz. When referring to the Nearcast the vertical Theta-e Diff was showing as much as -10.6K. It was on the edge of this difference (gradient) where convection was taking place, as seen below.

C IMSS Theta E VIS SAT CIMSS Radar CIMMS

Tags: None

CI Hit in TN…no storms

21:45 Z…had an area of 60% CI in NE TN (Claiborne Co.) on Cu developing in conjunction with a little disturbance and perhaps some outflow from convection farther west.  No storms an hour later.  A reminder to use these tools in conjunction with all your other tools and be aware of the overall set-up.   Minima in theta-e and precip. water were trending that direction as well.

Tags: None

Surface Convective Initiation Application

The CI product is deemed most useful leading up to a severe weather event. As intended, it seems that it can provide at least an idea where convection will occur. There are two things that came to mind when looking at this tool.

On quieter days this tool can become noisy. By editing the colors in the RGB color model, I was able to black out all probabilities below 50% and to clean up the product. This will bring attention to the higher probabilities, as opposed to cluttering the field with lower end probabilities. The threshold (<20%, <30%, <40% etc) a person chooses to ignore is up to the user. To do this, though, you must continually edit the color model. This isn’t difficult, but  takes time. It would be nice if a default button existed that allows you to black out a specified range. Below is a result between the two (normal view 1-100% and 50-100% probabilities, respectively):

CI 1-100 CI >50

The second thought pertains to what application this could have during lake effect snow events. In the proper environment, convective snow banding could lead to heavy, consistent snowfall of greater than 35 Dbz. This may be a useful tool for updates to geographical locations of higher intensity snowfalls in these events.


Tags: None

GOES-R-CI

GOES-R CI

GOES-R CI product shows low chances for convection in EC Wyoming

Isolated weak storms formed just north of the Black Hills with no probability

of CI (could be a thin cirrus issue).

Bthoren


Tags: None