An official website of the United States government
Here’s how you know
Official websites use .gov A
.gov website belongs to an official government
organization in the United States.
Secure .gov websites use HTTPS A
lock (
) or https:// means you’ve safely connected to
the .gov website. Share sensitive information only on official,
secure websites.
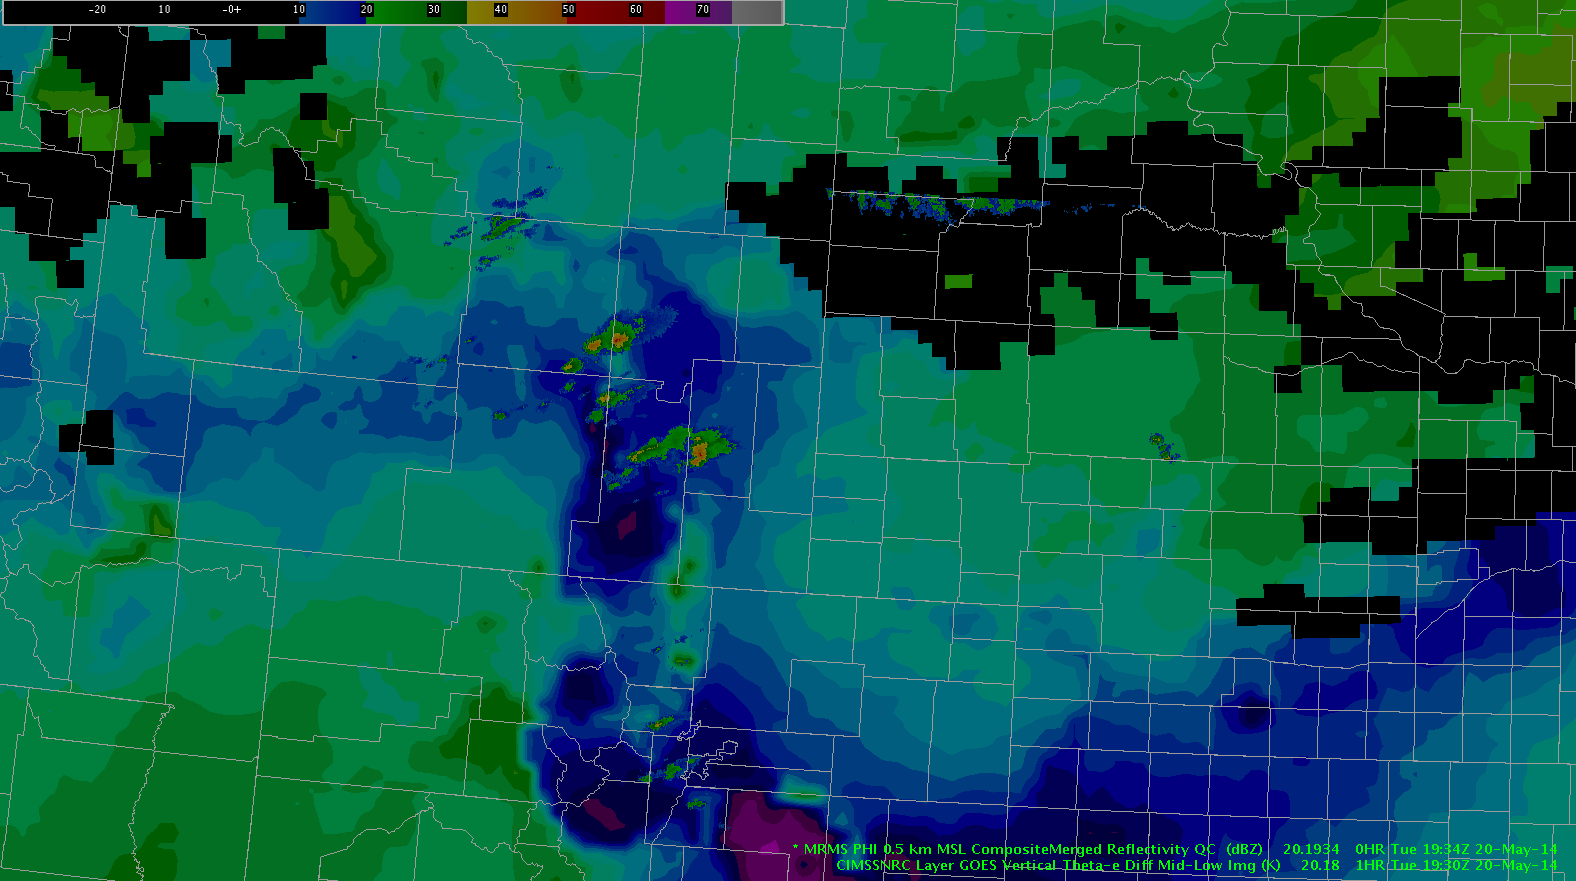
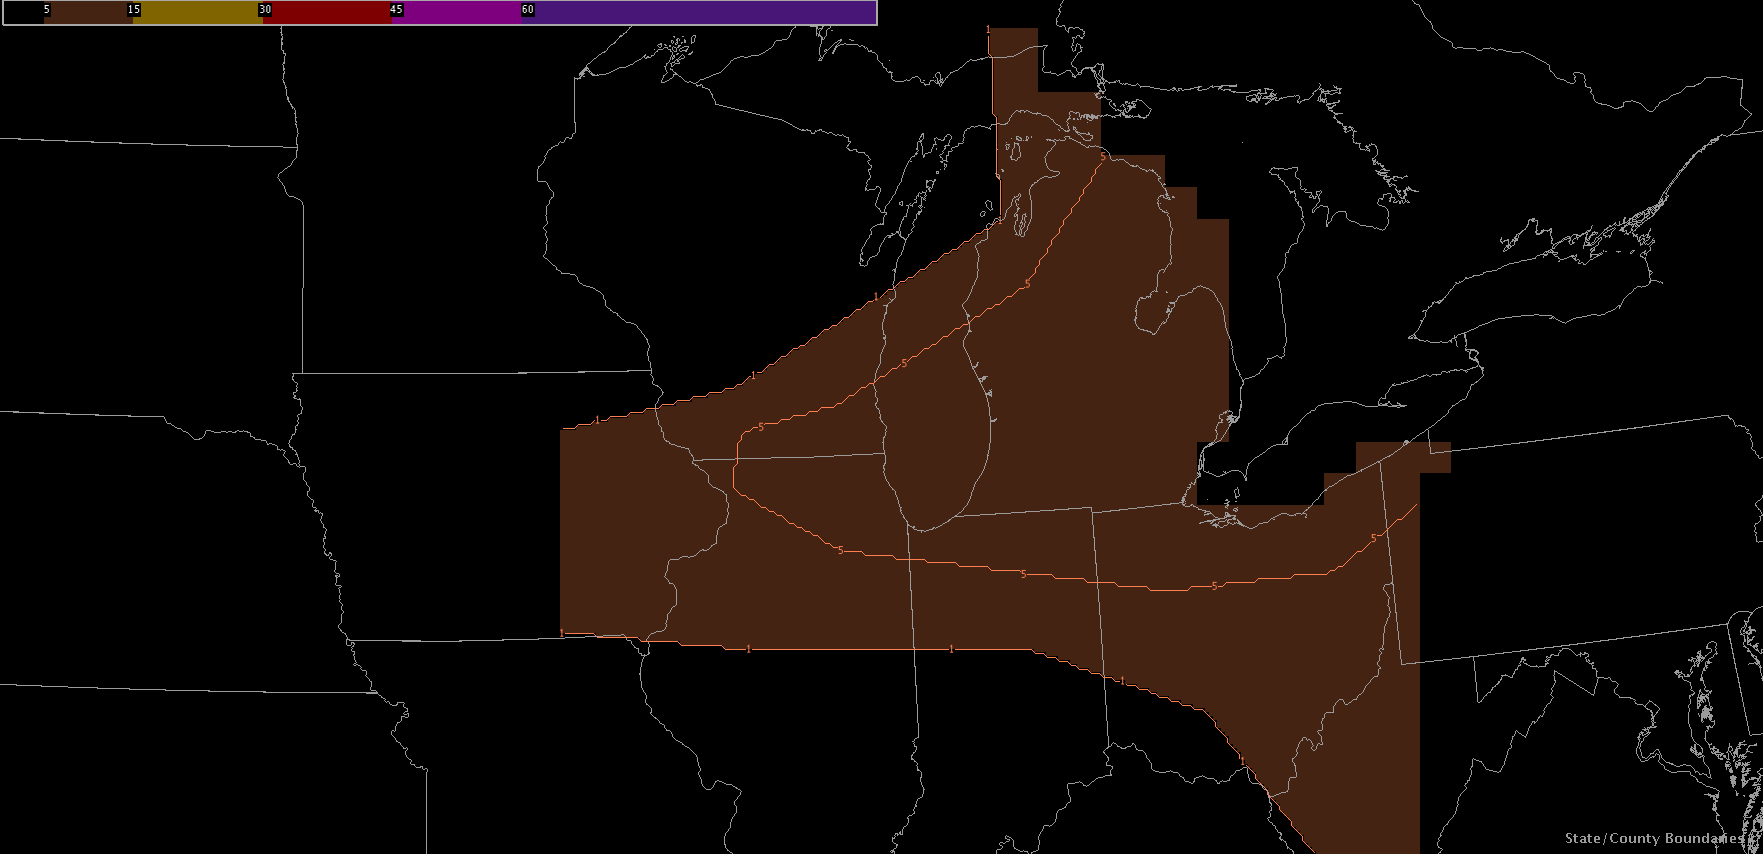
We have overlaid the MRMS combined reflectivity here and the theta-e difference for the storms developing in eastern WY. The storms appear to be developing in a region of the highest instability for the region indicating they could intensify as they continue to develop. It also indicates that the instability axis is fairly narrow.
Initial impressions today indicate that the NearCast model is providing additional confidence to what the visible satellite imagery is indicating. In the above visible imagery there appears to be a nice surfaced-based CU field from eastern NEb into northwest KS and then extending into southeast WY. On the NearCast model there is a ribbon of highest instability along this axis of CU as well.
Another somewhat marginal day ahead for Tuesday with a two possible regions of potential convective initiation during the afternoon hours. SPC Provides two regions with a “SEE TEXT” designation.
SPC Day 2 Outlook issued at 1730z.
1) Northern Colorado/SE Wyoming – Upslope flow as the low pressure moves south through Nevada will provide a lifting component but lack of forecast surface moisture provides low confidence in sustained deep convection over the area. Regardless, high-based convective potential will be entertained in this region due to its collocation with the Northern Colorado LMA.
2) Northern Illinois/Southern Wisconsin – A cold front will progress across the upper Midwest through Tuesday, paired with surface moisture feeding into the region from the south. Forecast soundings show a weakening inversion from 21z to 00z where in NW Illinois, SW Wisconsin where the front is forecasted to propagate tomorrow afternoon. This coupled with high unidirectional shear aloft will provide the best change for long-lived convection with wind and hail being the primary threats.
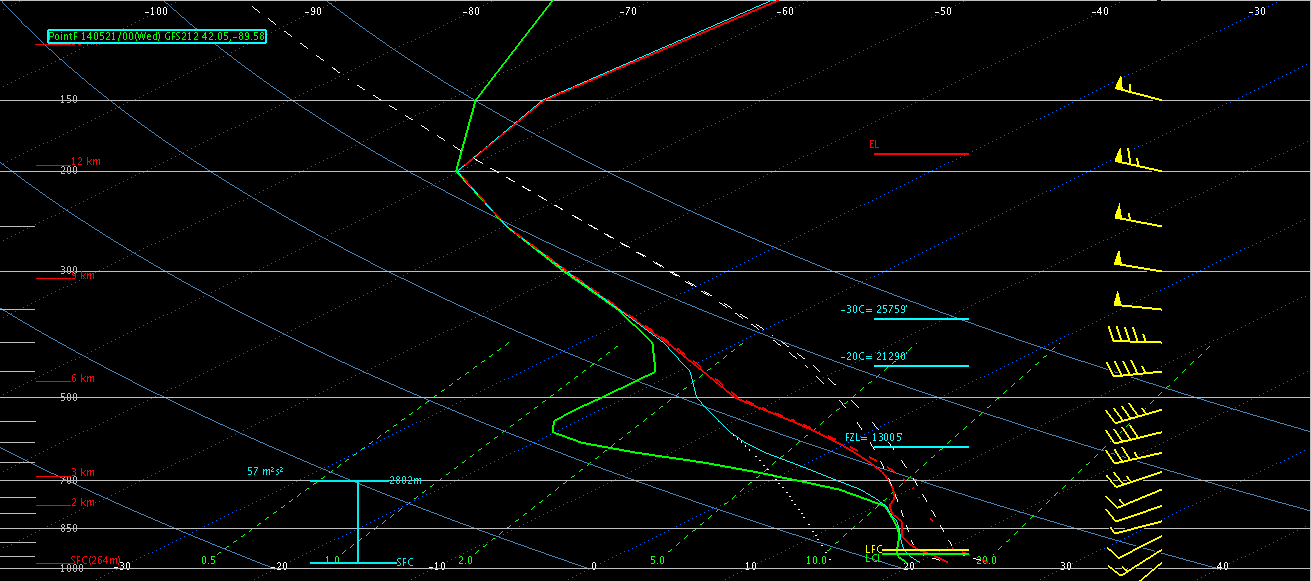
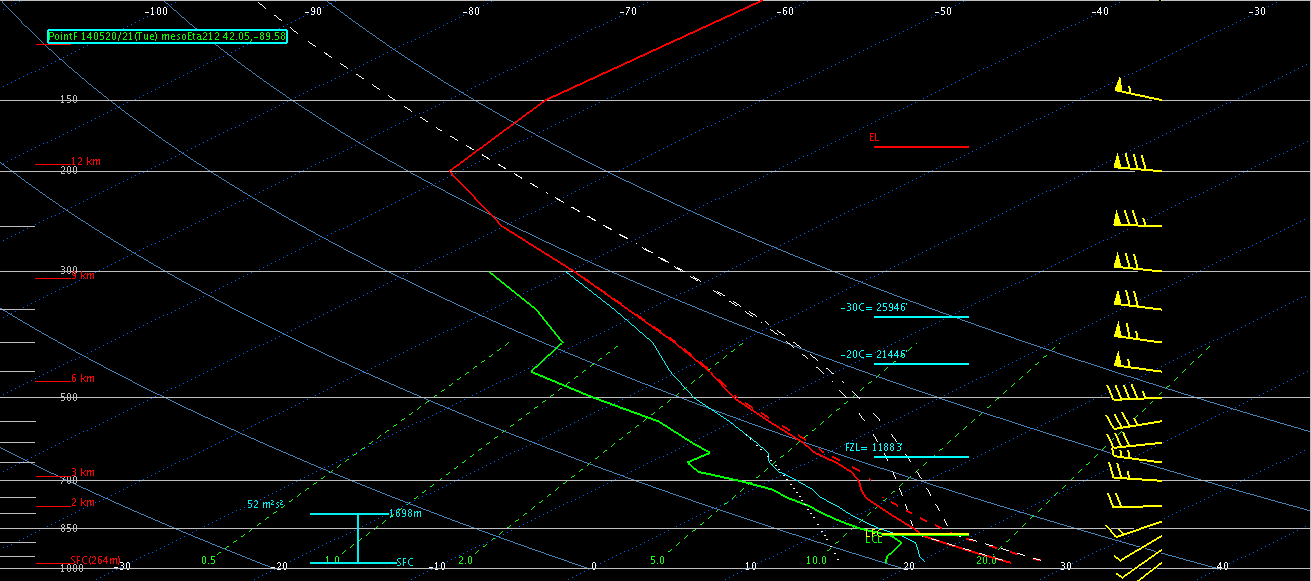
GFS40 00Z forecast sounding in Ogle County, IL.NAM40 00Z forecast sounding in Ogle County, IL.
EFP Day 2 probabilistic forecasts match this assessment with 5%-10% probabilities of wind/hail in the area.
EFP Day 2 Probability of Hail forecast.
We will meet in the HWT at 1pm to participate in the EFP forecast briefing before having the Monday product debrief in the Dev Lab.
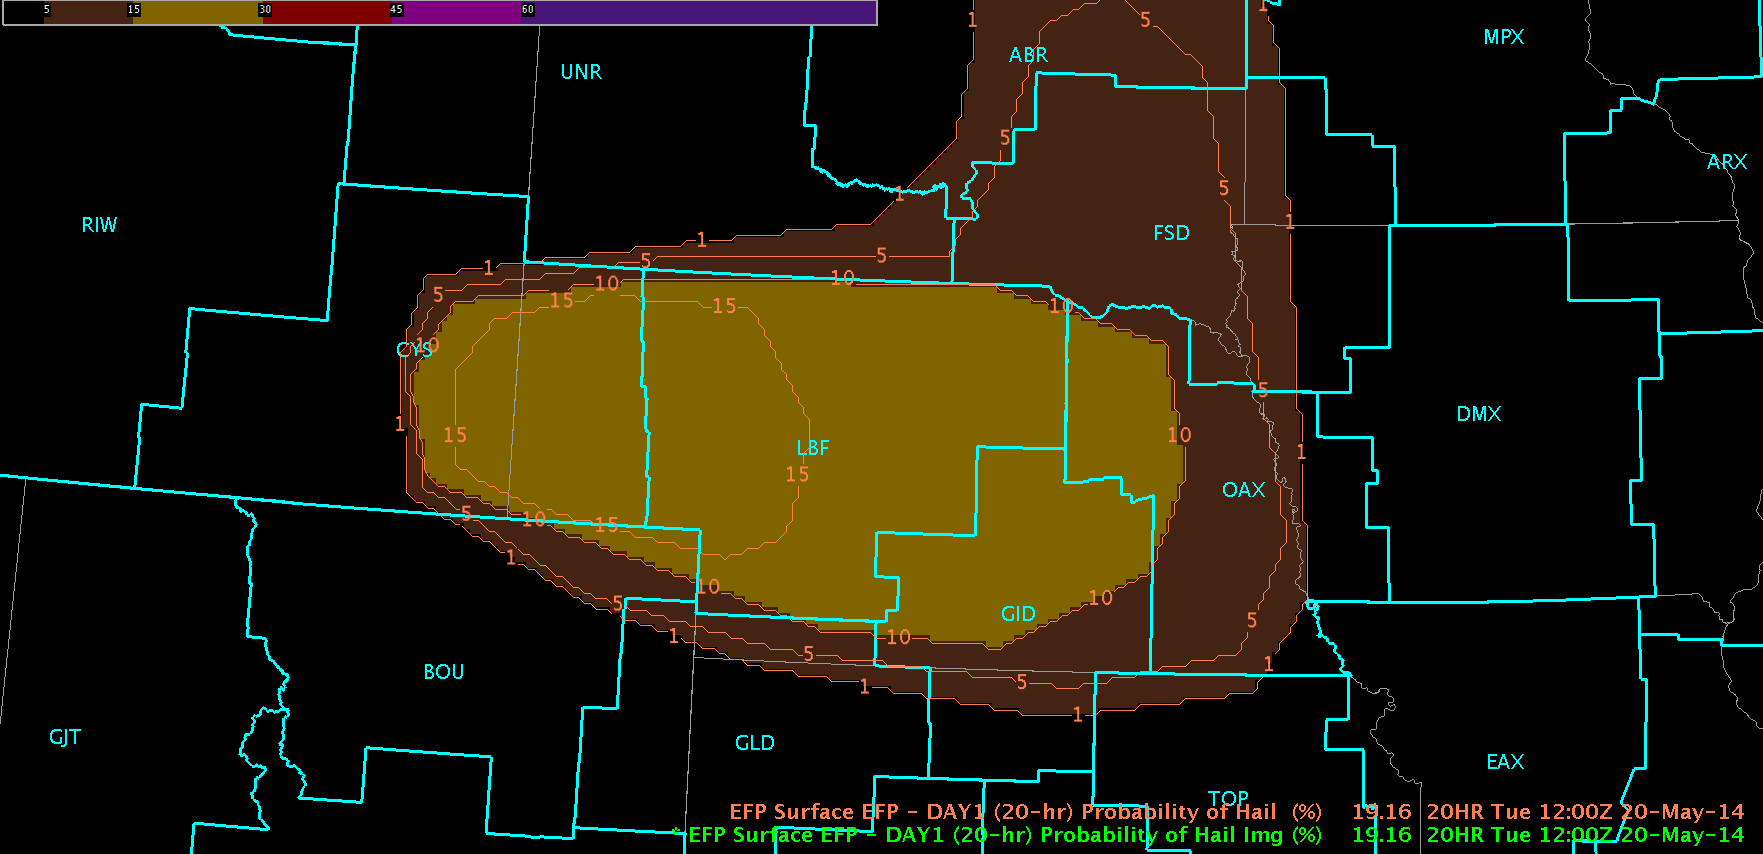
Today started with such promise (or blind optimism…whatever you want to call it): an isolated region of “SLGT” risk encompassing parts of of SE Wyoming and W Nebraska with many storm-scale models showing isolated thunderstorm initiation around 21z. EFP probabilistic forecasts were focused in this area as well.
Day 1 forecast probability of hail. A 20% bullseye was located in the CYS and LBF CWAs.
Forecasters were situated in the Cheyenne, WY (CYS) and North Platte, NE (LBF) for the duration of the shift on the edge of their seats waiting for initiation.
We must realize that not all days will be “end of the world” scenarios, and today provided a great medium for forecasters to be exposed to several of the experimental product sets for comparative analysis and evaluation (sans OUNWRF).
Forecaster/Investigator interaction during the early evening on May 19th.
vLAPS was utilized to (1) identify and diagnose regions of enhanced instability (mainly CAPE) and (2) validate forecast composite reflectivity with MR/MS composite reflectivity. Throughout the day, comparative analyses of the NSSL-WRF simulated satellite imagery with real-time IR/WV fields were analysed. Any convection was immediately pounced upon with Super-Rapid Scan visible analysis, ProbSevere and Convective Initiation product analyses. NearCast was utilized to gauge storm lifetime and identify regions of destabilization.
The tracking meteogram was put through its paces today with numerous data dropouts observed in the time trend graph during periods were these data were available. Forecasters consistently wanted to use the 0.5 deg reflectivity mosaic product for tracking.
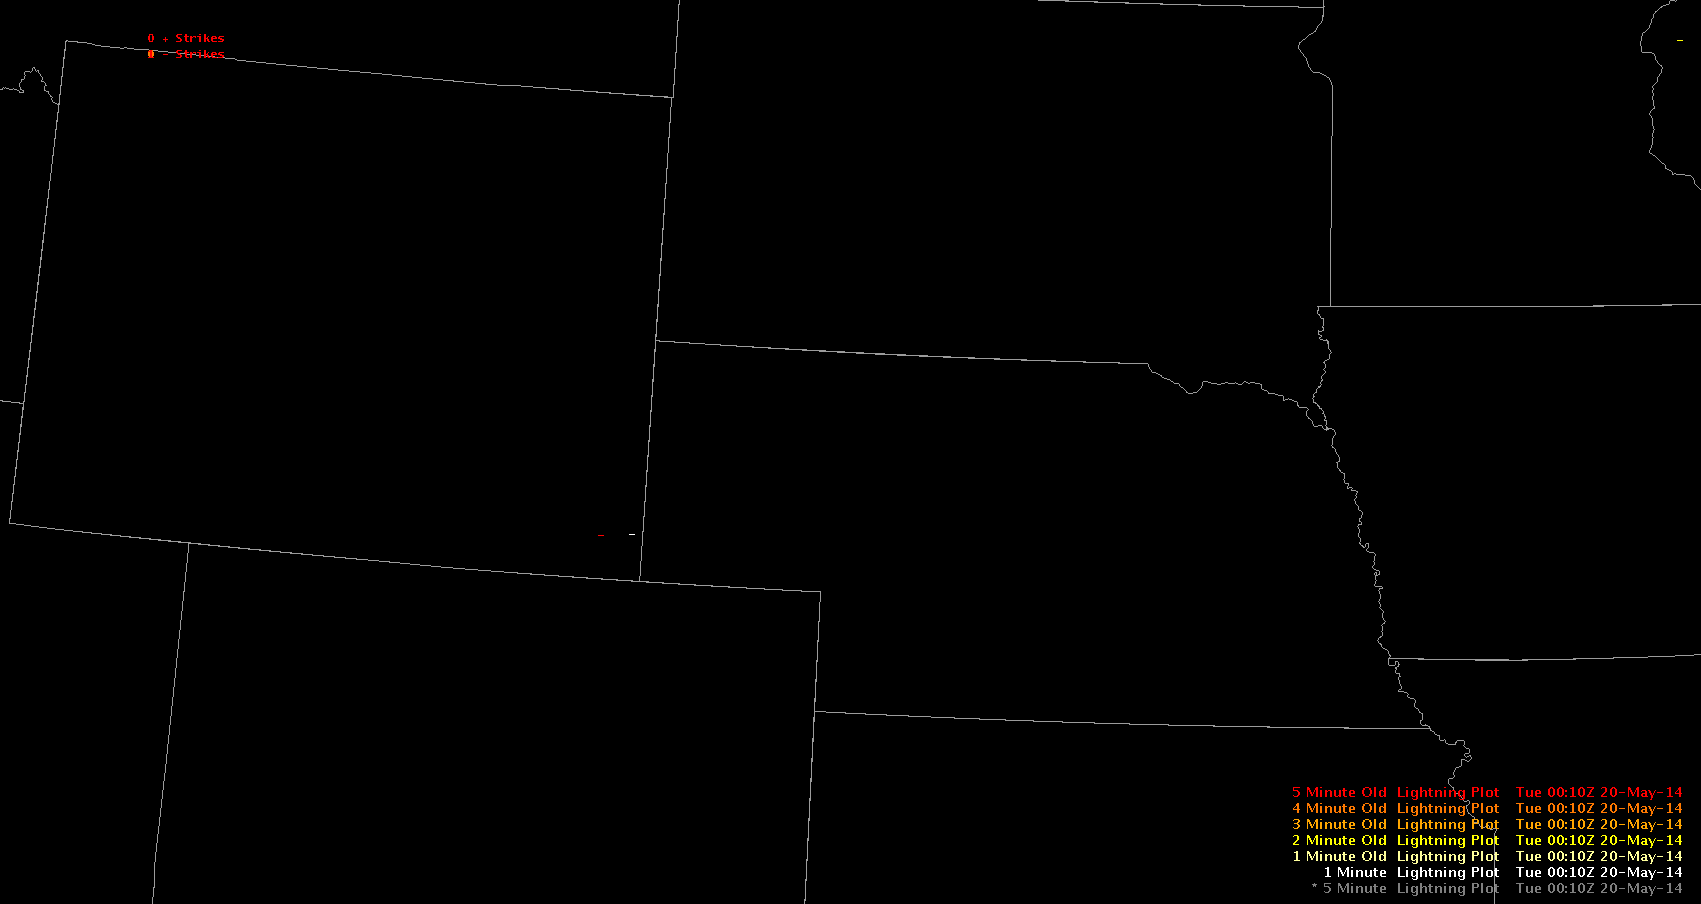
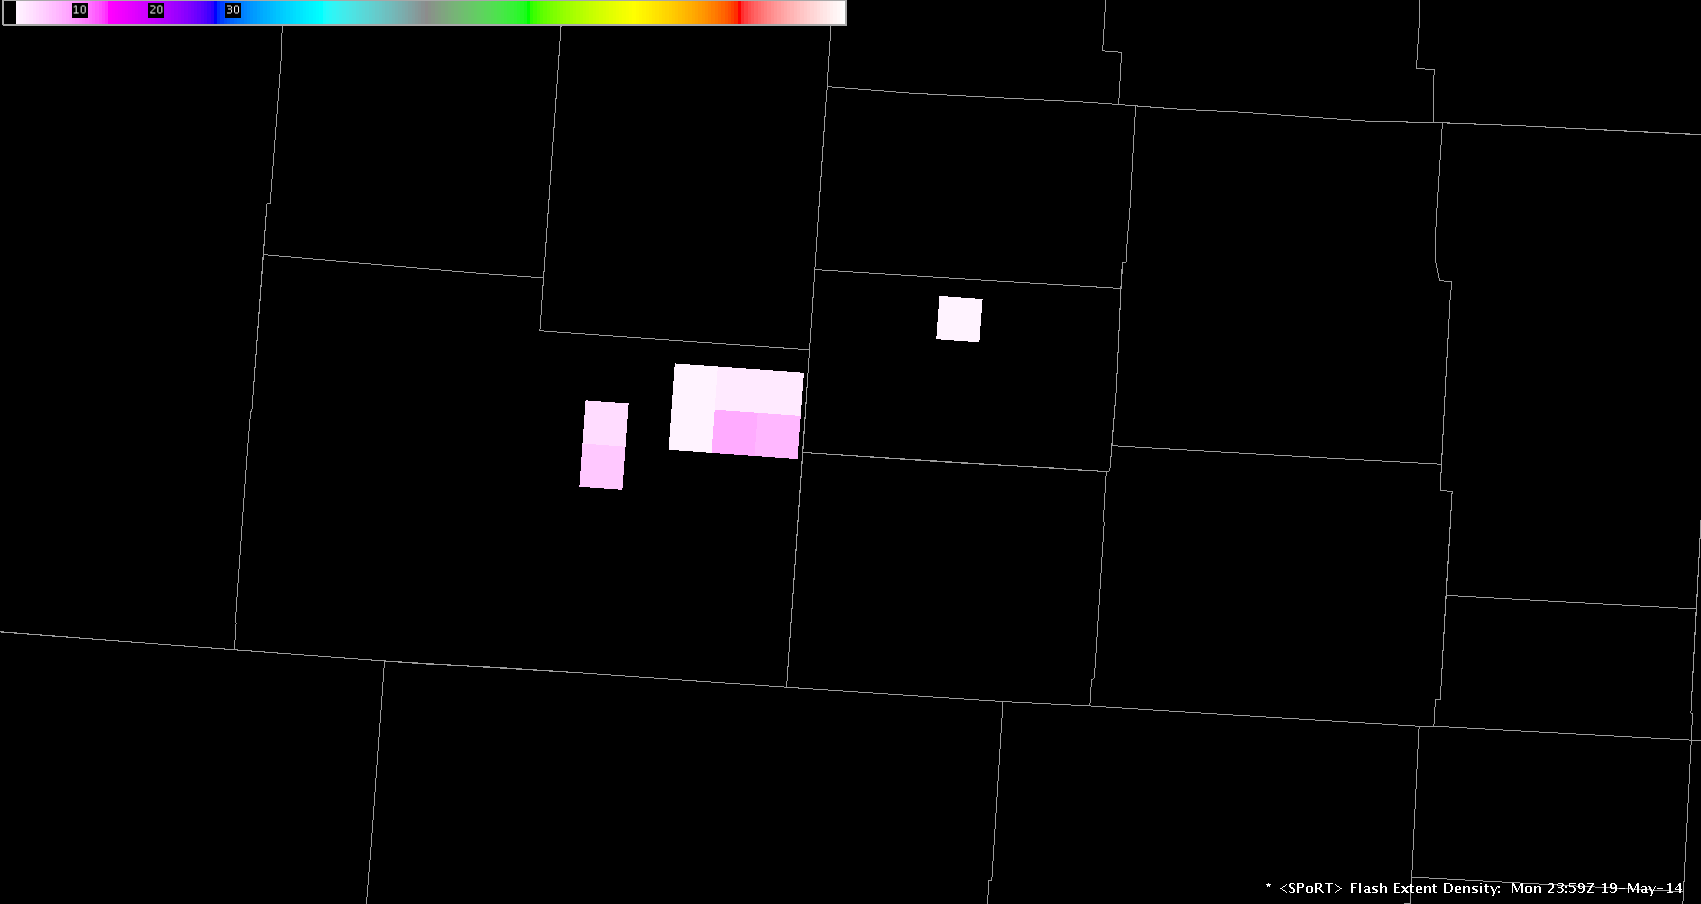
Near the end of the shift, total lightning from the Northern Colorado LMA was observed in Laramie and Kimball Counties in Wyoming which gave forecasters (1) exposure to the SPoRT LMA plugin and (2) guidance on how total lightning information can be combined with other sensor information (e.g. radar, satellite) in the storm interrogation process.
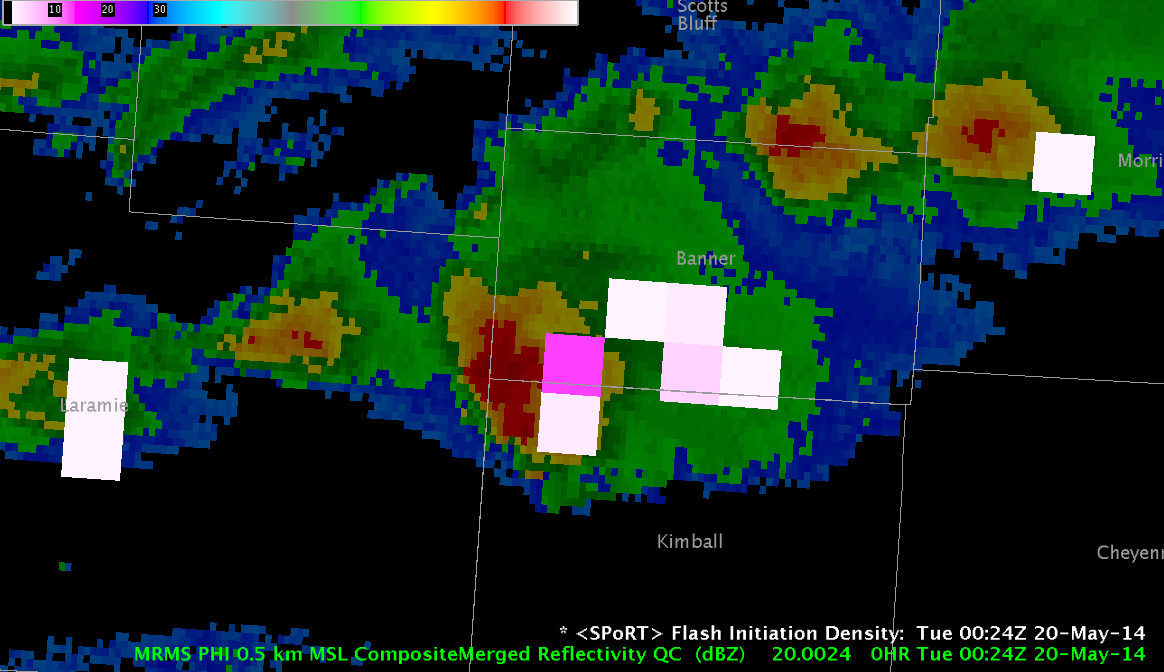
Flash Initiation Density and MR/MS Merged Reflectivity combination at 0024z.
The PGLM Total Lightning shows you the “spider web” of the lightning strike, a much bigger area spatially then the particular point on the ground the bolt hit as you see below. It will definitely help me warn viewers ahead of time that there could be lightning in there area before it actually hits the ground. Great Product!
I haven’t been able to us the lightning jump detection to see how that does. Hopefully later this week. ~ Danielle
Overlaying the 0.5 km MSL composite merged reflectivity with the flash extent density showed some interesting things. The image below shows a positive correlation between flash extent density and reflectivity.As the flash extent density increased, the reflectivity increased as well, which can be seen from the meteogram. Furthermore, the increase in reflectivity appeared to be a response to the increase in flash extent density. For example, flash extent density displayed an increase in its value while the cell of interest still had relatively low reflectivities (<= 30 dBz). In the successive image of 0.5 km MSL composite merged reflectivity, a large increase in reflectivity was observed. Additionally, the max reflectivity of the cell seemed to approximately follow the max in flash extent density, with the location of max flash extent density remaining slightly out ahead of the location of max reflectivity.
This image is displaying Flash Initiation Density and Flash Extent Density in addition to the typical 5 minute lightning plot. What stands out here is that larger areas of the storms are more electrified than viewed by just the 5 minute lightning plot. This helps the forecaster determine better what the arrival times to use when they are considering TS or VCTS for amendments to TAFs or may help in giving a better ETA of lightning for large events such county fairs for emergency managers or spot fires other IDSS customers.
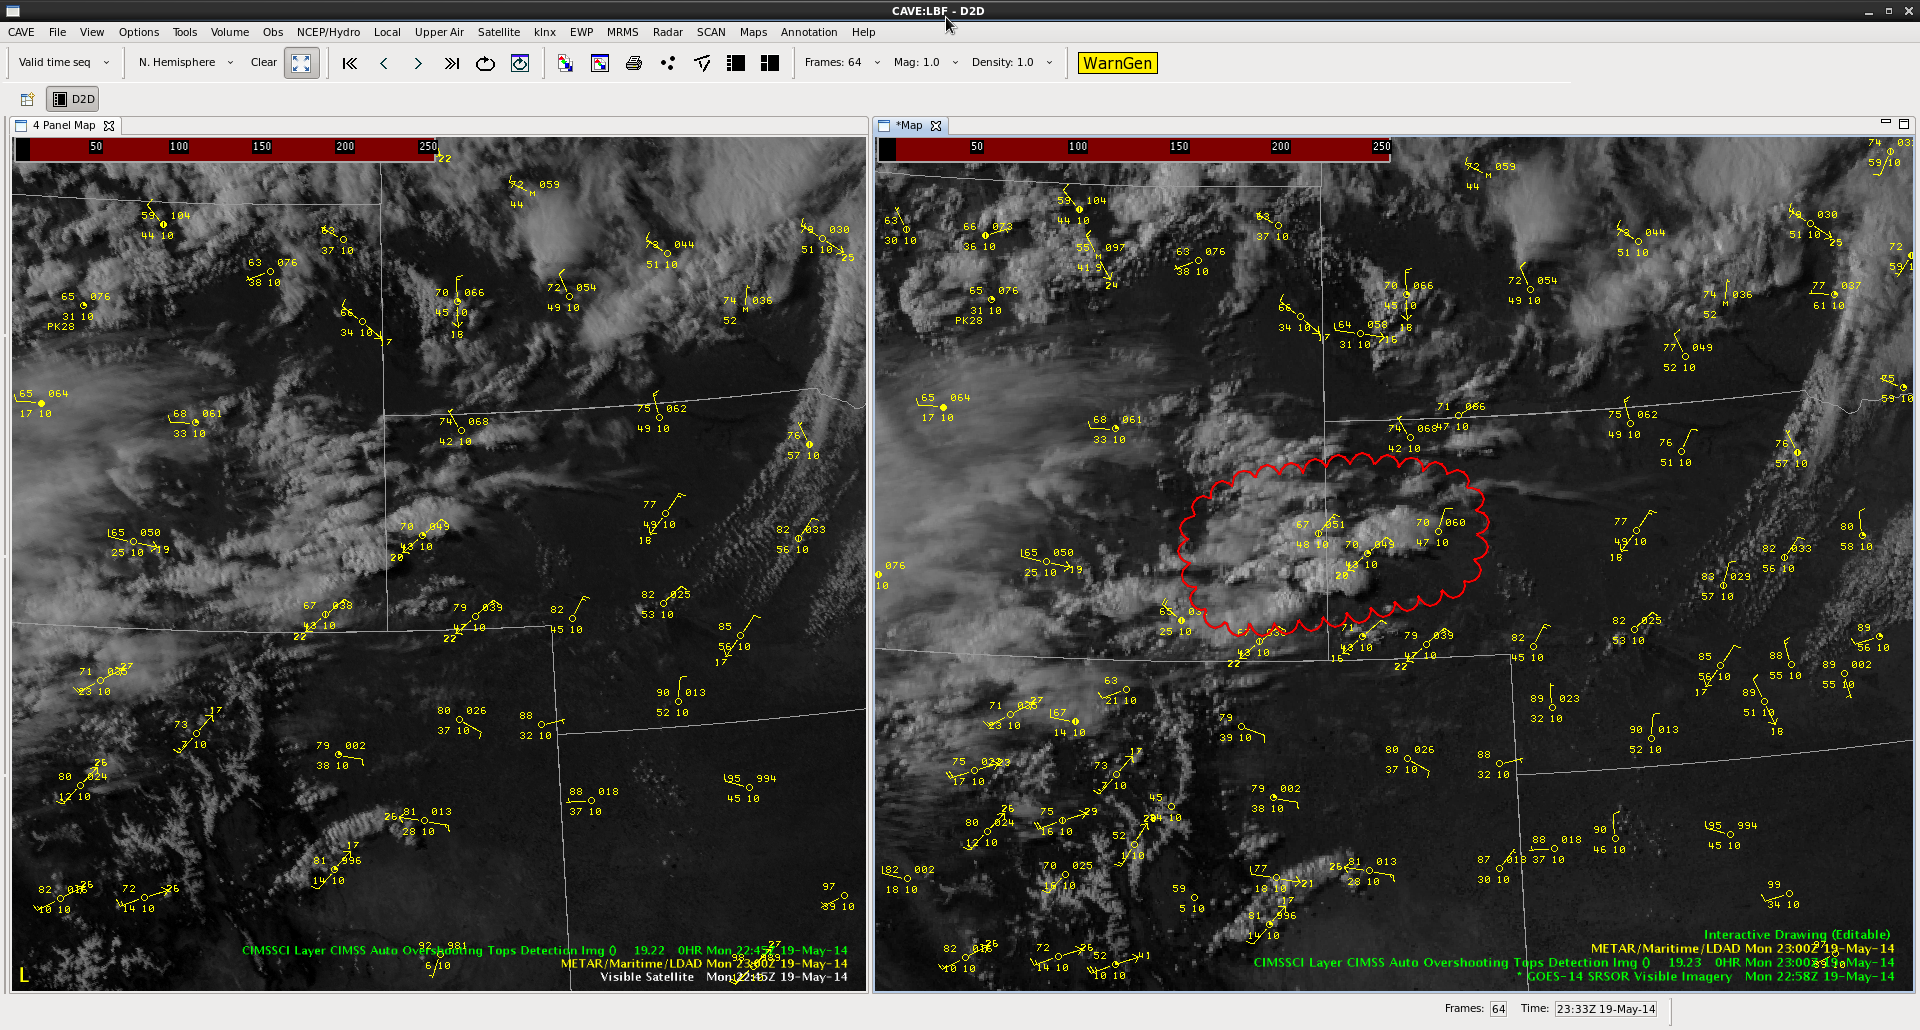
Having one minute satellite data available to be able to see the finer details of storm evolution/de-evolution is one of those products that is incredibly helpful. In the screen capture below, you can see a side-by-side picture of the traditional view of visible satellite data only being updated every 15 minutes (with a longer lag time to actually ingest the product for viewing) on the left and super-rapid scan on the right. Between 2245Z (left) and 2258Z (right), you can see what has occurred near the WY/NB border in just a 13 minute time period. While not terribly significant with this evening’s weather activity, it is still noteworthy and I can only imagine the cloud features that we’re missing to indicate storm development and trends without SRSOR.
In the image above the NearCast model indicates a gradient in the theta-e across western into northeast Nebraska. The visible satellite image (upper right) indicates a line of congestus along this gradient from near the SD border into central Nebraska. The GOES-R CI indicates some fairly high probability of initiation in this CU field. It is interesting though because this area is behind the surface front and there is little surface forcing for CI. Given the large-scale and mesoscale forcing in this area it seems like CI would be unlikely.
Looking forward two hours at the simulated IR/WV imagery versus observed (and remaining focused near the WY/NB border), the spatial placement is fairly good but intensity continues to be overdone. Here’s a snapshot at 22Z:
As aforementioned, the simulated product provides some confidence in where to remain situationally aware but does not give confidence if taken strictly at face value when taking the overall picture into consideration.