

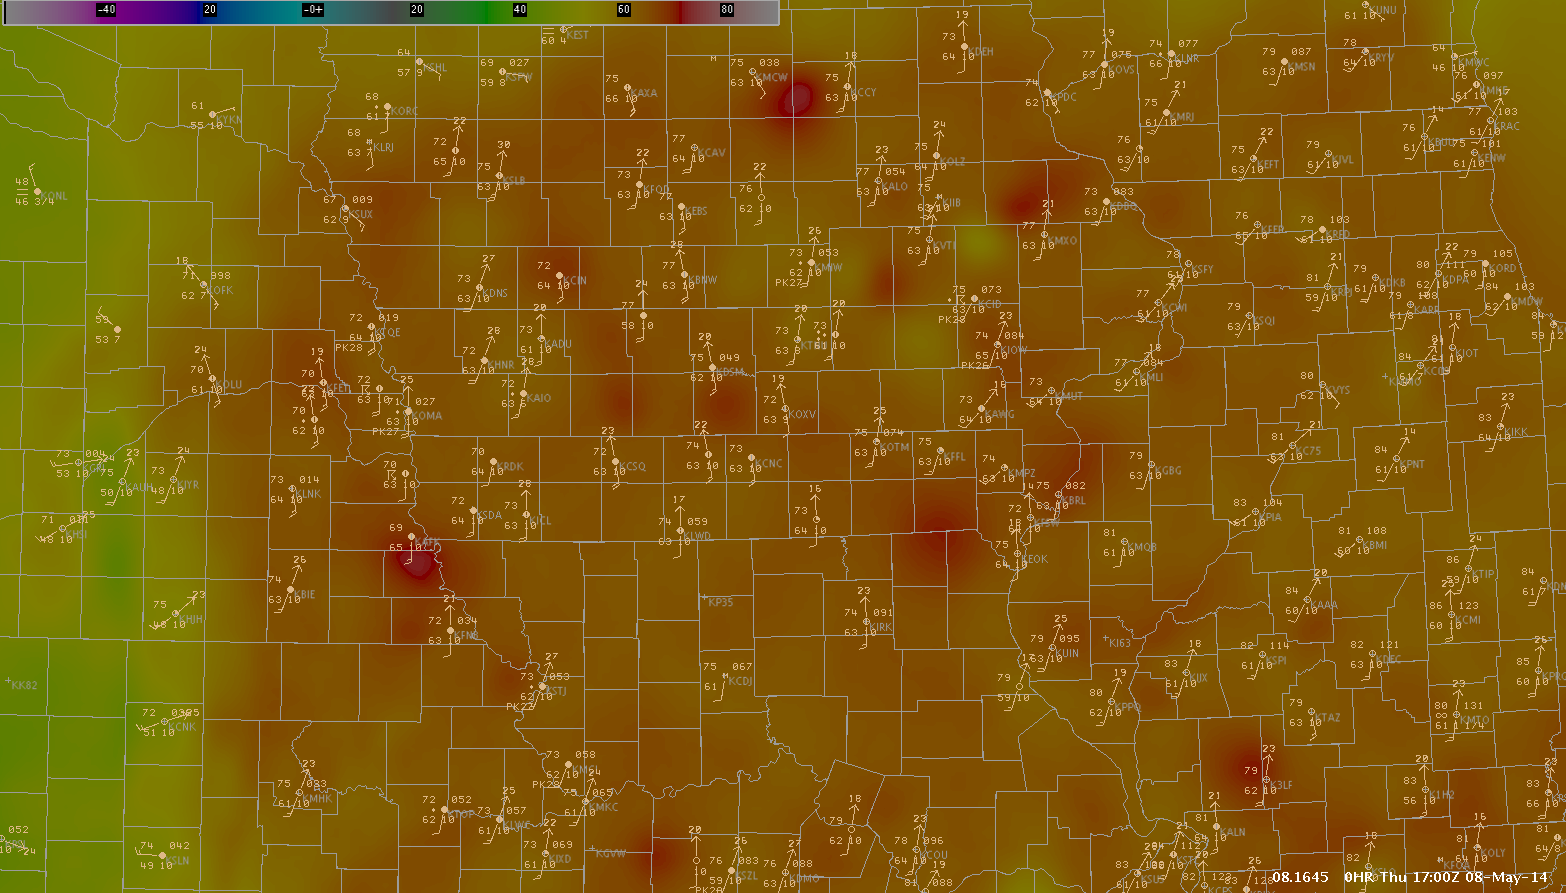
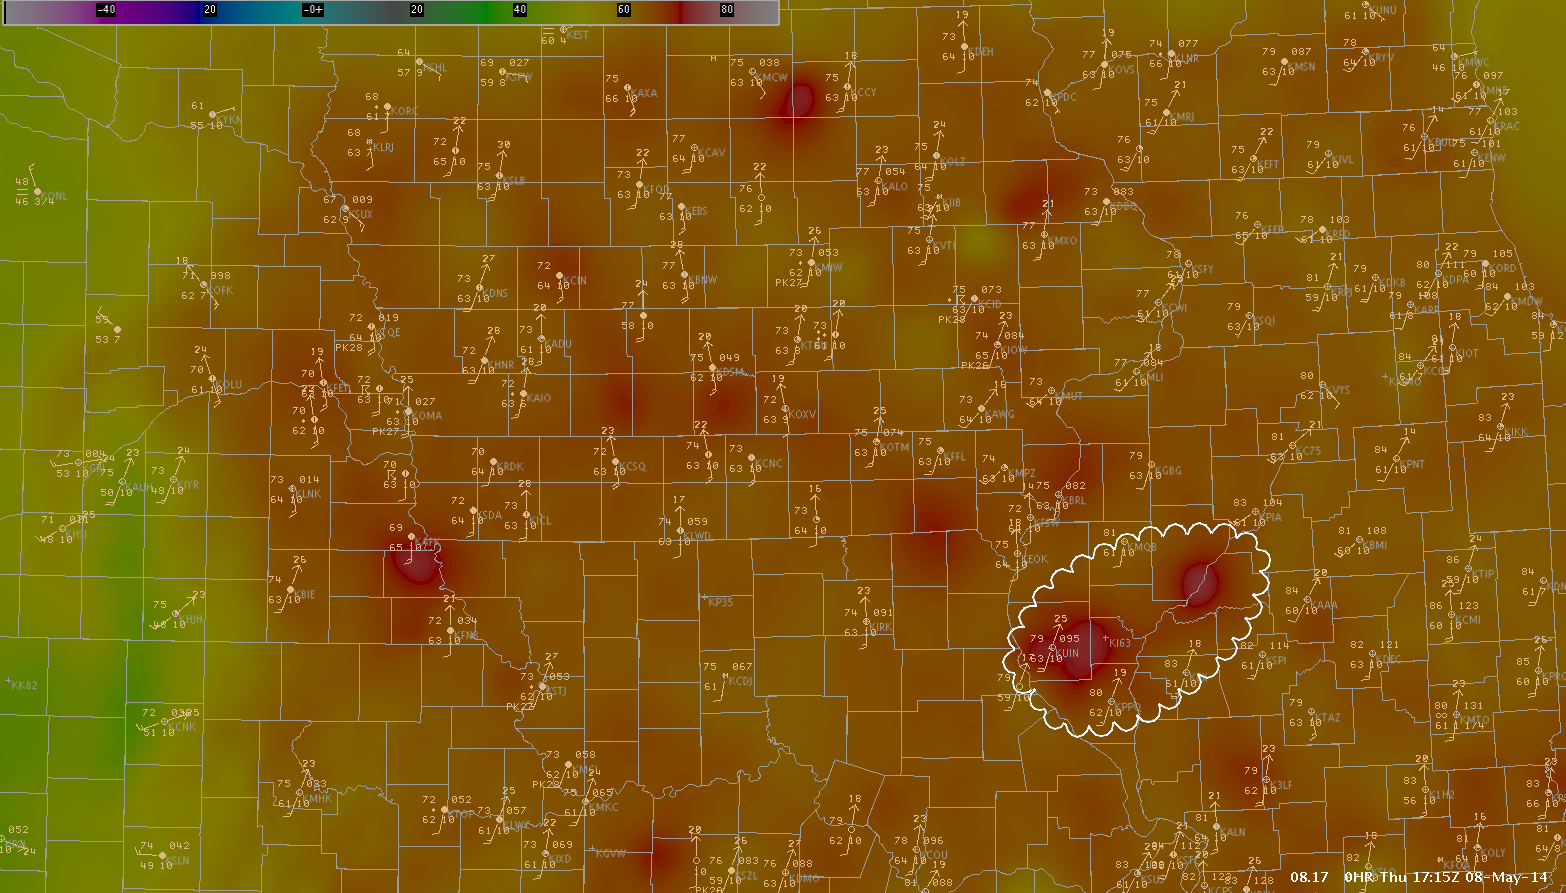
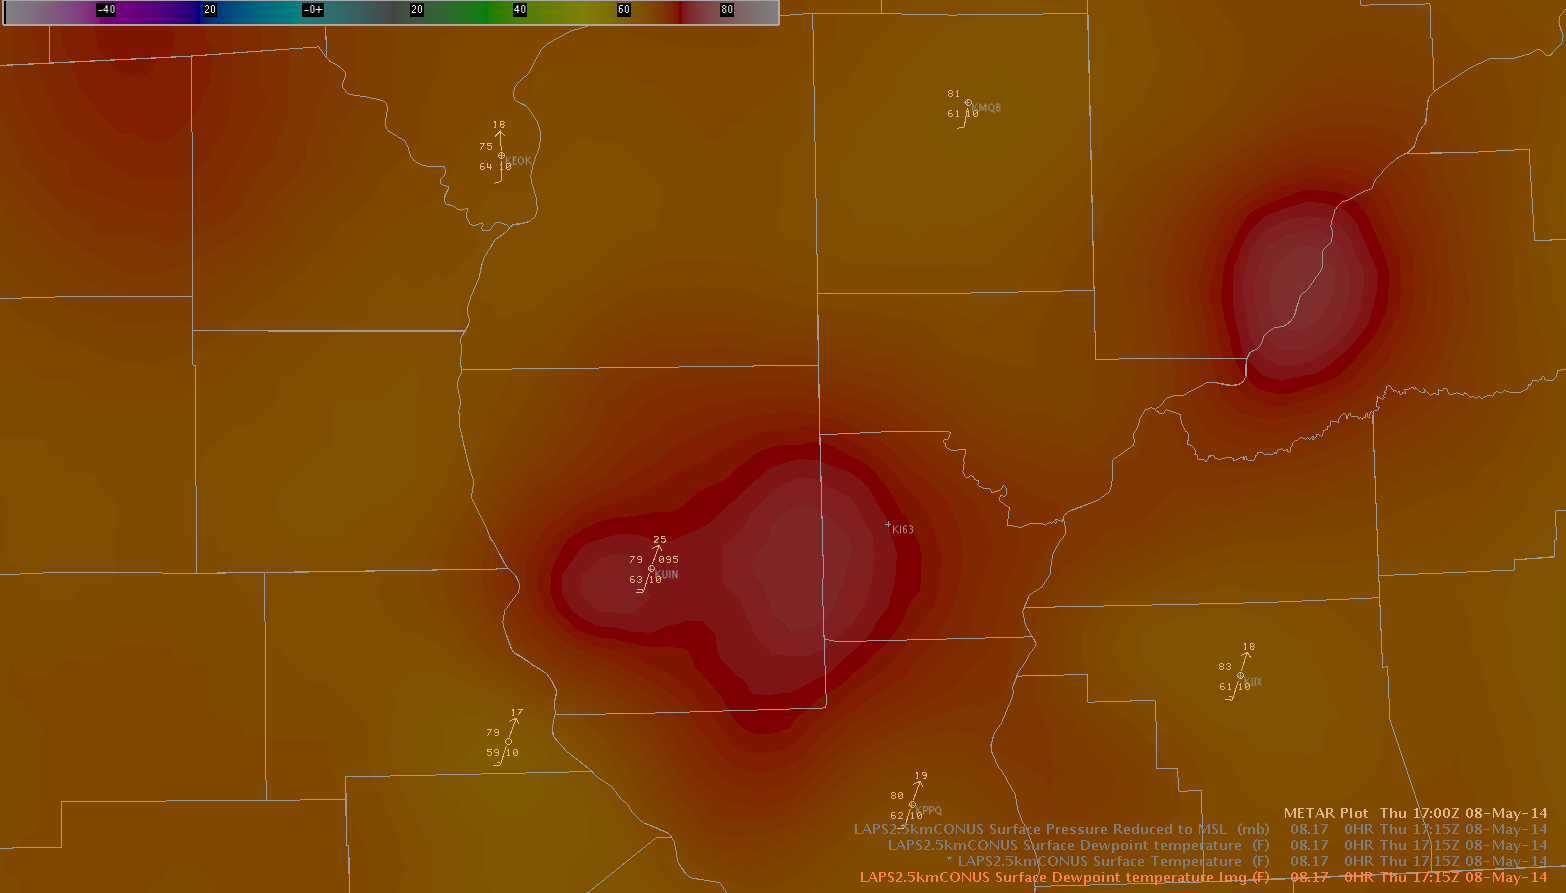
The images above are 2.5km LAPS taken at 1700z and 1715z, respectively. The third image is just zoomed in to the area of interest.
Station observations were overlayed onto LAPS model data to compare the model performance. A general bias of about 1-3 degrees existed in the LAPS data through the region. However, there were more notable departures in portions of Iowa and Illinois. The second image illustrates two of these locations in West Central Illinois, just east of Quincy and southeast of Macomb. In these areas, the model data departed from the station plots by about 8 degrees.
Jared Maples