LAPS again. Higher CAPE, bow echo. Lower CAPE, bye bye bow echo.

In my opinion, the LAPS surface-based CAPE product was one of the stars of the day.  Consistently, storms lived and died based on entering and exiting the tongue of higher CAPE values which extended north and northeast from the Big Bend area for most of the day.

This first image shows the LAPS surface-based CAPE at 00Z, and the radar at the same time.  Shouldn’t be hard to pick out the storm of interest.  Note that the storm is still in the tongue of 1000+ J/kg of CAPE as noted on LAPS.

LAPS_bowecho_before_051513_0000

One hour later, the storm is exiting and entering a less favorable instability regime.  And predictably, it starts to weaken.

LAPS_bowecho_after_051513_0100

Any questions?  LAPS nailed it.

CL

Tags: None

Example 4 Panel Display to Diagnose Hail Potential

After identifying rapidly cooling cloud tops off the CTC product (shown in a previous blog post), close attention was given to the storm that developed in Ward County and moved across Crane County and into Upton County. The decision to warn was based off the combination of a few products from MRMS…namely the rapid increase in number and value of pixels of the 60 dBZ echo above the -20C line…the breadth of the 50 dBZ echo above the 0C line…composite reflectivity…and the MESH product. An example 4panel image of these parameters is shown at 2048Z that was indicative of the values and appearance of the fields that prompted high confidence in issuing a severe thunderstorm warning for quarter sized hail. The increase in size and values of the 50 and 60 dBZ echo heights in particular were great in evaluating the storm growth and potential storm severity…especially when keeping the storm environment in mind. 14May13_MRMS

RJM

Tags: None

14May2013 0000Z San Angelo Nowcast

Currently monitoring strong to at times severe storms on the western boundary of the SJT CWA. Thermodynamic environment still appears supportive of marginally severe hail and occasional high wind gusts, based upon the continued movement of cells (generally NE) into a region of 800-1000 J/kg according to the Nearcast product. Do not expect sustained severe, considering the lack of a more organized / stronger wind field, but continued pulse severe events seem likely.

14may2013_3

Picca

Tags: None

GOES Sounder RGB product shows airmass changes/extent of convective development

When you want a visual depiction of what the airmass structure looks like, the GOES Sounder RGB product can fill the bill.  The image below is that product at 22Z, along with RAP13 500 mb winds to show the airmass movement.  You can clearly see the airmass difference along the Red River.  The bluer colors are more typical of midlatitude airmasses, while the greenish red area is associated with a subtropical airmass.   There is even a wind shift line in the RAP 500 mb winds, showing the airmass boundary. The convection over west Texas shows up clearly as the white areas.  These storms are feeding off the better instability and moisture provided from the south.

We think that the increasing midlevel flow provided by the advancing subtropical airmass will help to sustain the Texas convection and allow it to organize into an MCS structure over the next few hours.

CL

GOES_Sounder_RGB_051413_2200

Tags: None

GOESR CIRA/CIMSS Simulated IR/WV Verifies Well

The first image is a GOESR CIRA CIMSS Simulated IR image from sometime 15-18 UTC for 22 UTC on May 14, 2013, while the second image is the actual IR image
at 2201 UTC.  Overall, the simulated IR image did a great job capturing colder cloud tops from convection in west Texas as well as isolated convection over New Mexico.  In addition, warmer cloud tops across south Texas were handled well.  This product may be helpful for importing into GFE/IFPS for forecast updates as well as short range (3-6 hr) public and aviation forecasts.

The third image is the simulated water vapor image from 15-18 UTC for 22 UTC, while the fourth image is the actual water vapor image for 22 UTC.  The results were favorable with the simulated WV performing well with convection over west Texas. The ribbon of drier mid/upper level air from the Texas Panhandle to Oklahoma is reasonably well depicted though the simulated image was a bit too far south compared to the actual. The simulated image in New Mexico verified very well showing convection  mainly along the higher terrain across the central part of the state.

Tags: None

GOESR UAH Convection Initiation Across Far Western Texas

F

Focus on the two red areas above where convection initiation is above 90%.

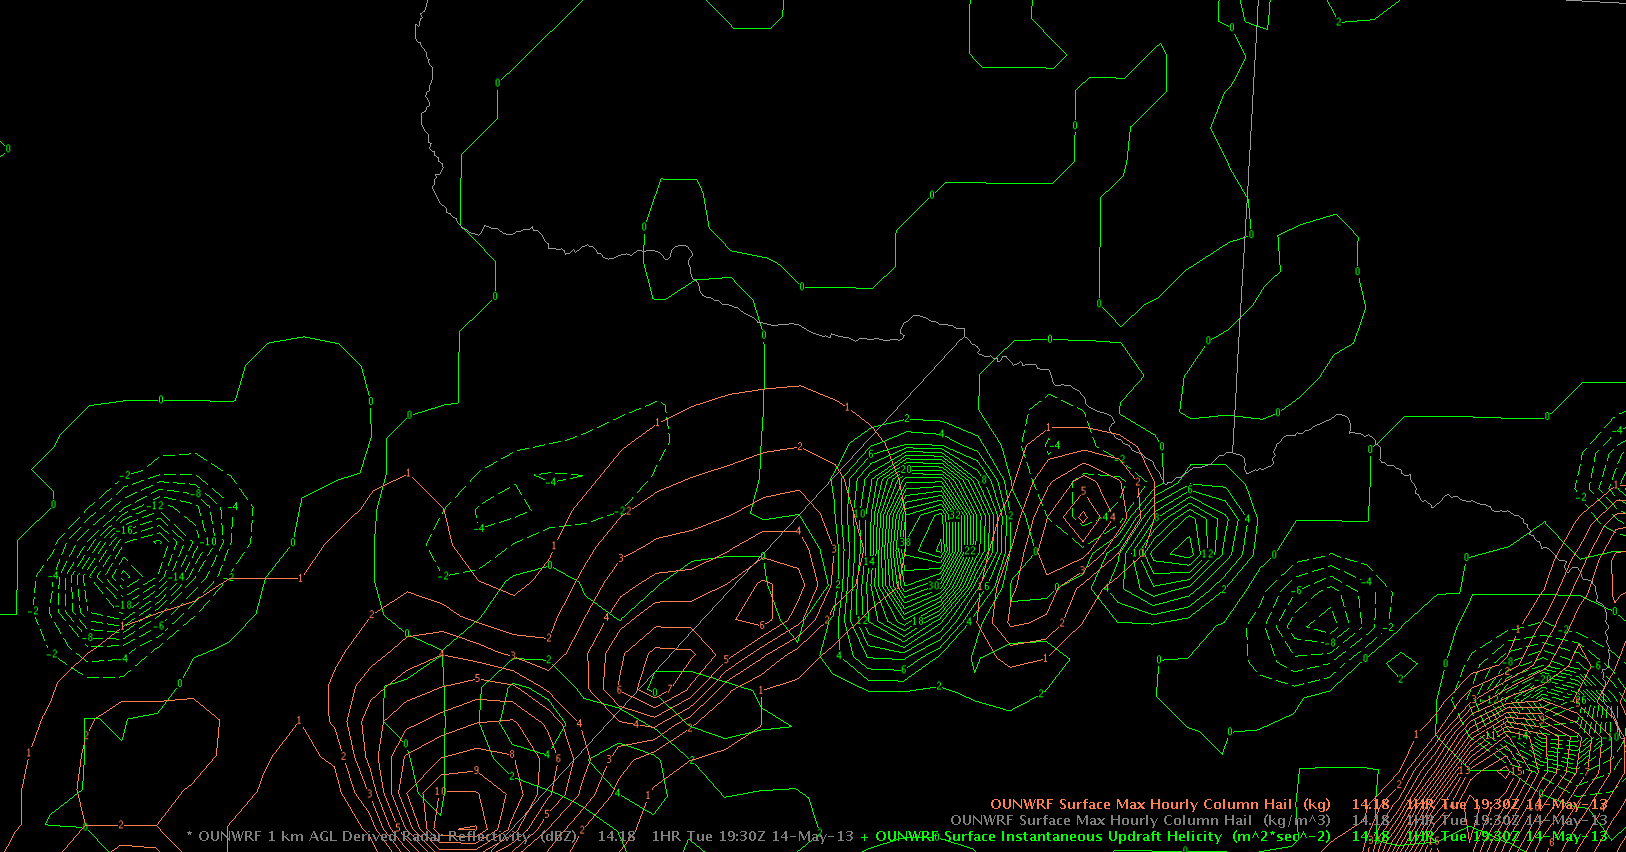
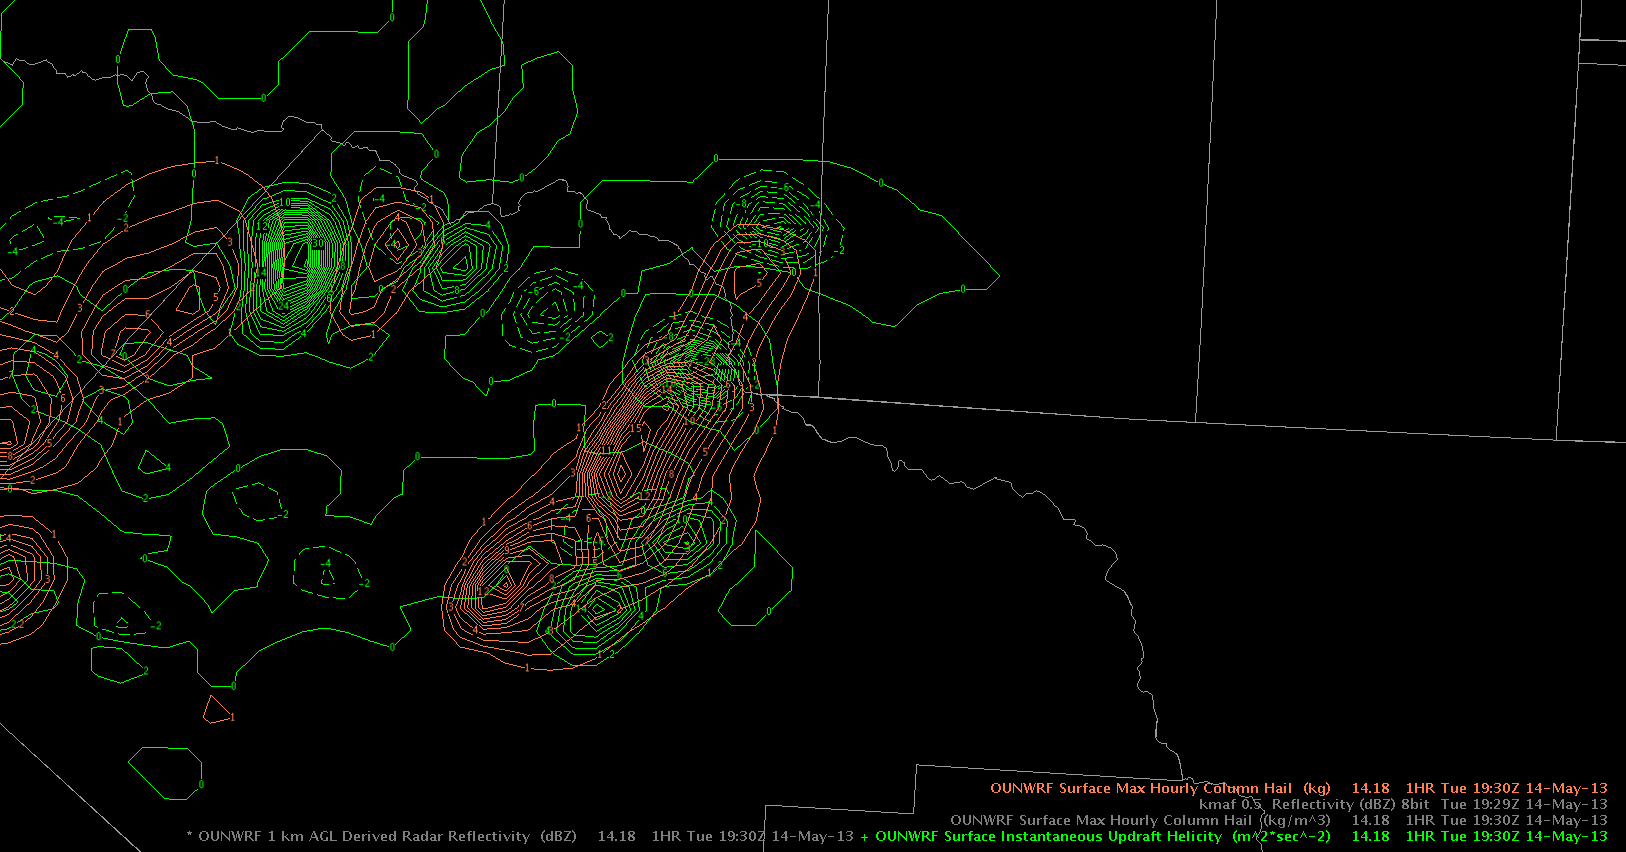
Both of the red areas, especially the southeast one, depicted an increase in 0.5 Degree reflectivity indicating developing convection.  This product seems to be doing a good job with new developing convection, though much of this convection would not sustain itself likely due to a weakly sheared environment.  I would like to see how this product responds to a more strongly sheared environment. Michael Scotten

Tags: None

LAPS analysis shows off its utility!

The storms over west Texas continue to build, and we expect some strengthening as they interact with a more favorable environment to the east over the next few hours.  Here are a couple of images that show the beginnings of this process, as well as the level of situational awareness that can be provided by the 3km LAPS analyses.  This first image shows the LAPS surface-based CAPE at 1930Z, along with the 0.5 base reflectivity at KSJT at the same time.  Note the strong cell 4 counties due west of the RDA.  This storm is moving towards the higher CAPE areas as noted by the bluer colors on the LAPS analysis.  What will happen when it reaches a better environment?

LAPS_radar_051413_1930

An hour later, we have the answer.  The image below shows that the storm has strengthened considerably after moving into the more unstable regime.  The warning forecaster watching this storm issued a test warning about 15-20 minutes after this image, with MESH values of 1.5 inches being seen.  LAPS definitely helped to explain how this storm was able to build into our first warnable storm of the day!

CL

LAPS_radar_051413_2030

Tags: None

OUNWRF and storms in W-Texas

Referring to the reflectivity/MESH post a few minutes ago, OUN WRF showed some signals of an increase in the severe risk just as storms achieved 60 + dBz cores. Attached below one can see an overlap of instantaneous updraft helicity (green) and surface max hourly column hail (brown). For most of the period until now, both parameters were persistently separated, which is shown below in the first image. Those storms had a pulsating character with relatively weak cores.

ounwrf_helicit_updraft_1930Z_1

It was interesting to see that betimes, OUNWRF produced stronger signals with a a better overlap of both parameters. Eventually storms began to intensify just in this area, finally producing our strong thunderstorms. OUNWRF gave some lead timing and increased confidence to the forecaster that an increase of thunderstorm’s strength could be expected.

ounwrf_helicit_updraft_1930Z_2

Helge

Tags: None