

As mentioned a bit earlier in a post, the NearCast product showed enhanced chances for convection all the way to the Lubbock area. Especially the theta-e difference product placed the tongue of mid-level unstable air just where high based thunderstorms finally evolved. Surface dewpoints in the mid 30s and temperatures in the low 90s point to elevated and high based thunderstorms with a distinct downburst/ heatburst? risk. The product helped a lot to focus on the anticipated area of initiation. GOES-R LAP products also did a great job in developing the elevated thunderstorm activity both in space and time. Helge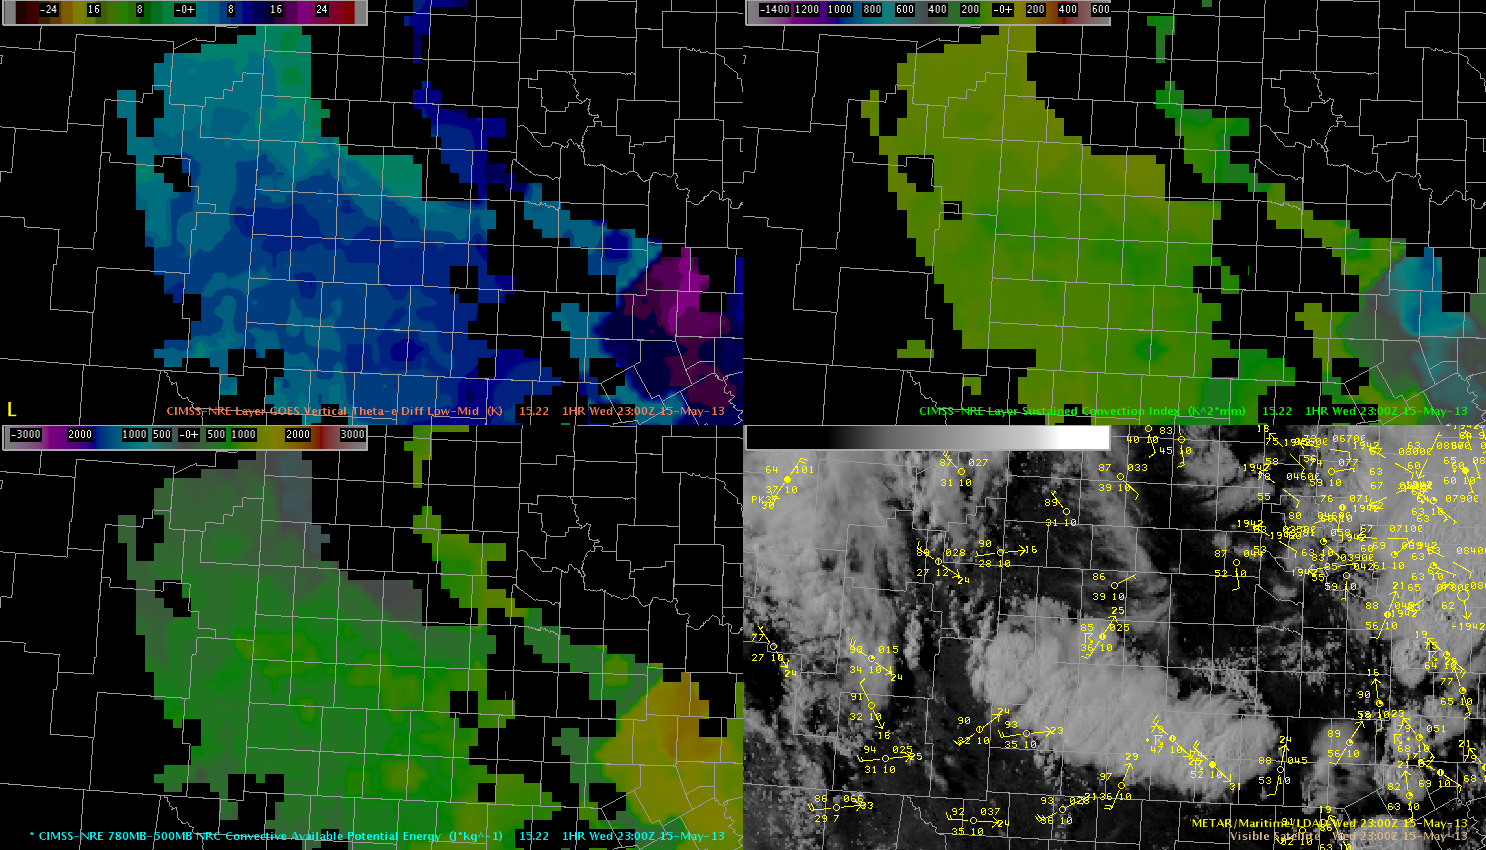 Upper left: vertical theta-e diff., upper right: Sustained convection index, lower left: CAPE and VIS in the lower right.
Month: May 2013
TX Isolated Storm Development East of Dryline in Max Vertical Theta-E Difference
 Isolated thunderstorms have developed in the Vertical Theta-E Difference Low-Mid maximum, east of the dryline, across the north half of Texas, just west of I-35 around 23 UT.C This product may be a better indicator of moist convection east of the dryline then the dryline itself.
CI and CTC products offering some lead time in realtime initiation
I was monitoring storms in Clay/Montague counties and potential CI further to the S/SW. Broad field of Cu was seen further south but it was hard to distinguish which of those Cu fields would finally grow into a thunderstorm.
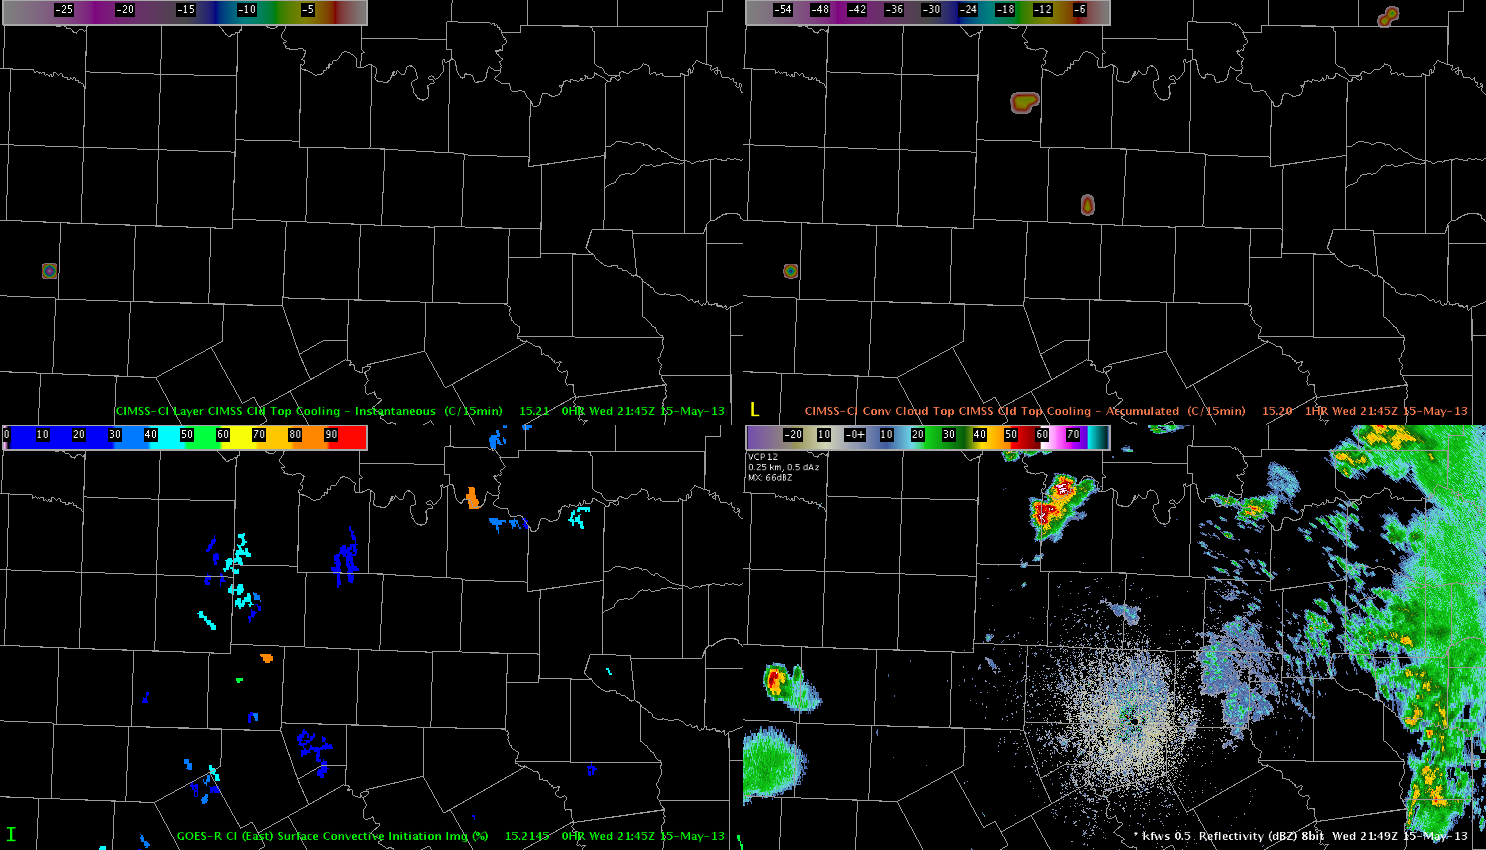 Upper left: Cld top cooling product, upper right: CTC accumulated, lower left convective initiation and lower right: reflectivity
Please have a look at Palo Pinto county, where the CTC product had a 80-90% signal strength of showing initiation potential (the lower orange dot). At the same time in the reflectivity fields only a few weak signals were seen.
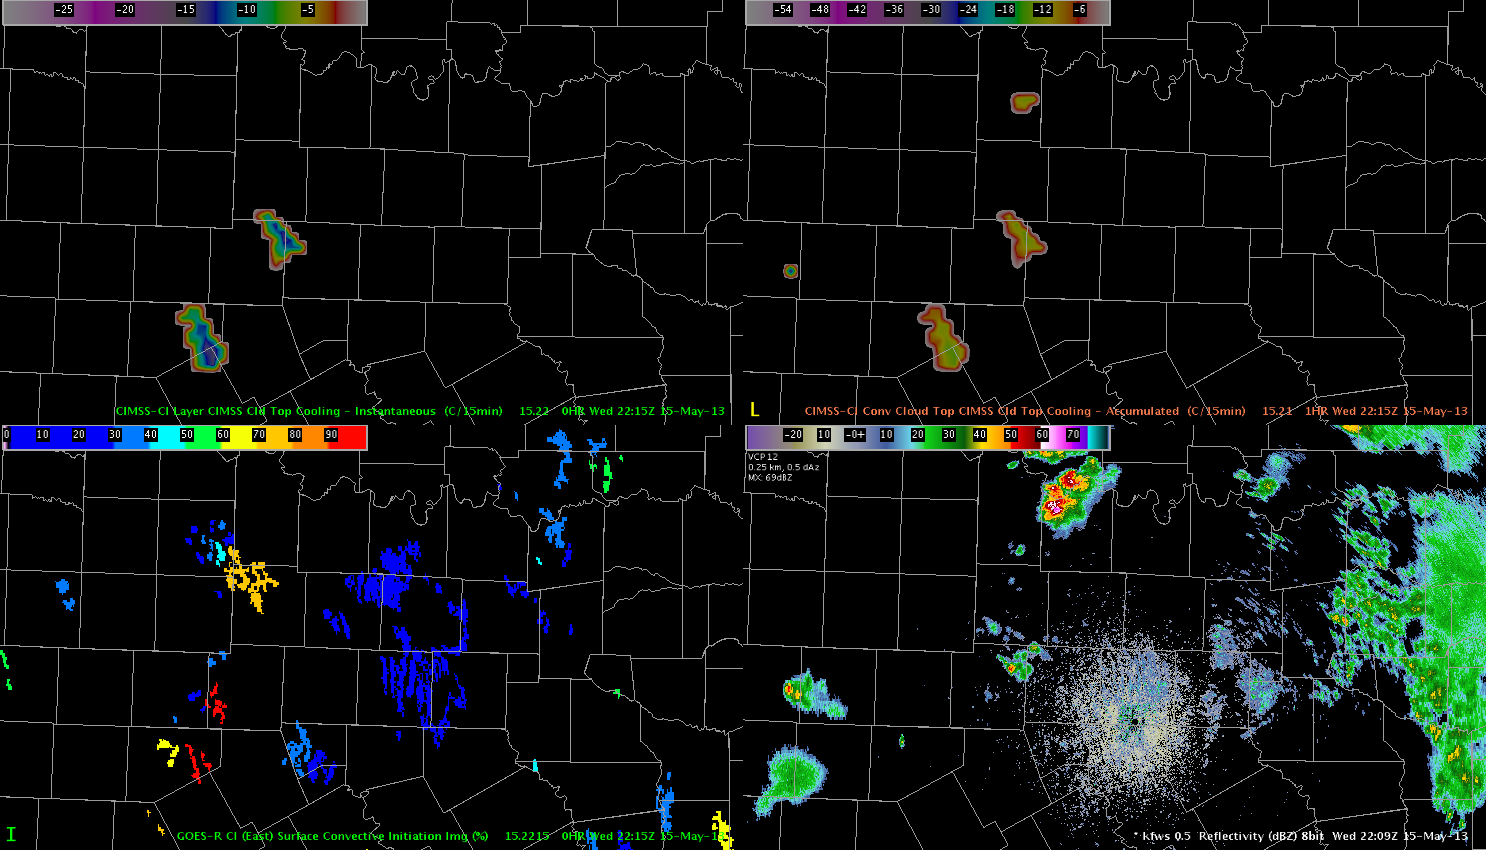 About 30 min later, the CTC instantaneous product showed a modest signal of -15K/15 min over the NE part of that county with reflectivity appraoching 40 dBz at the same time and place.
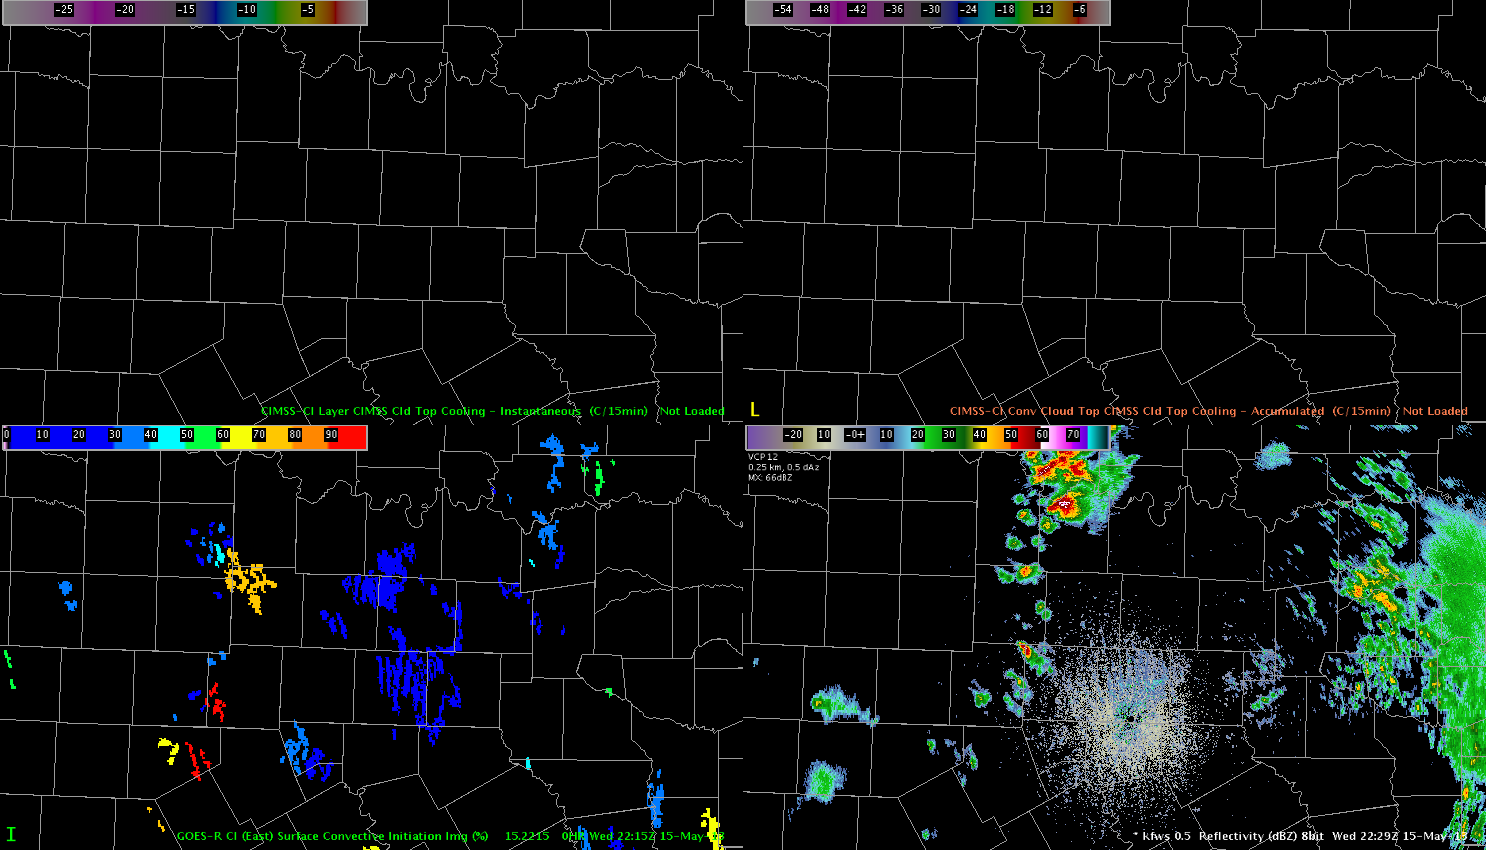 Finally at 2230 Z reflectivity revealed a small core with 60 dBz. The first lightning strike occurred at 2237Z. Those products gave the forecaster a good indication which area would finally see the highest probabilities for thunderstorm development and there was abundant lead time left before that storm finally took off. Helge
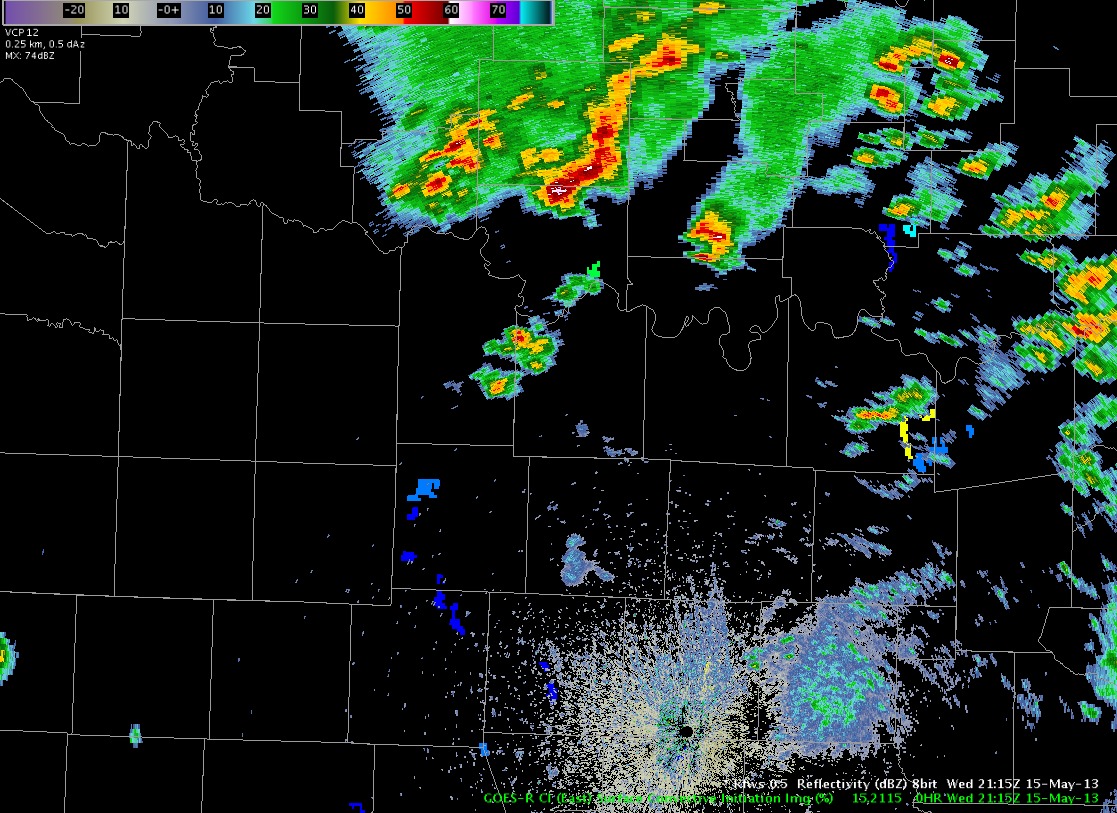
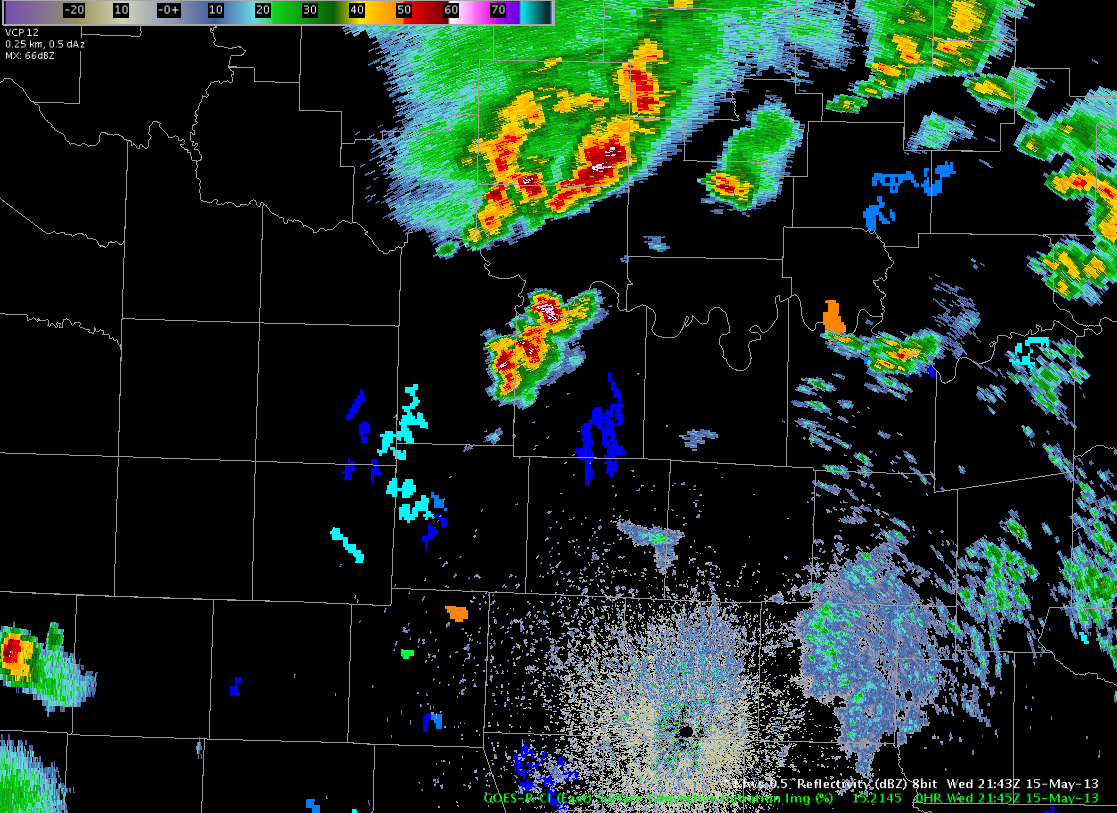
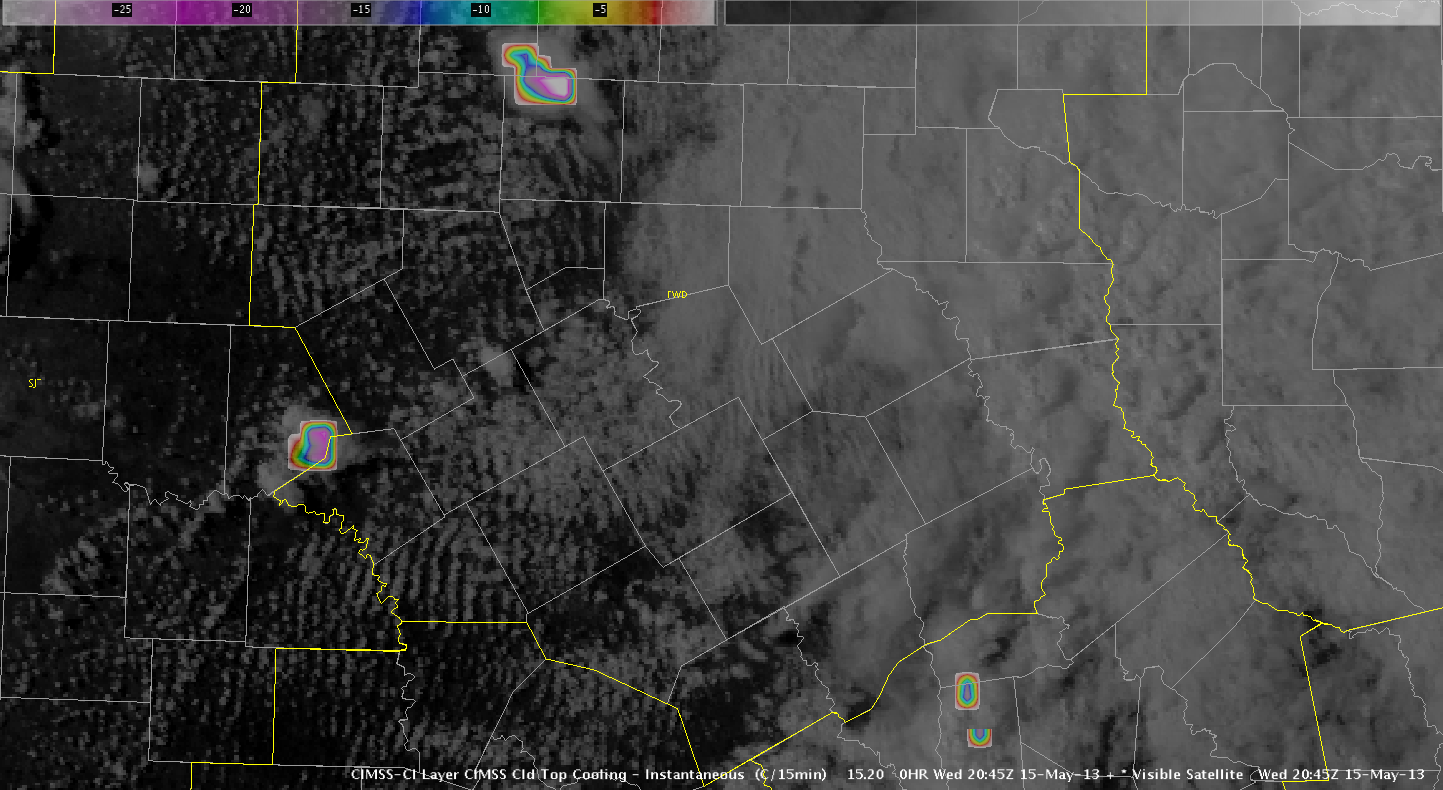
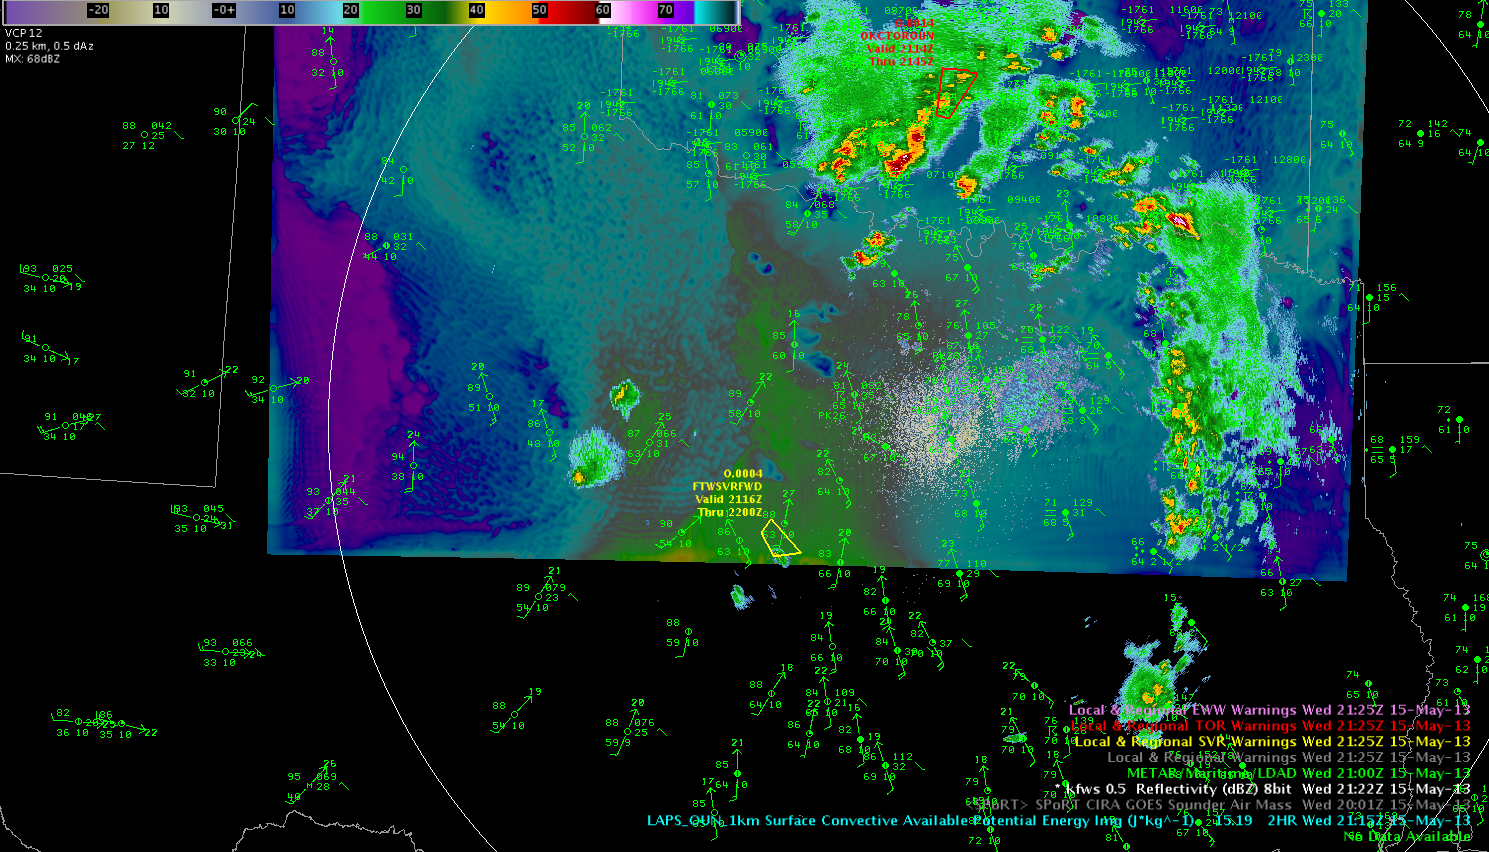
GOES CI Confirms Severe Thunderstorm Initiation Near Red River
 The GOES CI product detected a 60% yellow area at 2045 UTC. By 2115 UTC, a thunderstorm had developed in this yellow area. This storm strengthened and prompted the issuance of a Severe Thunderstorm Warning by 2205 UTC. Baseball hail was reported by this storm at 2212 UTC, and a tornado was observed around 2242 UTC. The CI product gave about 20-30 minute lead time for storm development, 75-90 minute for severe weather, and nearly 120 minutes of lead time for the weak tornado.
Michael Scotten.
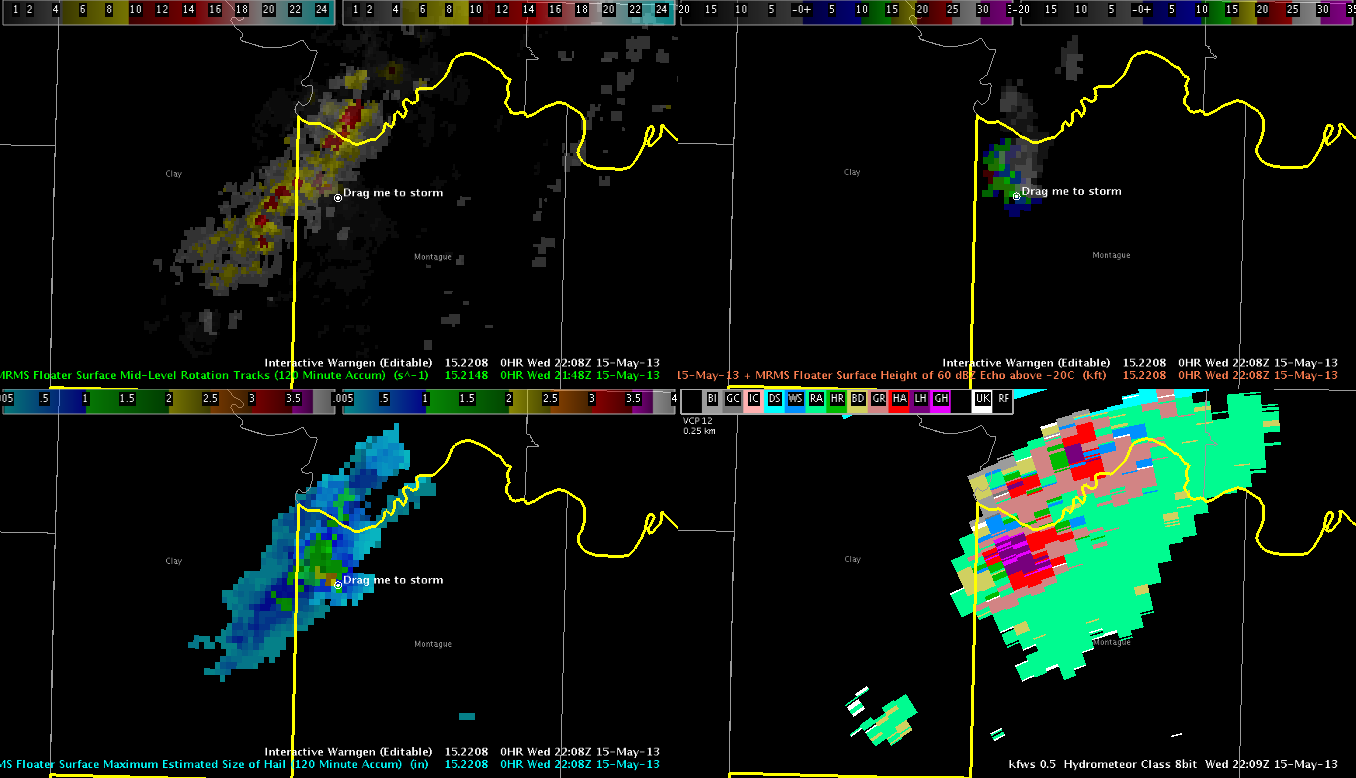
Severe at 2205Z in Montague County…what does baseball sized hail look like on MRMS?
Got a tall and strong storm in Montague County in the northwest corner of the FWD CWA. It built up very quickly, and we almost were too slow with the warning. Below is a four panel of various MRMS fields: upper left=mid level rotation tracks, upper right=height of 60 dBZ echo above -20C level, lower left=MESH, lower right=hydrometeor class with HSDA. Note the orange MESH pixels, showing 2.5″+ hail, as well as the area of large/giant hail on the HSDA product. The warning went out at 2205Z, and we got the first reports of golfball/baseball sized hail at 2208Z. Just in time!
CL
18Z LAPS vs Reality
The 18Z LAPS 4-hour forecast of sfc layer maximum reflectivity showed the development of a large, supercellular storm near the Gray / Montague border.
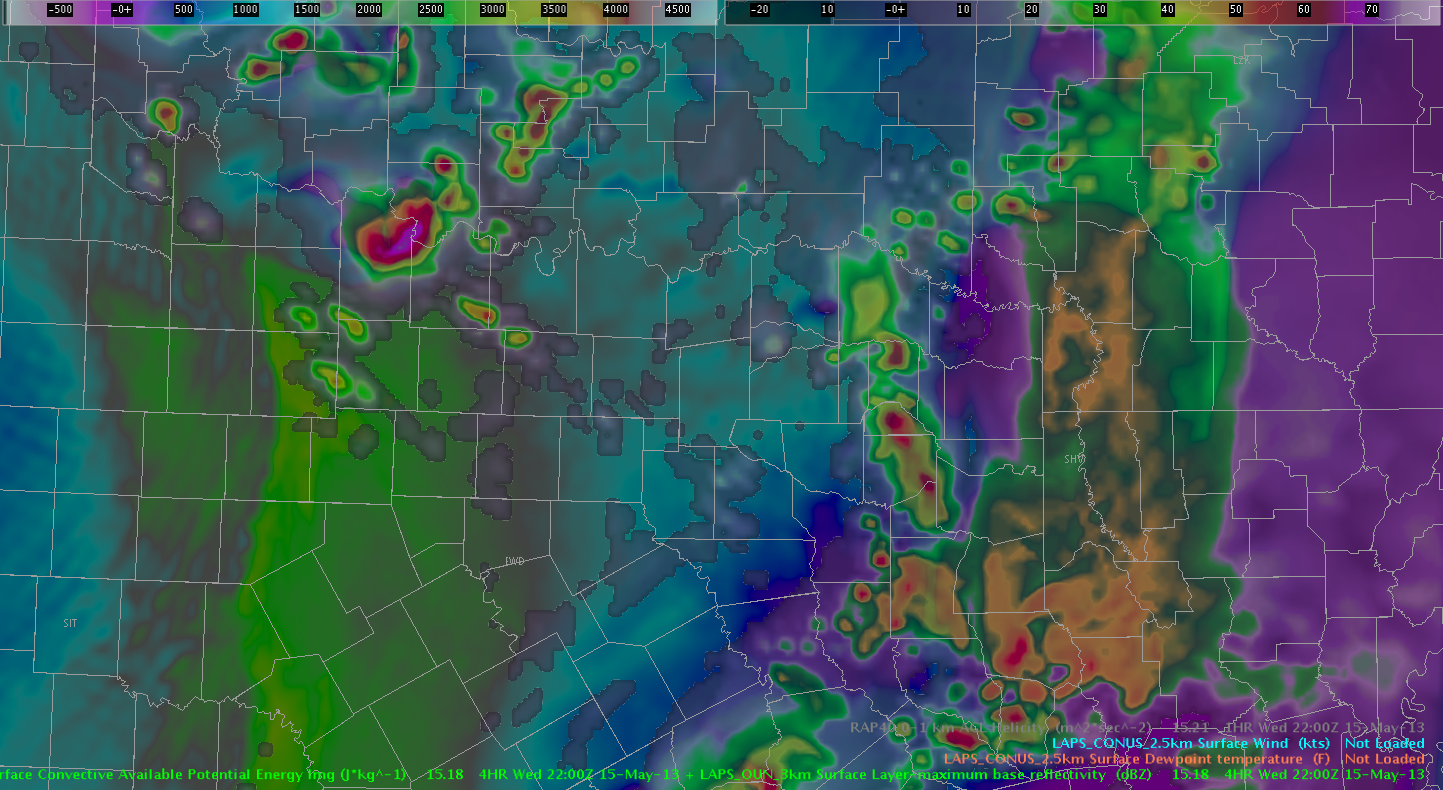
Here is the actual reflectivity image from 2204Z.
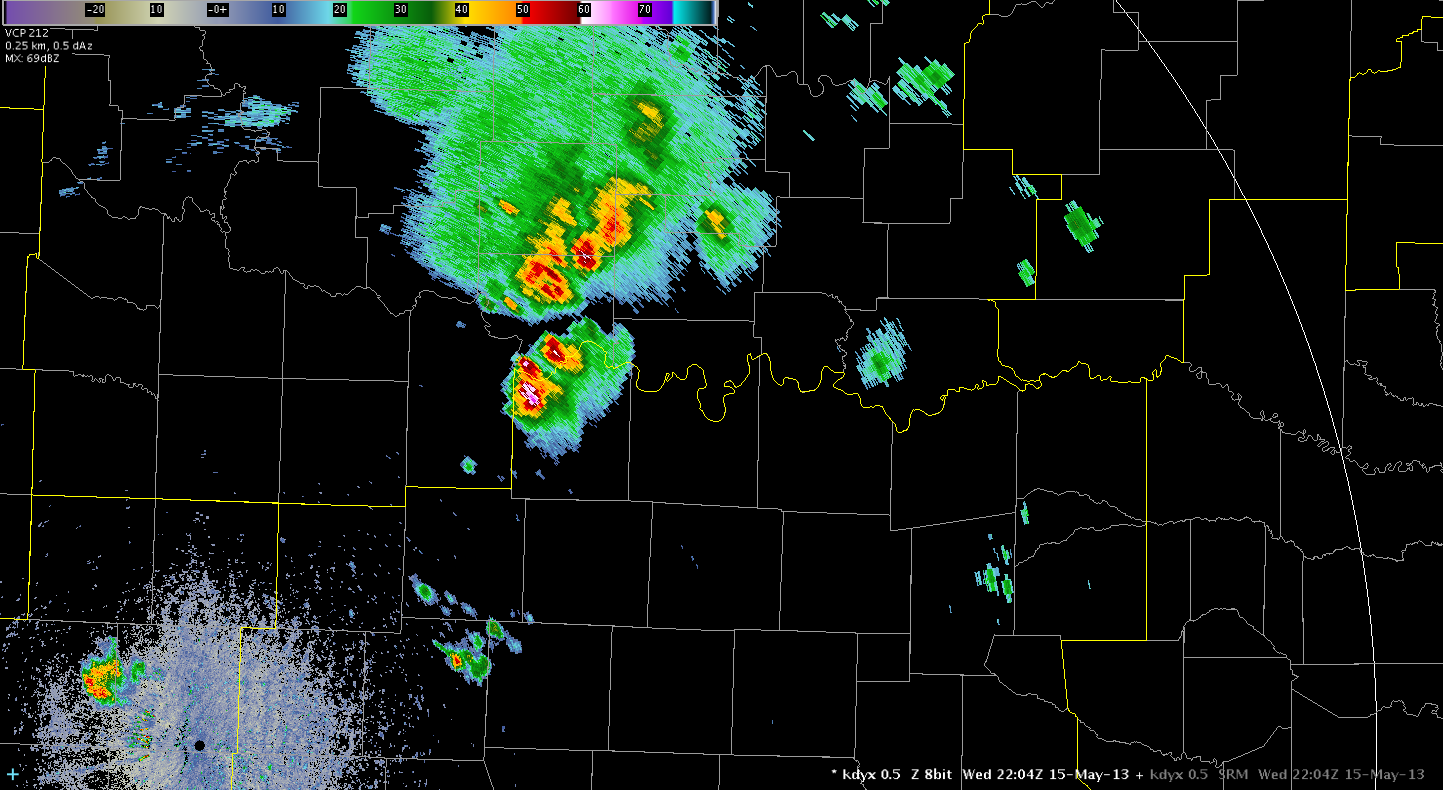
Golfball- to baseball-sized hail has been reported with this storm.
Picca
CIRA NSSL WRF Simulated IR Underestimates Cloud Cover Over Oklahoma

 The top image is CIRA/NSSL WRF Simulated IR while the bottom image is observed IR around 22 UTC. The simulated IR underestimated cloud cover over Oklahoma where a mid/upper low was centered. The convection over the Rockies in Colorado and New Mexico as well as cooler cloud tops over eastern Texas and Louisiana were handled well by the simulated IR. The convection near Lubbock, Texas was captured very well.
was handled very well by the simulated IR. The band of
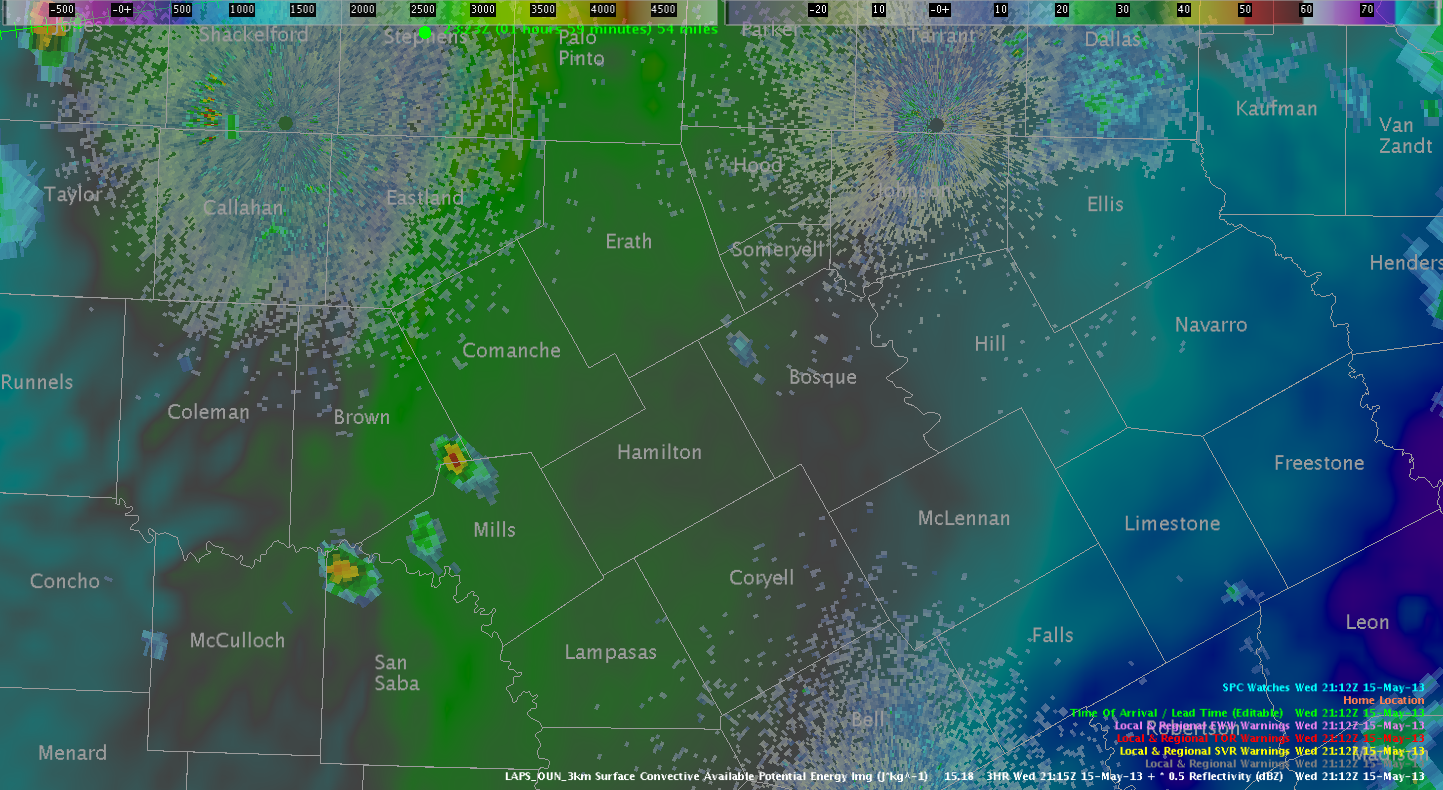
2116Z Comanche County SVR
Based upon CTC rates around -20 to -25 C and initiation within a LAPS-analyzed region of approx. 2500 J/kg of CAPE, we warned on a cell that was developing around the Brown/Comanche/Mills intersection, expecting that strong cooling rates within an axis of (model-represented) good instability would at least result in a hail threat. However, the cell quickly weakened as it moved into the FWD CWA. Based upon recent sounding from MPEX in Seymour, TX, current atmospheric column across central TX may be too dry, resulting in growing updrafts entraining too much dry air and dissipating from negative buoyancy.
CTC Rate (SW portion of CWA)
LAPS-analyzed Instability
LAPS on the right way regarding dryline organization and decaying storms
I was wondering why LAPS constantly showed weakening trends with discrete storms entering a north-south aligned CAPE tongue just west of KABI. Rapid strengthening occurred just after initiation:
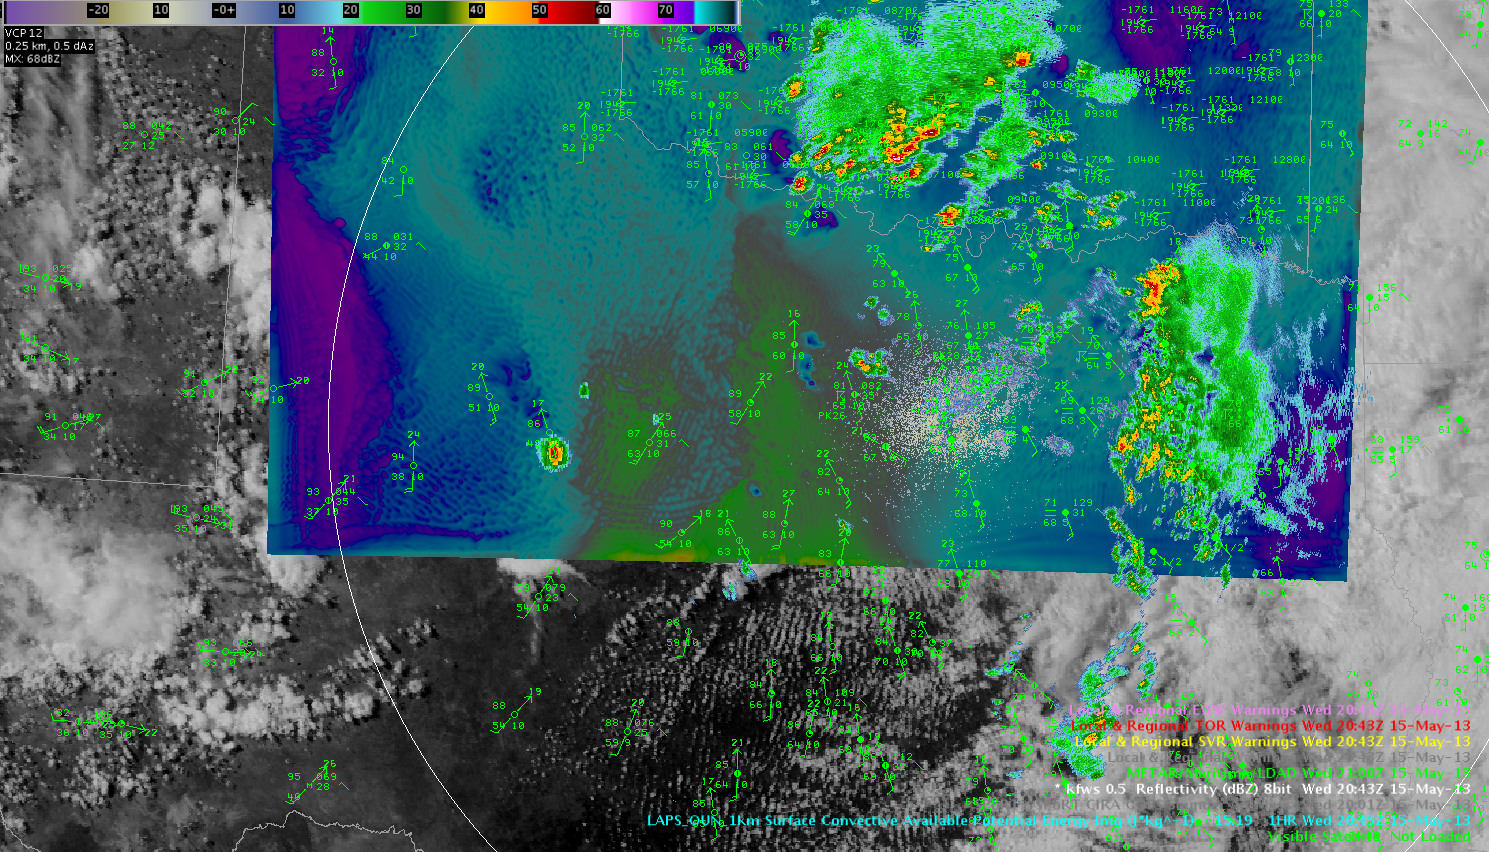 LAPS 1km overlaid with reflectivity/VIS.
CAPE (LAPS) peaked in excess of 2000 J/kg in the area where storms were expected to move in. However, as seen below, storms gradually weakened during the following scans and so did the CAPE plume in LAPS:
 The guess is that there was some strengthening of the dryline with enhanced postfrontal mixing occurring (personal talk). Also, there might be an evolving dryline bulge to the southwest of Dallas. Accompanied broadening area of backing winds is now present to the east/northeast of the decaying storms and the focus for initiation of most intense storms in the next few hours remains next to the Dallas/Fort Worth area (as constantly seen in OUN WRF/LAPS). 2145Z features 15-20 kt SE-early surface winds in this area with rapid thunderstorm growth. Helge
Flash Extent Density Comparison with MRMS Data Near Ratliff City, OK on 15May2013
A lightning jump of 18 Flash/Min to 40 Flash/Min between 1908 and 1909Z with a second jump to 51 Flash/Min at 1912Z preceded a rapid increase in vertically integrated ice, MESH, and reflectivity at the -10C isotherm. A 1″ hail report was then acquired at 1926Z in Ratliff City.
The following plot shows the flash extent density trace for the storm approaching Ratliff City, OK. Focus on the timeframe between roughly 1900Z and 1930Z. Notice the strong jump between 1908Z and 1909Z.
 MESH jumped from 0.63in (1910Z) to 1.10in (1912Z) to 1.26in (1914Z) with the last detection of 1.02in (1924Z) before dropping off thereafter. The following images show the jump from 1910Z to 1912Z.


Looking at the vertically integrated ice product…there was an increase in values from 14 kg/m2 (1908Z) to 20 kg/m2 (1910Z) to 32 kg/m2 (1912Z) with consistently high values above 30 kg/m2 through 1924Z. See the images below as the storm approached Ratliff City.
Regarding reflectivity at the -10C isotherm…there was an increase to 59dBZ by 1912Z then 61dBZ at 1914Z (not shown).
Again, the 1″ hail report was acquired in Ratliff City at 1926Z which gives the lightning flash extent density tool a 17min lead time to the 1″ hail report.
RJM