Looking at the 18Z run of the 3km LAPS…the model has a ribbon of north-south oriented CAPE further west into eastern Colorado than the Nearcast model and is much skinner. 
Much lower values of CAPE are forecast in far eastern Colorado into western Kansas…and as a result…the storms that fire along the sfc convergence boundary in eastern CO develop quick but quickly die as they move off into the lower CAPE fields along the CO/KS border. This is more or less opposite the Nearcast model.
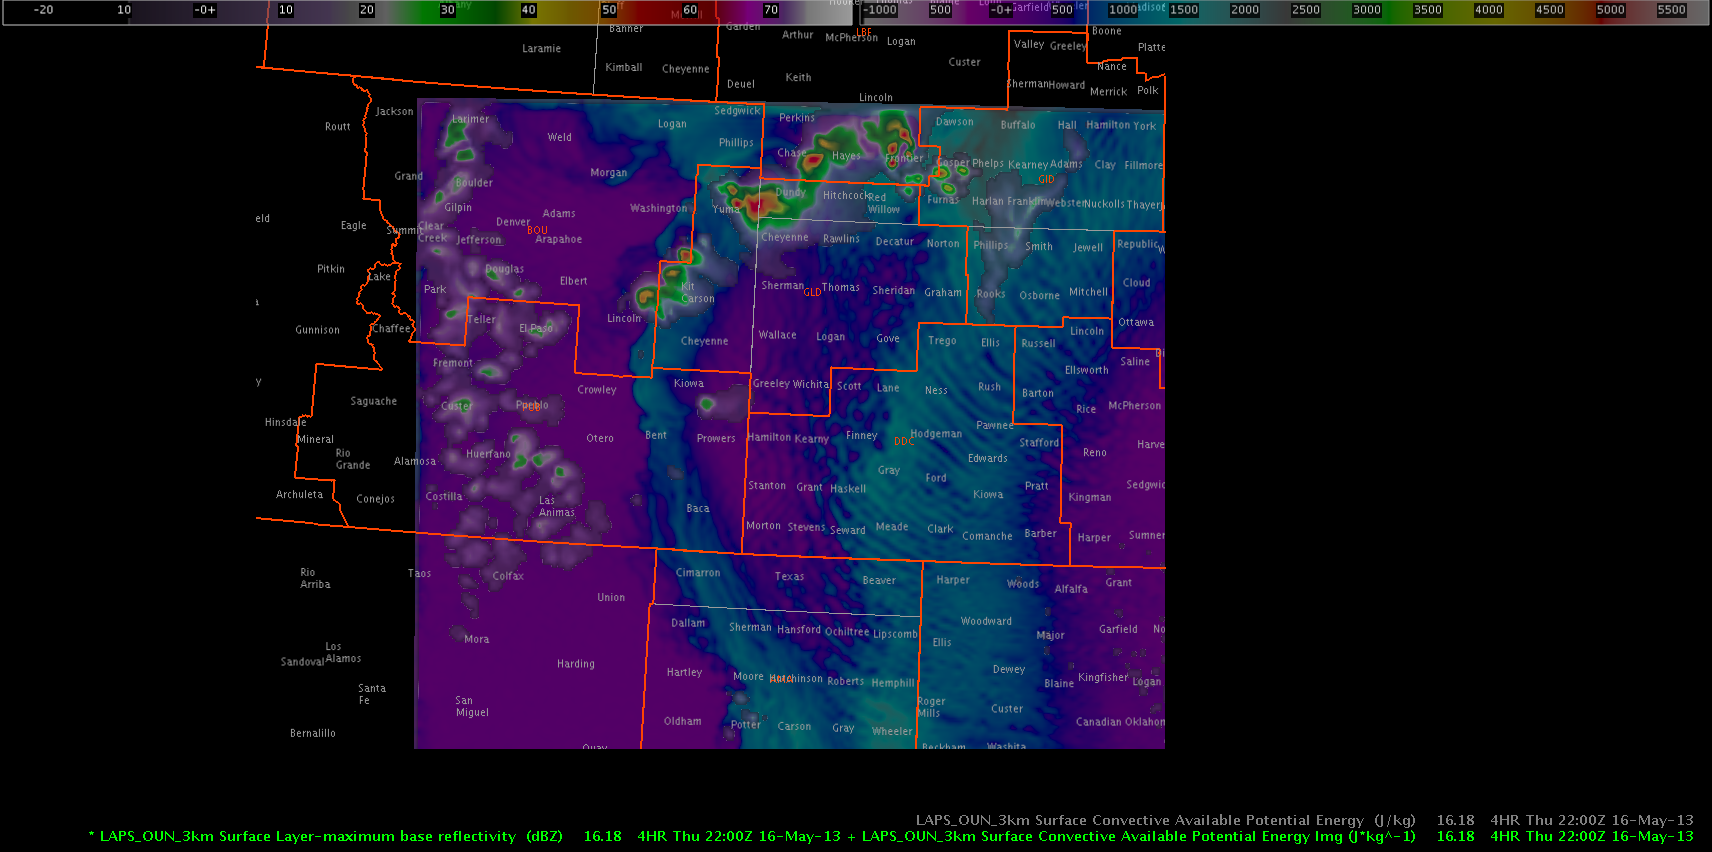
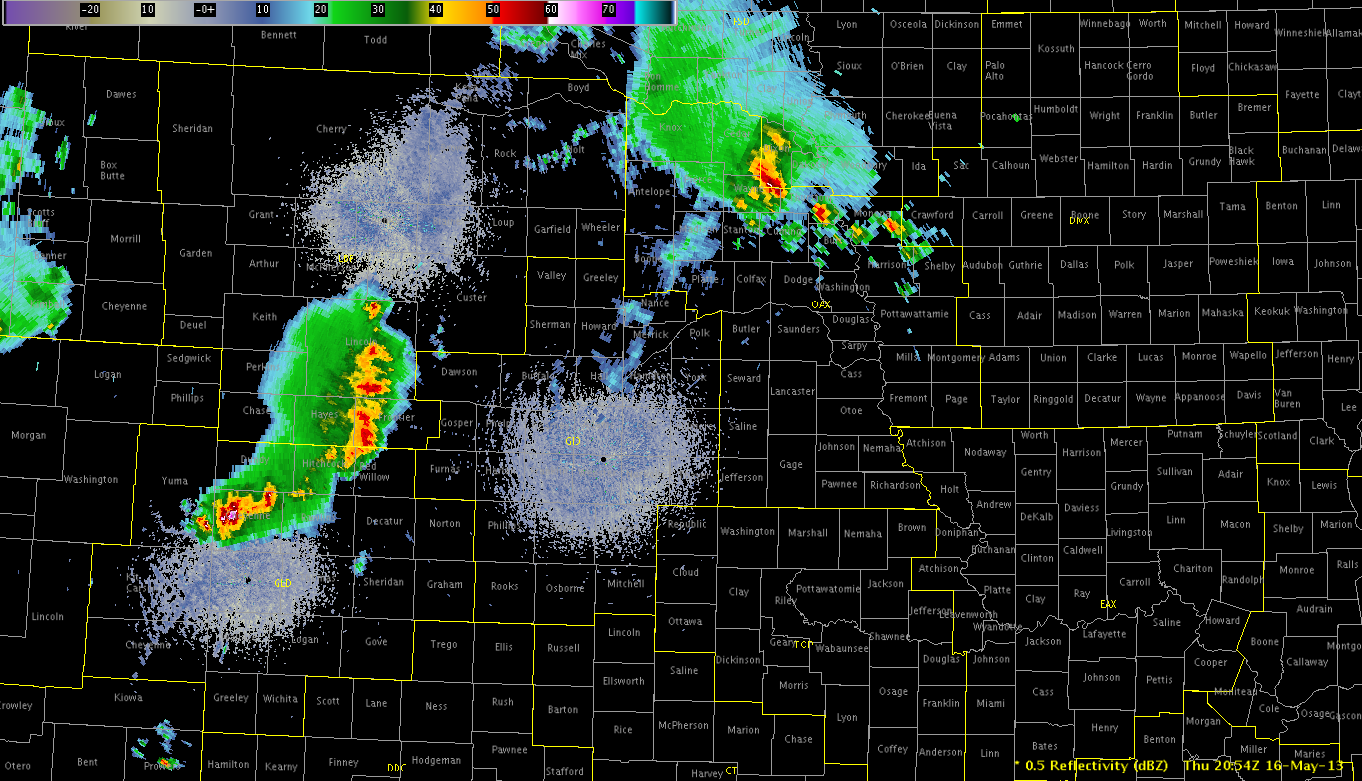
In a similar fashion…updraft helicity is relativly weak throughout the region although the storm in eastern Yuma county has more persistent helicity field maximized at 58 m2/s2 at 22Z.  Composite radar verification at 22z indicates the 18Z LAPS run is slow to move the strongest convection in northwest Kansas to the southeast and is significantly further west with the storms than reality in southeast Colorado. In addition…the LAPS convection is weaker than reality.
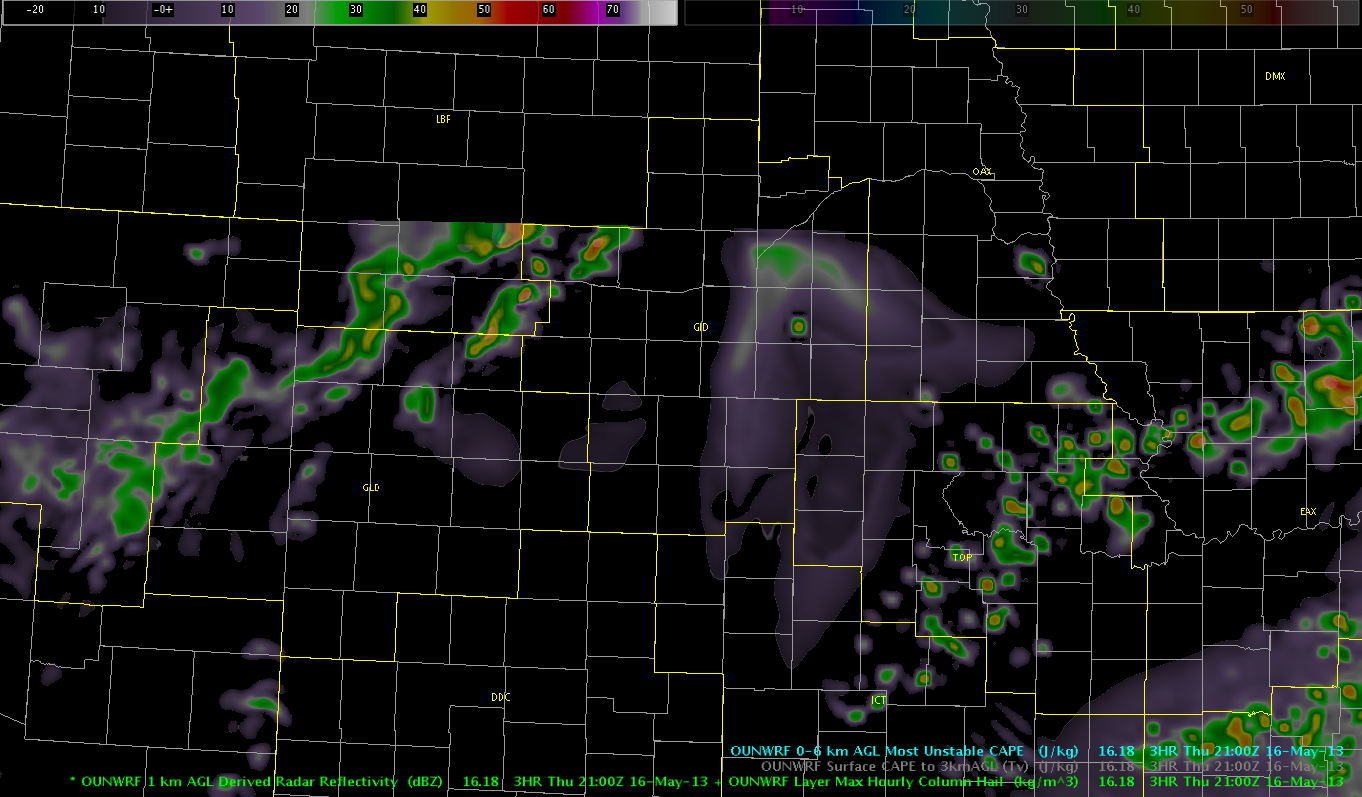
Looking at the 21Z run…the CAPE ribbon is a bit further east than the previous run and the model is capturing the return flow of higher instability as moisture is advecting in from the southeast. However…the slower advection of moisture as seen on the surface obs makes me think the LAPS is a bit aggressive with this moisture return. The reflectivity fields both along the line in northwest Kansas and the weak cluster in southeast Colorado are better analyzed initially although are a bit weaker than reality at 23Z. The 21Z run does however show the cold pool associated with the squall line really well as it traverses southeast across GLD CWA. It also has very good definition of the individual cell’s cold pool boudaries as well.
*see image /bmazur/23ZLAPSanalysis.png
*see image /bmazur/23zcomp.png
I would like to attach an image of the 3km instantaneous updraft helicity as well but am not able to load the data at this time.
An interesting feature showed up at the 2115Z timestep of the 21Z run. A donut of nearly 5000 J/kg of CAPE showed up surrounding a weak isolated cell in Prowers county. This area of high CAPE was then dispersed with time along the CAPE ribbon. Not sure what would cause this in the model but found it to be an interesting feature.
*see image /bmazur/capebomb.png
RJM

 LAPS
LAPS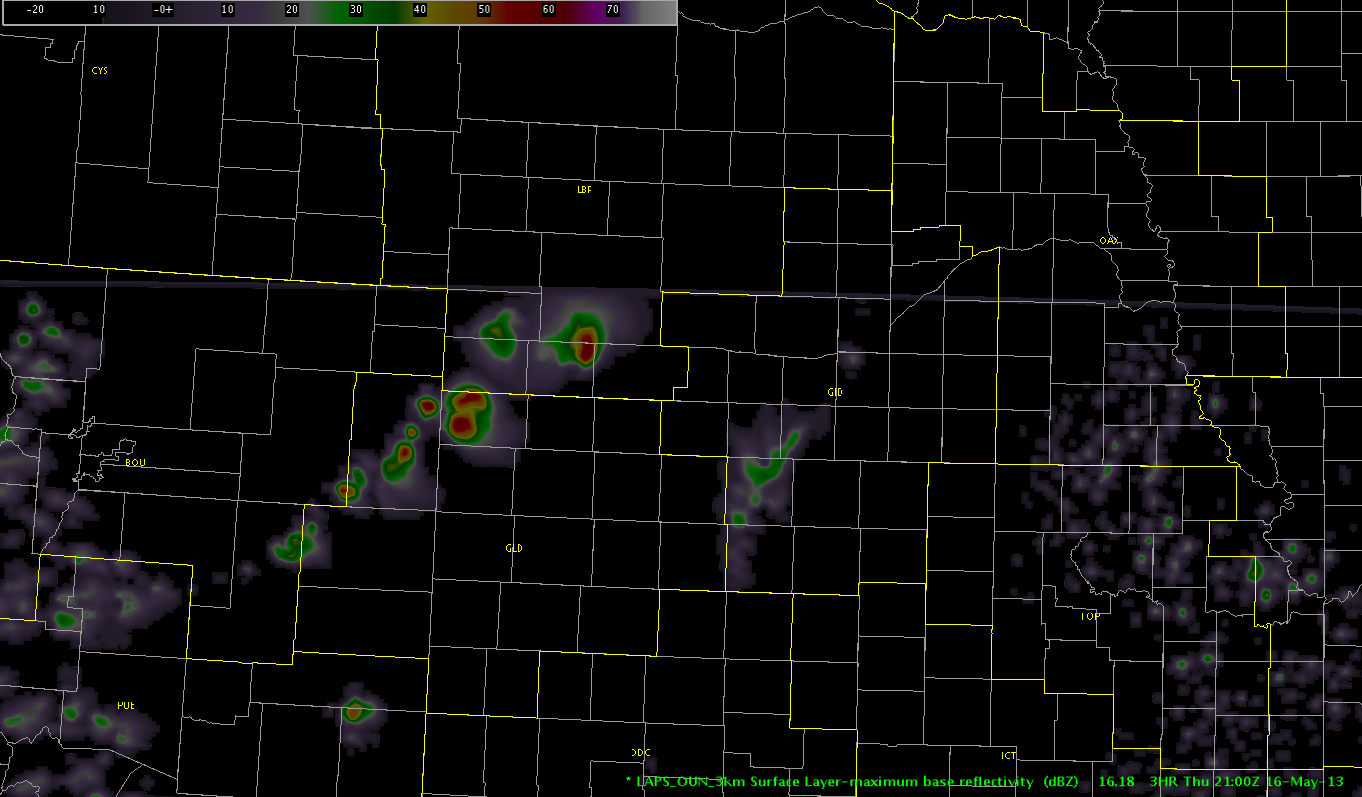 Picca
Picca