

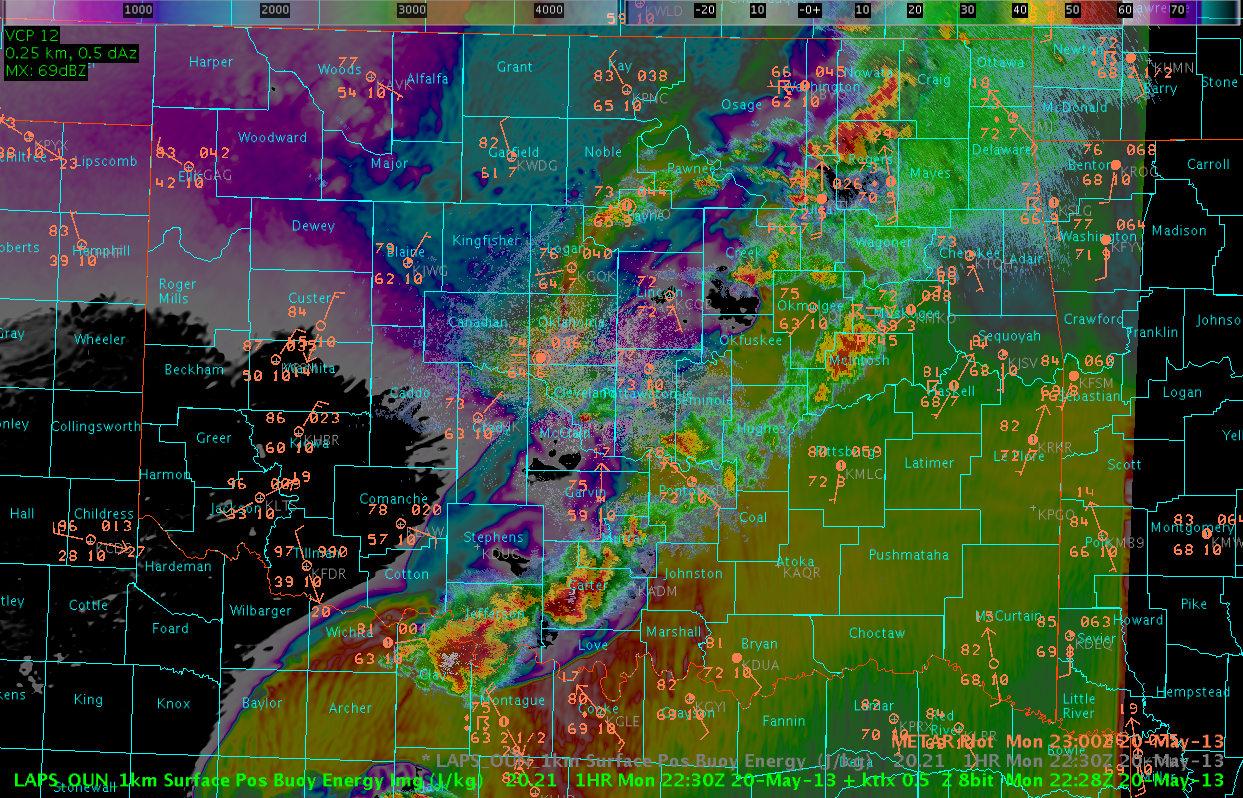
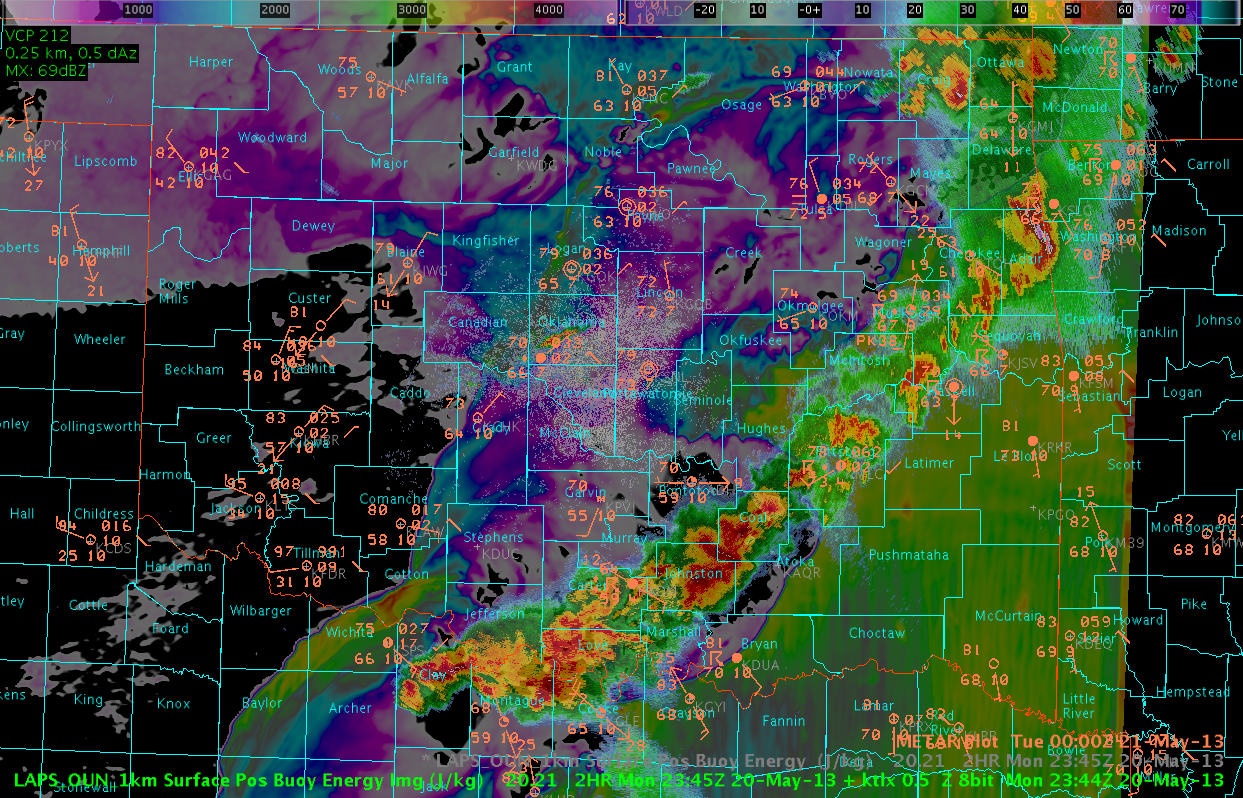
The following imagery are taken from the 21 UTC forecast run of the 1 km LAPS model and are overlaid with KTLX 0.5 reflectivity imagery. At the first image below, valid at 21 UTC, or the model initialization time, you can see the ribbon of high CAPE values, exceeding 4-5000 J/KG is some areas, stretching from SW-NE across portions of north Texas and central Oklahoma. The radar imagery initially are valid at 2116 UTC. Notice the large supercell over the Red River in Clay and Jefferson Counties. The LAPS CAPE values can serve as a proxy of sorts for the resulting reduction of CAPE in association with the outflow from this storm. In subsequent imagery, the outlow (or relatively low CAPE field) can be seen to migrate quickly northward. In image 2, the wind at KPJV is observed to shift from the south, as the outflow boundary crossed the area. The timing matched the LAPS forecast values quite well. Later, in images 3 and 4, as the outflow boundary intersected an area of higher CAPE in the OK City metro, a small storm suddenly develops. The timing of the propagating outflow boundary was handled very well by the LAPS model in this particular case.
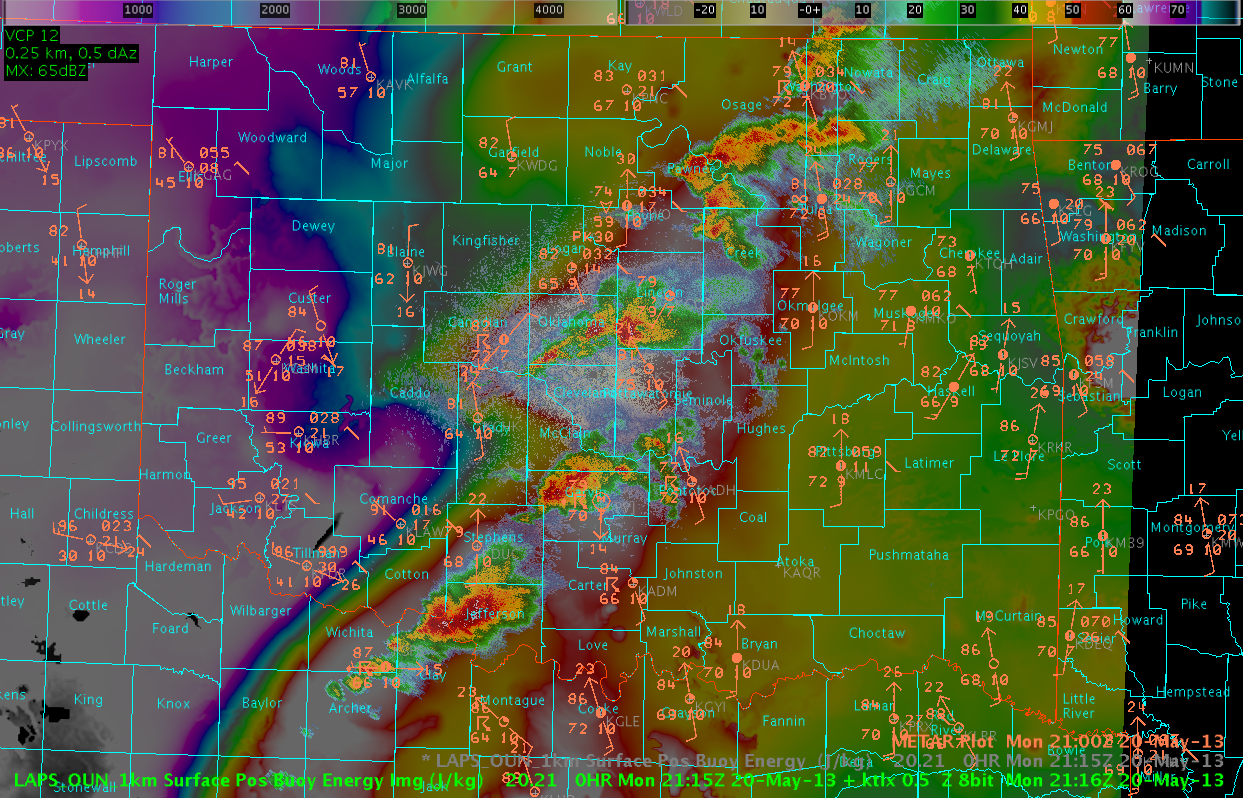

Too bad we couldn’t show a loop of the imagery, because the LAPS’ handling of the outflow from the convection was rather stunning.