
1 Apr 2013 marked the first date of the official data collection period for the 2013 experiment.
A few changes this year: 1) data is now available for analysis the next day via the NSSL FTP server (please contact me for access/location), 2) we have added tracking on the flash extent density (many fewer tracked clusters for these cases since we cannot track a storm prior to entering a LMA region), 3) jumps are now calculated not only for the flash rate of a given storm, but also on the max flash extent density (a 1km square within the storm cluster), and also for the flash rate / storm cluster area, and 4) finally, one a major change is the addition of the Earth Networks Total Lightning Network (ENTLN).
Below is an animated gif from a series of images from the 29 Mar 2013 event over central Oklahoma to illustrate the different products / networks and a few of the issues we’ve seen already (and just prior to start of the “official” data collection).
The first thing that should be readily apparent is the differences between detections by the different networks. The LMA provides a location of the flash initiation, the extent of lightning leaders (viewed by Flash Extent Density). The ENTLN provides a lat/lon location of some individual flashes (both in-cloud and cloud-to-ground), though detection efficiency has not been formally established. The NLDN detects primarily cloud-to-ground flashes, providing (lat/lon) locations and polarity.
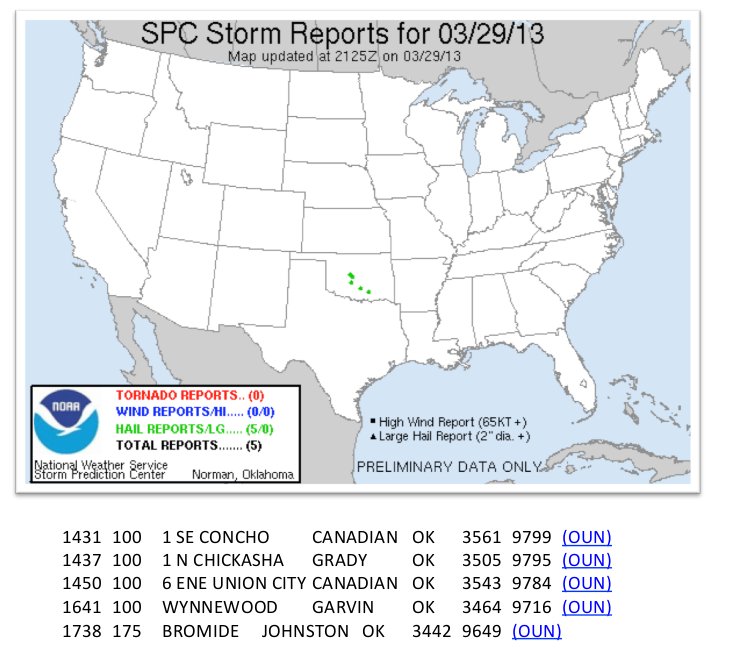
Here are the jumps (from the various products) from the 29 Mar 2013 event and associated time / cell:
— 1430-1600 UTC jumps (using Ref@-10C to ID and track) —
LMA flash rate: 1438 UTC – cell #288, 1449 UTC – cell #288
LMA max flash density: 1449 UTC – cell #288
LMA flash rate per cluster area (km2): 1438 UTC – cell #288, 1444 UTC – cell #294, 1449 UTC – cell #288
ENTLN flash rate: 1445 UTC – cell #288, 1500 UTC – cell #288
and associated SPC Storm Reports:
First issue in this data set: the central OKLMA was constantly between 5-8 operational stations, contributing to data drop-outs throughout the interesting storm period (note, 6 LMA stations are required to detect any single VHF source point for it to make it past the initial quality control). Obviously, this issue is a concern beyond the OKLMA and today’s data. I am still determining a simple way to flag this issue as part of the xml table output to help the analysis… (more on this below)
Second issue: the server quickly became overloaded and missed creating output files for 3-8 min periods at a time (1540-1830 UTC). We are in the process of determining if we need to load-share with another server or can simply modify some of the data processing. Special note: we have not seen this issue since this event but are constantly watching the load on this server…
———-
The OKLMA definitely has continued to have problems regarding the number of active stations. I’ve included text at the end of this post covering the time period a severe storm (1 in – 2 in hail) crossed over Norman for the case shown below. Included is (ls -al listing of a 10 min period) the file sizes of 10 min of realtime OKLMA raw data files; notice that file size jumps quite wildly from minute to minute. Below that I’ve included the header files from three of those times: 0901, 0903, and 0909 UTC. Each of these minutes have different active stations though only 1 net additional for each time period (11, 12, and 13 active stations, respectfully). But the number of sources detected increases ~exponentially (5, 1919, 5014, respectfully). [Please keep in mind that this is raw VHF source detections and not flashes, the flash sorting occurs later in the processing.]
I believe the addition of the El Reno station at 0903 UTC was key to that increase event detections. I don’t think I’ve seen this drastic of a difference in previous real-time data before. Another reason to, at the very least, add a flag or some type of signifier to the processed data regarding the number of active stations.
(ls -al)
-rw-rw-r– 1 ldm ldm 4456 Mar 31 04:01 LYLOUT_130331_090000_0060.dat
-rw-rw-r– 1 ldm ldm 4384 Mar 31 04:02 LYLOUT_130331_090100_0060.dat
-rw-rw-r– 1 ldm ldm 7274 Mar 31 04:03 LYLOUT_130331_090200_0060.dat
-rw-rw-r– 1 ldm ldm 146025 Mar 31 04:04 LYLOUT_130331_090300_0060.dat
-rw-rw-r– 1 ldm ldm 7574 Mar 31 04:05 LYLOUT_130331_090400_0060.dat
-rw-rw-r– 1 ldm ldm 4382 Mar 31 04:06 LYLOUT_130331_090500_0060.dat
-rw-rw-r– 1 ldm ldm 120348 Mar 31 04:07 LYLOUT_130331_090600_0060.dat
-rw-rw-r– 1 ldm ldm 105323 Mar 31 04:08 LYLOUT_130331_090700_0060.dat
-rw-rw-r– 1 ldm ldm 4977 Mar 31 04:09 LYLOUT_130331_090800_0060.dat
-rw-rw-r– 1 ldm ldm 375058 Mar 31 04:11 LYLOUT_130331_090900_0060.dat
[wdssii@cloudy LMA]$ more LYLOUT_130331_090100_0060.dat
 New Mexico Tech Lightning Mapping Array - analyzed data
 Analysis program: /data1/rtlma/bin/lma_analysis_v10.11.1RT/lma_analysis -d 20130331 -t 090100 -s 60 -l /data1/rtlma/bin/lma_analysis_v10.11.1RT/ok.loc -o /data
 1/rtlma/dec_data/130331/09/01
 Analysis program version: 10.11.1RT
 Analysis started: Sun Mar 31 04:02:20 2013
 Analysis finished: Sun Mar 31 04:02:26 2013
 Data start time: 03/31/13 09:01:00
 Number of seconds analyzed: 60
 Location: OK LMA 2002/2005
 Coordinate center (lat,lon,alt): 35.2791257 -97.9178678 417.90
 Maximum diameter of LMA (km): 194.538
 Maximum light-time across LMA (ns): 649039
 Number of stations: 19
 Number of active stations: 11
 Active stations: C D G H I N Y A U B Z
 Minimum number of stations per solution: 6
 Maximum reduced chi-squared: 5.00
 Maximum number of chi-squared iterations: 20
 Station information: id, name, lat(d), lon(d), alt(m), delay(ns), board_rev, rec_ch
 Sta_info: C Chickasha SE 35.0043455 -97.9073041 339.09 146 3 3
 Sta_info: D Dutton 35.2451748 -98.0754888 420.11 253 3 3
 Sta_info: E El Reno 35.4785046 -98.0089380 419.99 158 3 3
 Sta_info: F FAA 35.3843732 -97.6208285 390.30 52 3 3
 Sta_info: G Goldsby 35.1325178 -97.5185999 382.30 151 3 3
 Sta_info: H Chickasha N 35.1299688 -97.9592651 341.93 159 3 3
 Sta_info: I Minco SE 35.2791257 -97.9178678 417.90 156 3 3
 Sta_info: M Middleberg 35.1347342 -97.7257633 414.68 159 3 3
 Sta_info: N Newcastle 35.2564446 -97.6589268 396.65 155 3 3
 Sta_info: O OKC 35.4015724 -97.6014842 393.99 119 3 3
 Sta_info: W Minco W 35.3622021 -98.0397279 415.65 158 3 3
 Sta_info: Y Yukon 35.4402883 -97.7782383 405.96 162 3 3
 Sta_info: A Altus Airport 34.6966400 -99.3406100 435.60 148 3 3
 Sta_info: P Prairie Hill 34.5950200 -99.4936800 447.40 159 3 3
 Sta_info: U Mangum 34.8592300 -99.3612100 483.10 174 3 3
 Sta_info: B Bluff 34.7679400 -99.5392400 509.60 234 3 3
 Sta_info: O Olustee 34.5195200 -99.4349400 407.50 157 3 3
 Sta_info: R Granite 34.9733400 -99.4487200 492.90 168 3 3
 Sta_info: Z Zombie 34.7116100 -99.0802600 427.90 159 3 3
 Station data: id, name, win(us), dec_win(us), data_ver, rms_error(ns), sources, %, <P/P_m>, active
 Sta_data: C Chickasha SE 80 10 70 2 40.0 1.77 A
 Sta_data: D Dutton 80 10 70 3 60.0 9.30 A
 Sta_data: E El Reno 0 0 70 0 0.0 0.00 NA
 Sta_data: F FAA 0 0 70 0 0.0 0.00 NA
 Sta_data: G Goldsby 80 10 70 5 100.0 0.88 A
 Sta_data: H Chickasha N 80 10 70 4 80.0 3.71 A
 Sta_data: I Minco SE 80 10 70 0 0.0 0.00 A
 Sta_data: M Middleberg 0 0 70 0 0.0 0.00 NA
 Sta_data: N Newcastle 80 10 70 4 80.0 0.99 A
 Sta_data: O OKC 0 0 70 0 0.0 0.00 NA
 Sta_data: W Minco W 0 0 70 0 0.0 0.00 NA
 Sta_data: Y Yukon 80 10 70 3 60.0 2.48 A
 Sta_data: A Altus Airport 80 10 70 1 20.0 0.06 A
 Sta_data: P Prairie Hill 0 0 70 0 0.0 0.00 NA
 Sta_data: U Mangum 80 10 70 2 40.0 0.35 A
 Sta_data: B Bluff 80 10 70 3 60.0 1.06 A
 Sta_data: O Olustee 0 0 70 0 0.0 0.00 NA
 Sta_data: R Granite 0 0 70 0 0.0 0.00 NA
 Sta_data: Z Zombie 80 10 70 3 60.0 0.08 A
 Metric file version: 4
 Station mask order: ZROBUPAYWONMIHGFEDC
 Data: time (UT sec of day), lat, lon, alt(m), reduced chi^2, P(dBW), mask
 Data format: 15.9f 12.8f 13.8f 9.2f 6.2f 5.1f 7x
 Number of events: 5
 *** data ***
 32483.420073930 33.10235512 -100.69250915 450975.32 2.11 36.6 0x01932
 32492.744501099 34.85556274 -98.92710217 43824.93 1.60 20.7 0x4c032
 32497.223350796 35.13756612 -97.95587964 1403.88 0.83 18.8 0x04133
 32504.743797217 35.44091271 -97.67734666 45462.14 4.07 23.5 0x48911
 32506.247514080 31.47113948 -99.42825852 425506.86 4.15 36.4 0x48930
———————–
[wdssii@cloudy LMA]$ more LYLOUT_130331_090300_0060.dat
 New Mexico Tech Lightning Mapping Array - analyzed data
 Analysis program: /data1/rtlma/bin/lma_analysis_v10.11.1RT/lma_analysis -d 20130331 -t 090300 -s 60 -l /data1/rtlma/bin/lma_analysis_v10.11.1RT/ok.loc -o /data
 1/rtlma/dec_data/130331/09/03
 Analysis program version: 10.11.1RT
 Analysis started: Sun Mar 31 04:04:20 2013
 Analysis finished: Sun Mar 31 04:04:39 2013
 Data start time: 03/31/13 09:03:00
 Number of seconds analyzed: 60
 Location: OK LMA 2002/2005
 Coordinate center (lat,lon,alt): 35.2791257 -97.9178678 417.90
 Maximum diameter of LMA (km): 194.538
 Maximum light-time across LMA (ns): 649039
 Number of stations: 19
 Number of active stations: 12
 Active stations: C D E G H I N Y P U R Z
 Minimum number of stations per solution: 6
 Maximum reduced chi-squared: 5.00
 Maximum number of chi-squared iterations: 20
 Station information: id, name, lat(d), lon(d), alt(m), delay(ns), board_rev, rec_ch
 Sta_info: C Chickasha SE 35.0043455 -97.9073041 339.09 146 3 3
 Sta_info: D Dutton 35.2451748 -98.0754888 420.11 253 3 3
 Sta_info: E El Reno 35.4785046 -98.0089380 419.99 158 3 3
 Sta_info: F FAA 35.3843732 -97.6208285 390.30 52 3 3
 Sta_info: G Goldsby 35.1325178 -97.5185999 382.30 151 3 3
 Sta_info: H Chickasha N 35.1299688 -97.9592651 341.93 159 3 3
 Sta_info: I Minco SE 35.2791257 -97.9178678 417.90 156 3 3
 Sta_info: M Middleberg 35.1347342 -97.7257633 414.68 159 3 3
 Sta_info: N Newcastle 35.2564446 -97.6589268 396.65 155 3 3
 Sta_info: O OKC 35.4015724 -97.6014842 393.99 119 3 3
 Sta_info: W Minco W 35.3622021 -98.0397279 415.65 158 3 3
 Sta_info: Y Yukon 35.4402883 -97.7782383 405.96 162 3 3
 Sta_info: A Altus Airport 34.6966400 -99.3406100 435.60 148 3 3
 Sta_info: P Prairie Hill 34.5950200 -99.4936800 447.40 159 3 3
 Sta_info: U Mangum 34.8592300 -99.3612100 483.10 174 3 3
 Sta_info: B Bluff 34.7679400 -99.5392400 509.60 234 3 3
 Sta_info: O Olustee 34.5195200 -99.4349400 407.50 157 3 3
 Sta_info: R Granite 34.9733400 -99.4487200 492.90 168 3 3
 Sta_info: Z Zombie 34.7116100 -99.0802600 427.90 159 3 3
 Station data: id, name, win(us), dec_win(us), data_ver, rms_error(ns), sources, %, <P/P_m>, active
 Sta_data: C Chickasha SE 80 10 70 1841 95.9 3.53 A
 Sta_data: D Dutton 80 10 70 67 3.5 1.62 A
 Sta_data: E El Reno 80 10 70 1876 97.8 1.11 A
 Sta_data: F FAA 0 0 70 0 0.0 0.00 NA
 Sta_data: G Goldsby 80 10 70 1888 98.4 1.41 A
 Sta_data: H Chickasha N 80 10 70 78 4.1 0.65 A
 Sta_data: I Minco SE 80 10 70 17 0.9 0.00 A
 Sta_data: M Middleberg 0 0 70 0 0.0 0.00 NA
 Sta_data: N Newcastle 80 10 70 1868 97.3 1.18 A
 Sta_data: O OKC 0 0 70 0 0.0 0.00 NA
 Sta_data: W Minco W 0 0 70 0 0.0 0.00 NA
 Sta_data: Y Yukon 80 10 70 30 1.6 5.42 A
 Sta_data: A Altus Airport 0 0 70 0 0.0 0.00 NA
 Sta_data: P Prairie Hill 80 10 70 1909 99.5 0.00 A
 Sta_data: U Mangum 80 10 70 17 0.9 0.18 A
 Sta_data: B Bluff 0 0 70 0 0.0 0.00 NA
 Sta_data: O Olustee 0 0 70 0 0.0 0.00 NA
 Sta_data: R Granite 80 10 70 20 1.0 0.49 A
 Sta_data: Z Zombie 80 10 70 1908 99.4 0.42 A
 Metric file version: 4
 Station mask order: ZROBUPAYWONMIHGFEDC
 Data: time (UT sec of day), lat, lon, alt(m), reduced chi^2, P(dBW), mask
 Data format: 15.9f 12.8f 13.8f 9.2f 6.2f 5.1f 7x
 Number of events: 1919
 *** data ***
 32580.015923202 35.30497068 -98.02190064 7436.24 1.23 16.2 0x42115
 32580.028474879 35.03748360 -97.48952779 7700.38 0.15 16.4 0x42115
————————————–
[wdssii@cloudy LMA]$ more LYLOUT_130331_090900_0060.dat
 New Mexico Tech Lightning Mapping Array - analyzed data
 Analysis program: /data1/rtlma/bin/lma_analysis_v10.11.1RT/lma_analysis -d 20130331 -t 090900 -s 60 -l /data1/rtlma/bin/lma_analysis_v10.11.1RT/ok.loc -o /data1/rtlma
 /dec_data/130331/09/09
 Analysis program version: 10.11.1RT
 Analysis started: Sun Mar 31 04:10:20 2013
 Analysis finished: Sun Mar 31 04:10:56 2013
 Data start time: 03/31/13 09:09:00
 Number of seconds analyzed: 60
 Location: OK LMA 2002/2005
 Coordinate center (lat,lon,alt): 35.2791257 -97.9178678 417.90
 Maximum diameter of LMA (km): 194.538
 Maximum light-time across LMA (ns): 649039
 Number of stations: 19
 Number of active stations: 13
 Active stations: C D E G H I N W Y P U R Z
 Minimum number of stations per solution: 6
 Maximum reduced chi-squared: 5.00
 Maximum number of chi-squared iterations: 20
 Station information: id, name, lat(d), lon(d), alt(m), delay(ns), board_rev, rec_ch
 Sta_info: C Chickasha SE 35.0043455 -97.9073041 339.09 146 3 3
 Sta_info: D Dutton 35.2451748 -98.0754888 420.11 253 3 3
 Sta_info: E El Reno 35.4785046 -98.0089380 419.99 158 3 3
 Sta_info: F FAA 35.3843732 -97.6208285 390.30 52 3 3
 Sta_info: G Goldsby 35.1325178 -97.5185999 382.30 151 3 3
 Sta_info: H Chickasha N 35.1299688 -97.9592651 341.93 159 3 3
 Sta_info: I Minco SE 35.2791257 -97.9178678 417.90 156 3 3
 Sta_info: M Middleberg 35.1347342 -97.7257633 414.68 159 3 3
 Sta_info: N Newcastle 35.2564446 -97.6589268 396.65 155 3 3
 Sta_info: O OKC 35.4015724 -97.6014842 393.99 119 3 3
 Sta_info: W Minco W 35.3622021 -98.0397279 415.65 158 3 3
 Sta_info: Y Yukon 35.4402883 -97.7782383 405.96 162 3 3
 Sta_info: A Altus Airport 34.6966400 -99.3406100 435.60 148 3 3
 Sta_info: P Prairie Hill 34.5950200 -99.4936800 447.40 159 3 3
 Sta_info: U Mangum 34.8592300 -99.3612100 483.10 174 3 3
 Sta_info: B Bluff 34.7679400 -99.5392400 509.60 234 3 3
 Sta_info: O Olustee 34.5195200 -99.4349400 407.50 157 3 3
 Sta_info: R Granite 34.9733400 -99.4487200 492.90 168 3 3
 Sta_info: Z Zombie 34.7116100 -99.0802600 427.90 159 3 3
 Station data: id, name, win(us), dec_win(us), data_ver, rms_error(ns), sources, %, <P/P_m>, active
 Sta_data: C Chickasha SE 80 10 70 4319 86.1 2.37 A
 Sta_data: D Dutton 80 10 70 84 1.7 7.58 A
 Sta_data: E El Reno 80 10 70 4455 88.9 0.91 A
 Sta_data: F FAA 0 0 70 0 0.0 0.00 NA
 Sta_data: G Goldsby 80 10 70 4070 81.2 1.26 A
 Sta_data: H Chickasha N 80 10 70 149 3.0 1.27 A
 Sta_data: I Minco SE 80 10 70 38 0.8 0.00 A
 Sta_data: M Middleberg 0 0 70 0 0.0 0.00 NA
 Sta_data: N Newcastle 80 10 70 4562 91.0 1.05 A
 Sta_data: O OKC 0 0 70 0 0.0 0.00 NA
 Sta_data: W Minco W 80 10 70 4128 82.3 5.69 A
 Sta_data: Y Yukon 80 10 70 95 1.9 3.14 A
 Sta_data: A Altus Airport 0 0 70 0 0.0 0.00 NA
 Sta_data: P Prairie Hill 80 10 70 4804 95.8 0.00 A
 Sta_data: U Mangum 80 10 70 47 0.9 0.08 A
 Sta_data: B Bluff 0 0 70 0 0.0 0.00 NA
 Sta_data: O Olustee 0 0 70 0 0.0 0.00 NA
 Sta_data: R Granite 80 10 70 60 1.2 0.22 A
 Sta_data: Z Zombie 80 10 70 4368 87.1 0.32 A
 Metric file version: 4
 Station mask order: ZROBUPAYWONMIHGFEDC
 Data: time (UT sec of day), lat, lon, alt(m), reduced chi^2, P(dBW), mask
 Data format: 15.9f 12.8f 13.8f 9.2f 6.2f 5.1f 7x
 Number of events: 5014
 *** data ***
 32940.000377496 35.03210068 -97.80952546 4892.64 0.47 17.7 0x42515
 32940.014071929 35.06811963 -97.21688673 4949.58 1.00 16.3 0x02515