Sometimes you blow a forecast and convection fires up hours ahead of “schedule”. So TMU (Traffic Management Unit) comes running over and wants to know a few things…
1) How tall are these storms going to get?
2) Are these isolated supercells going to turn into a cluster….broken line…solid line…or remain isolated to widely scattered? And What jet routes are going to see the largest impact? Are some going to be completely compromised? Some planes are already deviating – is this going to get worse?
3) Where are these storms going?
4) How long do we have until they impact the arrival gates at [insert airport name here]?
So you can see that days like this can be extremely stressful for the CWSU meteorologist as well as the TMU and controllers. Satellite data has been great with respect to timing and location of convective initiation…but once those storms blow up – those satellite products are not necessarily useful as the event continues….
So what can we do with MRMS and 3DVAR data?

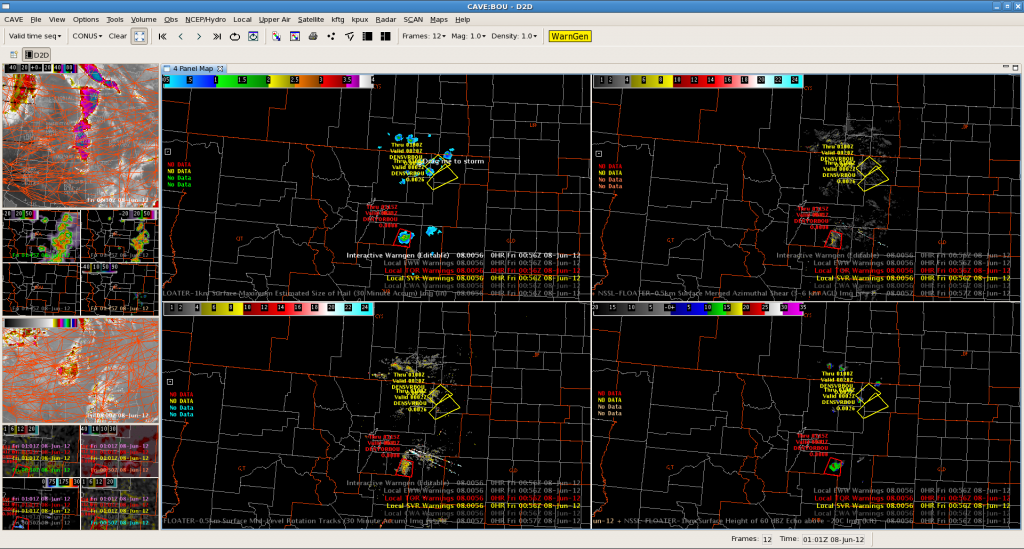
Figure 1 shows the MRMS products, including MESH, Azimuthal Shear, Mid-Level Rotation Tracks, and Height of 50dBZ and 60dBZ Echos above -20C.Sometimes pilots like to deviate as little as possible, and you’ll be asked if they can actually get thru the gaps between the thunderstorms. the MRMS data can really help you to visualize the true strength and areal extent of the thunderstorms. Overlay the jet routes and perhaps this information can be used to see if new playbooks truly need to be implemented at that point in time…or if air craft can remain on their routes and utilize those gaps between storms.
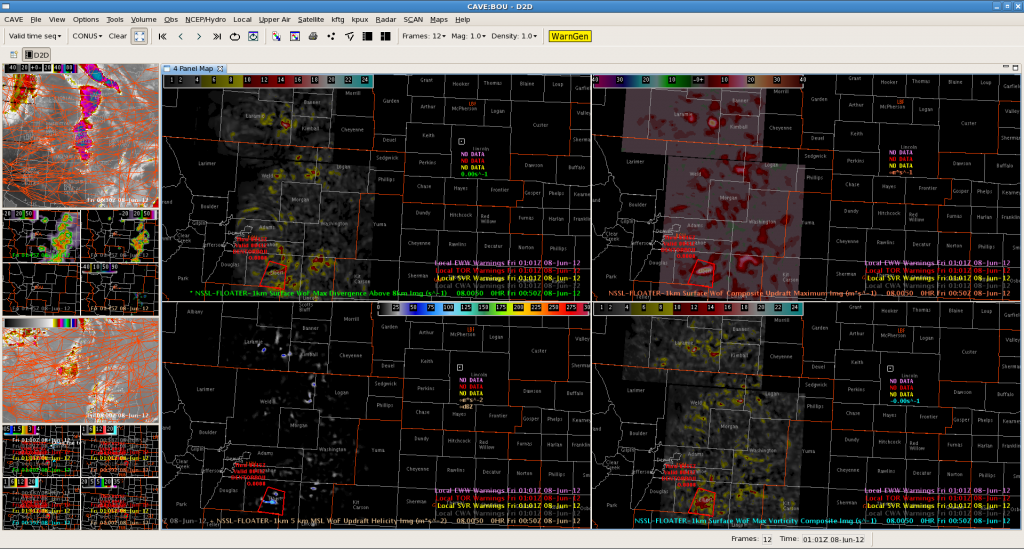
Figure 2 shows the 3DVAR data, including storm top divergence, updraft intensity, helicity, and vorticity…perhaps these products can also be used to identify the true impacts to different jet routes across the NAS.

Just a thought!

