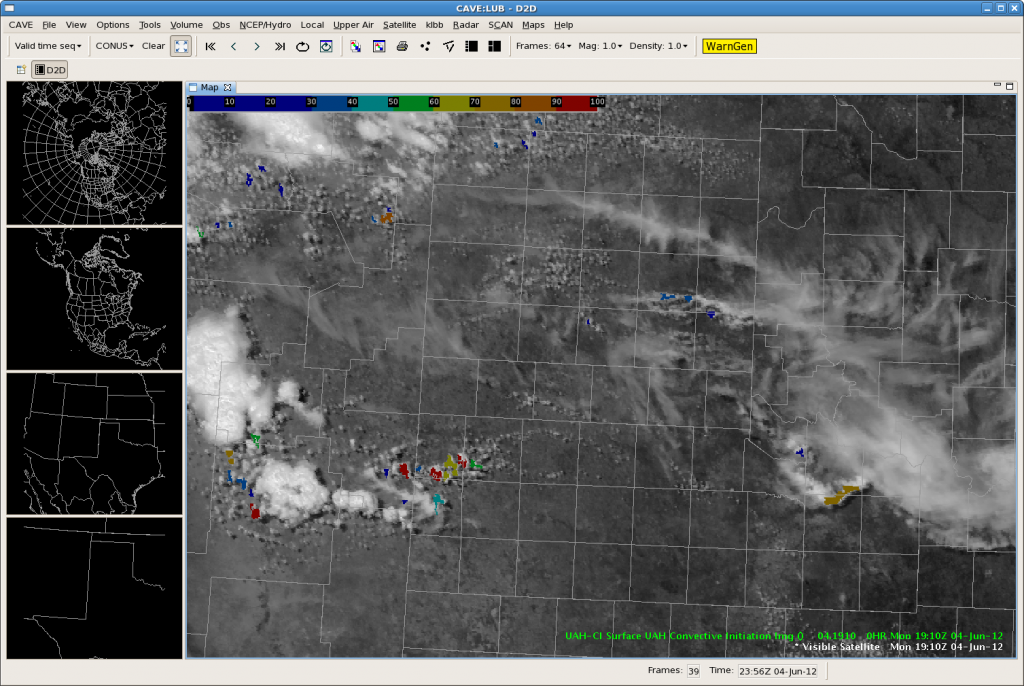
Shortly after entering the lab, thunderstorms quickly fired up over our area of responsibility. While getting familiar with the new forecasting and diagnostic tools, we were quickly thrown into a “warning operations” situation.
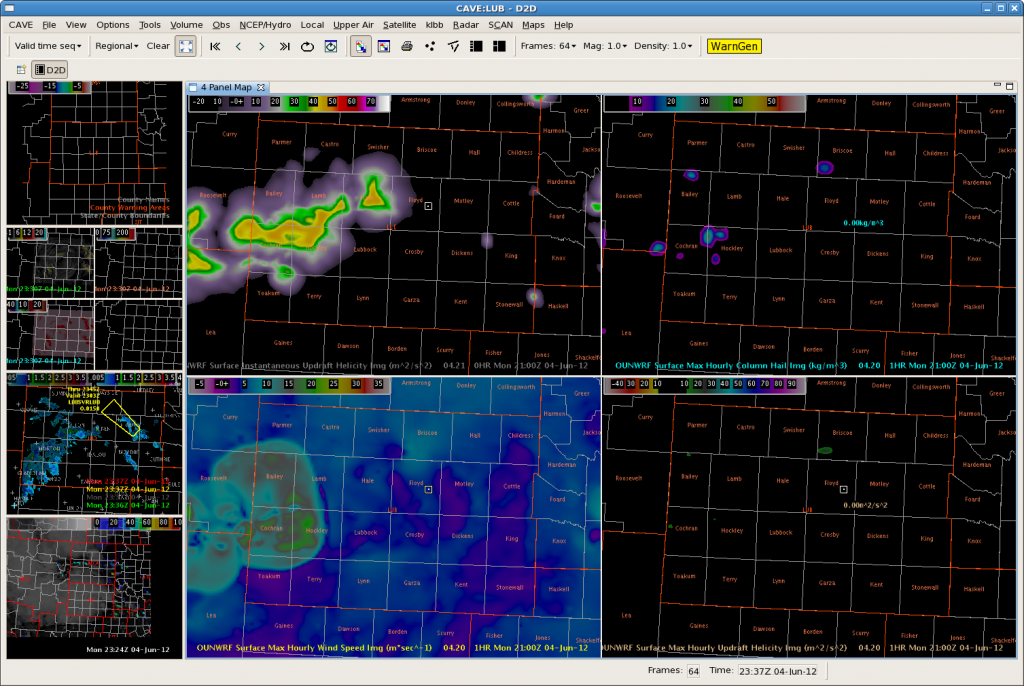
The OUNWRF did a fairly good job handling the timing and location of convective initiation this afternoon (Figure 1). Along with using the OUNWRF, we also tested the UW-CIMSS Cloud Top Cooling tool. The UW-CTC tool did a great job picking up the areas of developing convection across the CWA This afternoon. UW-CTC algorithm seemed to have only two”false alarms”, one of which being the result of some high clouds. It was pretty easy to identify the “false alarm” as the CTC rates were extremely low (on the order of -5C/15min), compared to CTC rates around -20C/15min (observed with most of the developing activity).
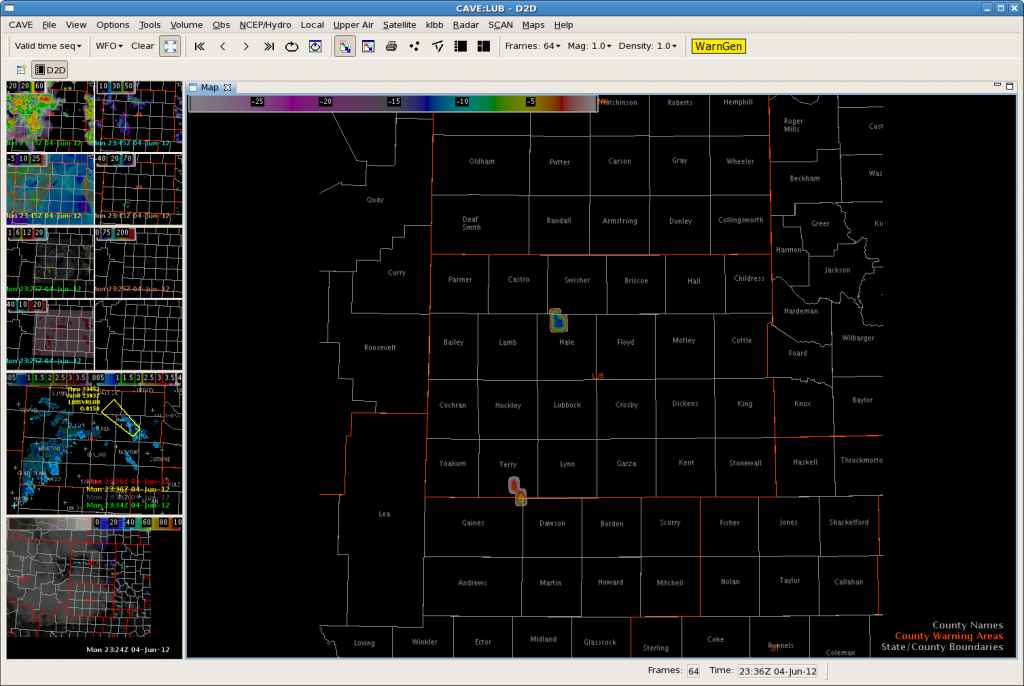
The second “false alarm” occurred when the CTC algorithm tagged a developing storm with CTC rates from -15 to -20C/15min (figure 3). After warning on this storm, we waited for LSRs and never saw a report to verify the warning.
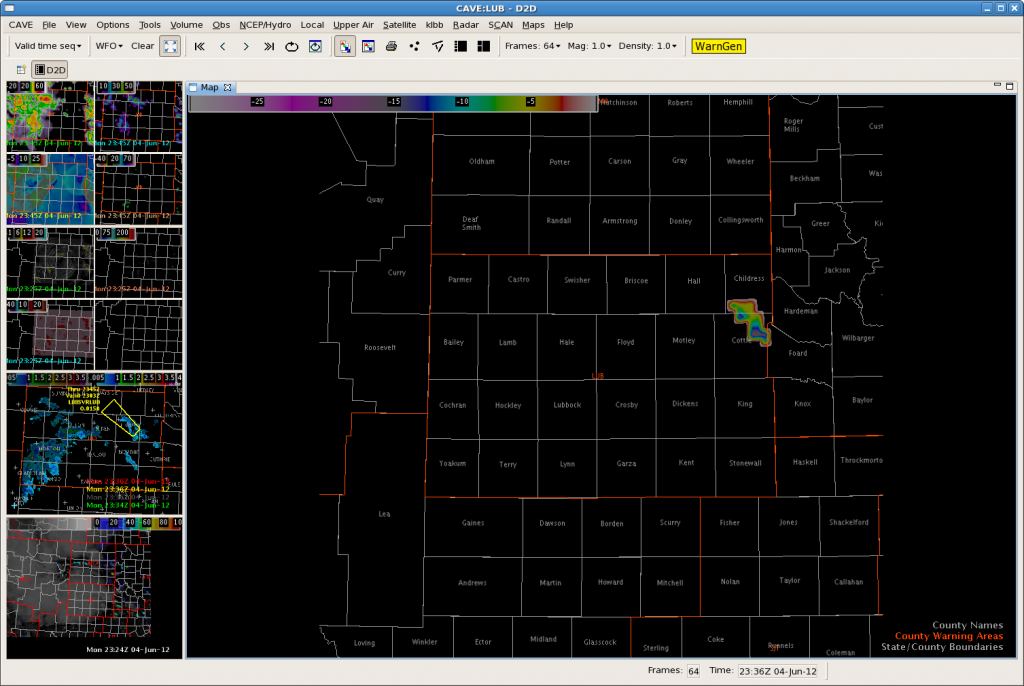
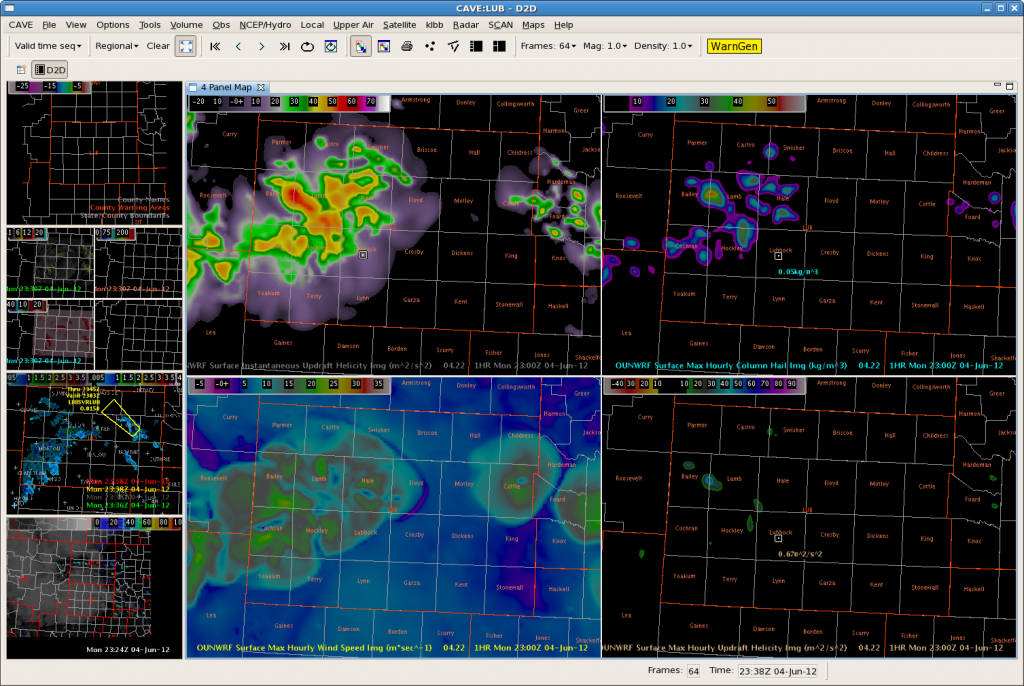
Despite a couple of false alarms, we were very pleased with the performance of the OUNWRF with respect to the storms becoming outflow dominate and producing more wind damage than hail. We received wind gust reports greater than 60mph in the LBB area, as well as numerous downed trees. Figure 4 below illustrates the surface max hourly wind speed. Typically winds greater than 20m/s should raise heightened awareness and the potential for damaging winds.
Had we a little more time to become familiar with the products and get “spun up” with our procedures and whatnot…the Convective Initiation tool would have helped us greatly. Figure 5 below shows the CI application combined with vis sat imagery. The algorithm picks up the CI very nicely…this storm eventually blew up and was one of the larger storms of the day. The storm produced very large hail.The UAH-CI application continued to be quite helpful to us during the rest of the shift.
