
How are warning polygons verified? Remember that a warning polygon describes an area within which a forecaster thinks there will be severe weather during the duration of the warning, in other words, the swath over which the current threat is expected to cover. This concept of the “swath” will be explored in later blog entries, but for now, we will consider it the entire area of the warning. In order for the warning polygon to be verified, the warning area need only contain a single storm report point.
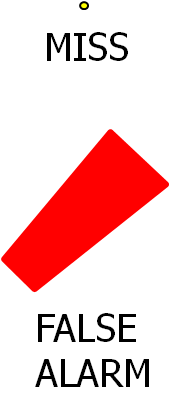
So, backing up a bit, if there is a severe weather report point falling outside any polygons, that report point is counted as one MISS. And if a warning area (the polygon) contains no severe weather reports, the warning area is considered one FALSE ALARM. See an issue yet?
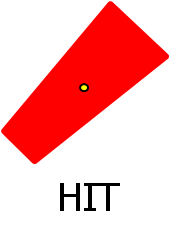
What about HITs? If a severe weather report point is inside a warning polygon, then that report point is counted as one HIT. And, if a warning area (the polygon) contains at least one report point, that warning area is considered a HIT. But which HIT value is used for NWS verification. The answer is: both!
By now, you should begin to see the issues with this. First, since the NWS offices are responsible for verifying their own warnings, they need only find a single severe weather observation at a single point location to verify the polygon, even though severe weather affects areas. Hail falls in “swaths” with width and length. Tornadoes follow paths with width and length (although usually the width is below the precision of a warning polygon, usually < 1 km). And wind damage can occur over broad areas within a storm. These three phenomena rarely, if ever, occur as a point! So, the observational data used to verify areal warnings is usually lacking in completeness.
Second, we are using point observations to verify an areal forecast. Shouldn’t an areal forecast be verified using areal data? After all, the forecaster felt that severe weather was possible in the entire area of the polygon.
(As an aside, another issue to consider is that the observation point usually does not represent the location and time of the first severe weather occurrence with the storm. Lead times are usually calculated to be the difference between the time of the observation and the time of warning issuance. Since these observations may indeed be recorded at some time after the onset of severe weather with the storm, the lead time ends up being recorded as being much longer than it probably was. We’ll get to this issue in a later blog entry.)
So let’s go back to our 2×2 contingency table introduced in the previous blog entry. If we consider the 2×2 table for the warning areas (the polygons), we would have:
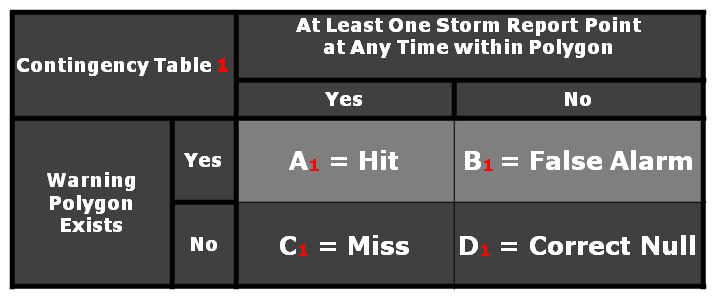
![]()
Note that I’ve highlighted the A and B cells. These are the values that are used to calculate the False Alarm Ratio (FAR) for warnings, it is based on the area forecasts. Since this comes from this first 2×2 table, we will call the False Alarm Ratio, FAR1.
Now let’s consider another 2×2 table, this time for the severe weather report points:
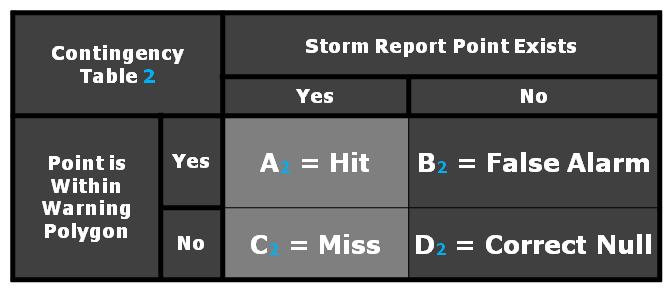
![]()
Note that I’ve highlighted the A and C cells this time. These are the values that are used to calculate the Probability Of Detection (POD) for warnings, it is based on severe weather report points. Since this comes from this second 2×2 table, we will call the Probability Of Detection, POD2. Also note that both types of HITS, A1 and A2, are being used.
Finally, the NWS calculates a Critical Success Index (CSI) to combine the contributions POD and FAR into one metric. But here is the flaw. The CSI is computed using the version of the formula that is a function of POD and FAR, however, they plug in POD2 and FAR1 into that formula. After algebriac manipulation, it can be shown that their version of CSI does not equal the equation of CSI as a function of HIT, FALSE ALARM, and MISS (A, B, and C in the 2×2 table).
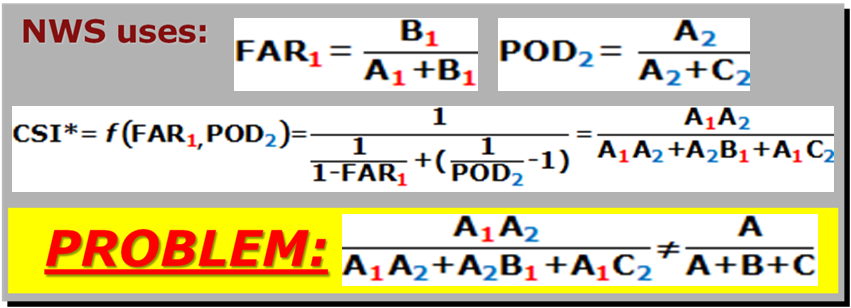
And thus we have the first pitfall of NWS warning verification…the metrics include elements from two 2×2 tables….2×2 x2!
Greg Stumpf, CIMMS and NWS/MDL