
Continuing from the previous blog entry, because only one storm report verification point is required to verify a warning polygon area, note that a single point can be used to verify a polygon of any size or duration! As shown in figure below, each of these two polygon examples would be scored as area HITs using the traditional NWS verification methods, the small short warning and the large long warning. But note that the larger and longer the warning provides greater likelihood of having a severe weather report in the warning, and a greater chance of having multiple storm reports in the warning, resulting in multiple point HITs. Since the calculation for POD uses the 2×2 contingency table for points (POD2), a forecaster issuing larger and longer warnings should inevitably be rewarded with a larger average POD of all their warnings.

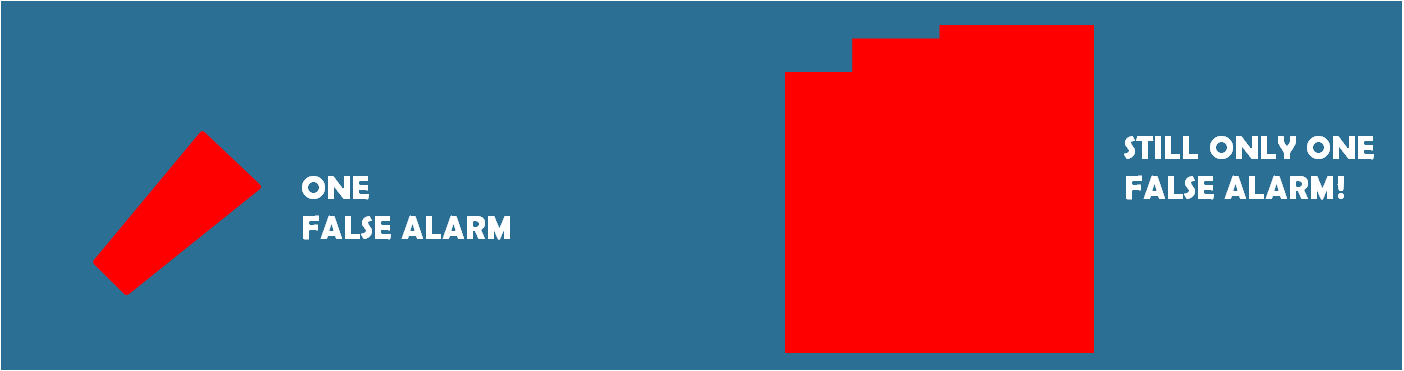
If any warning area ends up not verifying (no report points within the area), then that warning area gets counted as a false alarm. The False Alarm Ratio (FAR) is calculated using the 2×2 contingency table for polygon areas (FAR1). This means that no matter how large, or how long in duration a warning area is, that warning polygon area gets counted as only one false alarm! Therefore, there is no false alarm penalty for making warnings larger and longer, and as shown above, improves the chances of a higher POD. On top of all this, if the warning is issued with a very long duration and well before anticipated severe weather, this increases the chances of having a larger lead time. If that warning never verifies, there is no negative consequence on the calculation of lead time, because it never gets used.
Extrapolating this “out to infinity”, a WFO need only issue one warning covering their entire county warning area (CWA) for an entire year. If there are no reports for the entire year, then only one false alarm is counted. If there is at least one report that year, then a HIT is scored for that warning, and each report point is scored as a HIT. In addition, the later in the year those reports occur, the larger the lead time would be, and measured in days, weeks, or months. Imagine those incredible stats!
And so we’ve got the second pitfall of NWS warning verification…it would be an advantage to any forecaster trying to increase their odds of better verification scores to just make warning polygons larger and longer, what I call “casting a wider net”.

Is this better service? Is it better to increase the area of the warning in order to gain hits and reduce the chance of a false alarm? This of course will be natural tendency of any forecaster hoping to gain the best verification scores, and ends up being completely counter to the intention of storm-based warnings, that being the reduction in the size of warnings and greater warning precision and specificity! Issuing fewer larger and longer warnings also reduces the workload. Note too that even if the large and long warnings verify, there is a tremendous amount of false alarm area and false alarm time away from the hazard areas in these warnings, but that never gets measured by the present verification system.
The next blog entries will address how we can address these pitfalls with an improved warning verification methodology that will better reward precision in warnings, and provide a host of other benefits, including ways to measure the goodness in new warning services techniques.
Greg Stumpf, CIMMS and NWS/MDL