AllSky & TPW Check

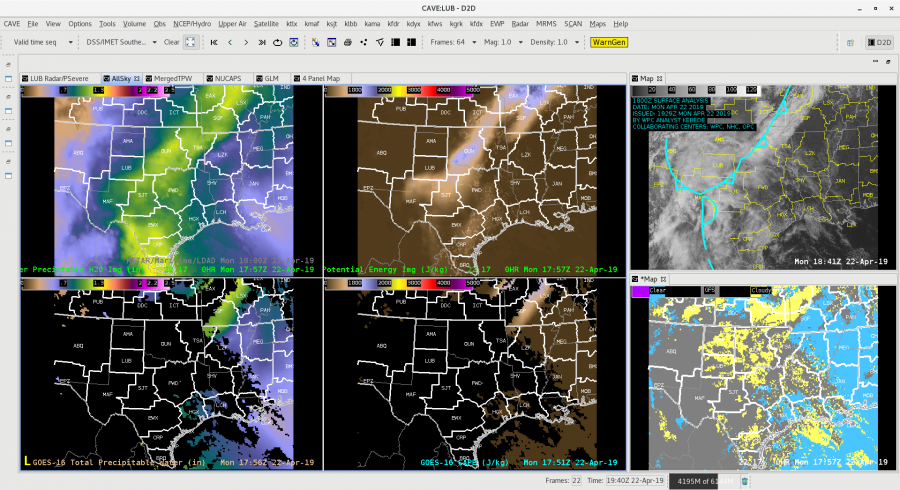
Did a quick check of the merged TPW and AllSky products and as previously advertised/anticipated, the convection has been riding right along the gradient of the higher instability, but there is some discrepancy as to whether it’s right in the heart of the higher PWATs or along the leading edge, depending on if you’re looking at the AllSky or TPW, respectively. Noticed quite a bit of a latency in the availability of these products (up to an hour), which wouldn’t be good in an operational setting. Compared the values of the TPW and AllSky PWAT with the RAP, and the AllSky matched up much closer to the RAP. However, with the amount of cloud cover in the region (for obvious reasons), the GFS is the predominant data type (basically a model-to-model comparison). Either way, the general idea/trend is helpful if serving as a mesoanalyst in an operational environment.

~Gritty

(CAPE)

(AllSky PWATs)

(Merged TPW)

Layered TPW Shows Arrival Of Moisture

We’ve been monitoring a boundary on both the KEOX and KEVX radar, likely associated with weak surface convergence per surface obs. 
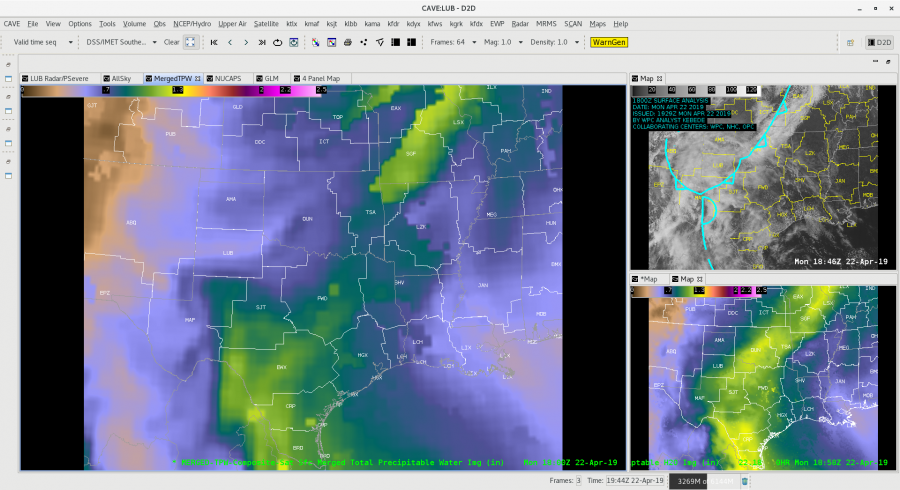
The layered TPW product shows a tongue of moisture approaching the region. It looks like a line of towering cumulus developed over the Gulf of Mexico as this moisture interacted with the convergence line.
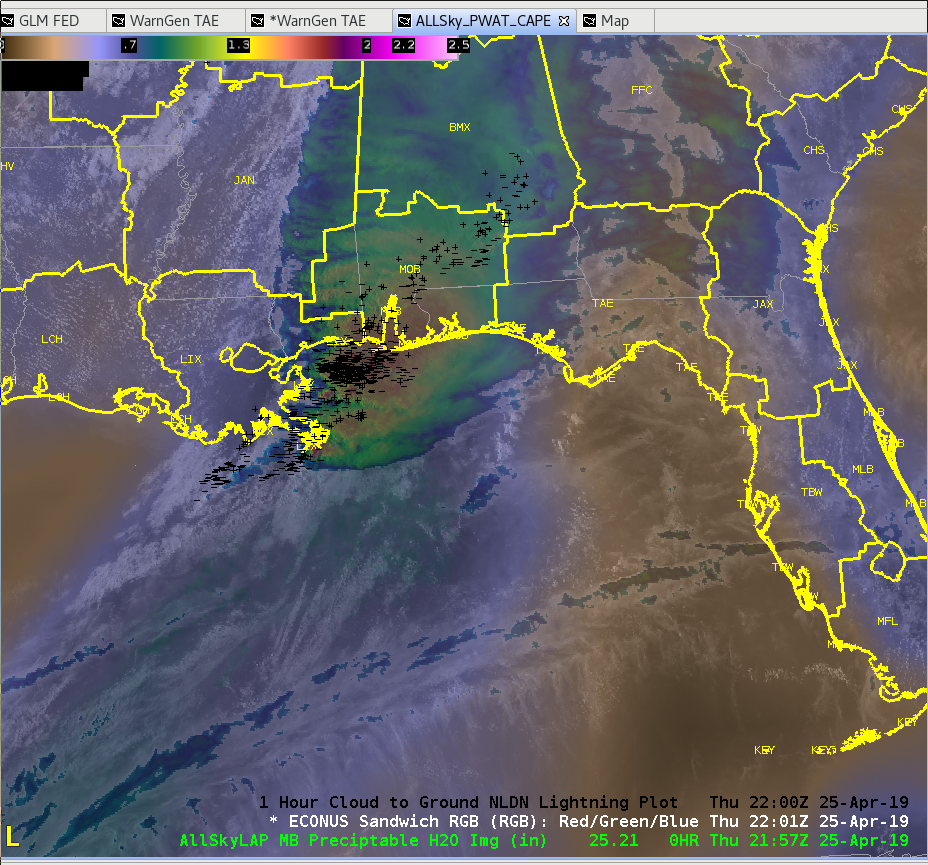
Sandor Clegane

Precipitable Water Overview

Looking at the different precipitable water (PW) products available in the HWT and doing a quick overview the All-Sky products provides a great first guess to fill in the PW where it is cloudy. Both the Merged TPW and the All-Sky take the first step in filling in where there are clouds. The image below  shows the sheer volume of data that isn’t available due to the pesky cloud cover. The 4-Panel to the left shows the All-Sky PW and CAPE on top vs. the raw derived PW and CAPE from GOES-16. On the right you can see the visible satellite and the All-Sky mask showing that most of the data, especially over Texas and Oklahoma is raw GFS (gray areas) at this point.

Looking at the Blended TWP vs. the All-Sky there are significant differences over north Texas and Oklahoma for this time frame. The BTWP product “is not forecast model dependent. ATPW uses  GFS model winds to advect the microwave retrievals and the GOES-16 component uses GFS in its TPW solution.” You can see where the blended product (big window below) only shows about 0.75 in PW, while the All-Sky is showing 1.25 in. across the Norman WFO. This can make a big difference when looking at rainfall forecasting and trying to assess just how much moisture in the atmosphere is over an area. In this case would certainly lean towards the All-Sky and then compare the information to other model soundings (from the HRRR, NAM, ECMWF, etc.) and to actual Upper Air soundings to see how the areas populated by the raw GFS are doing.

-Alexander T.