

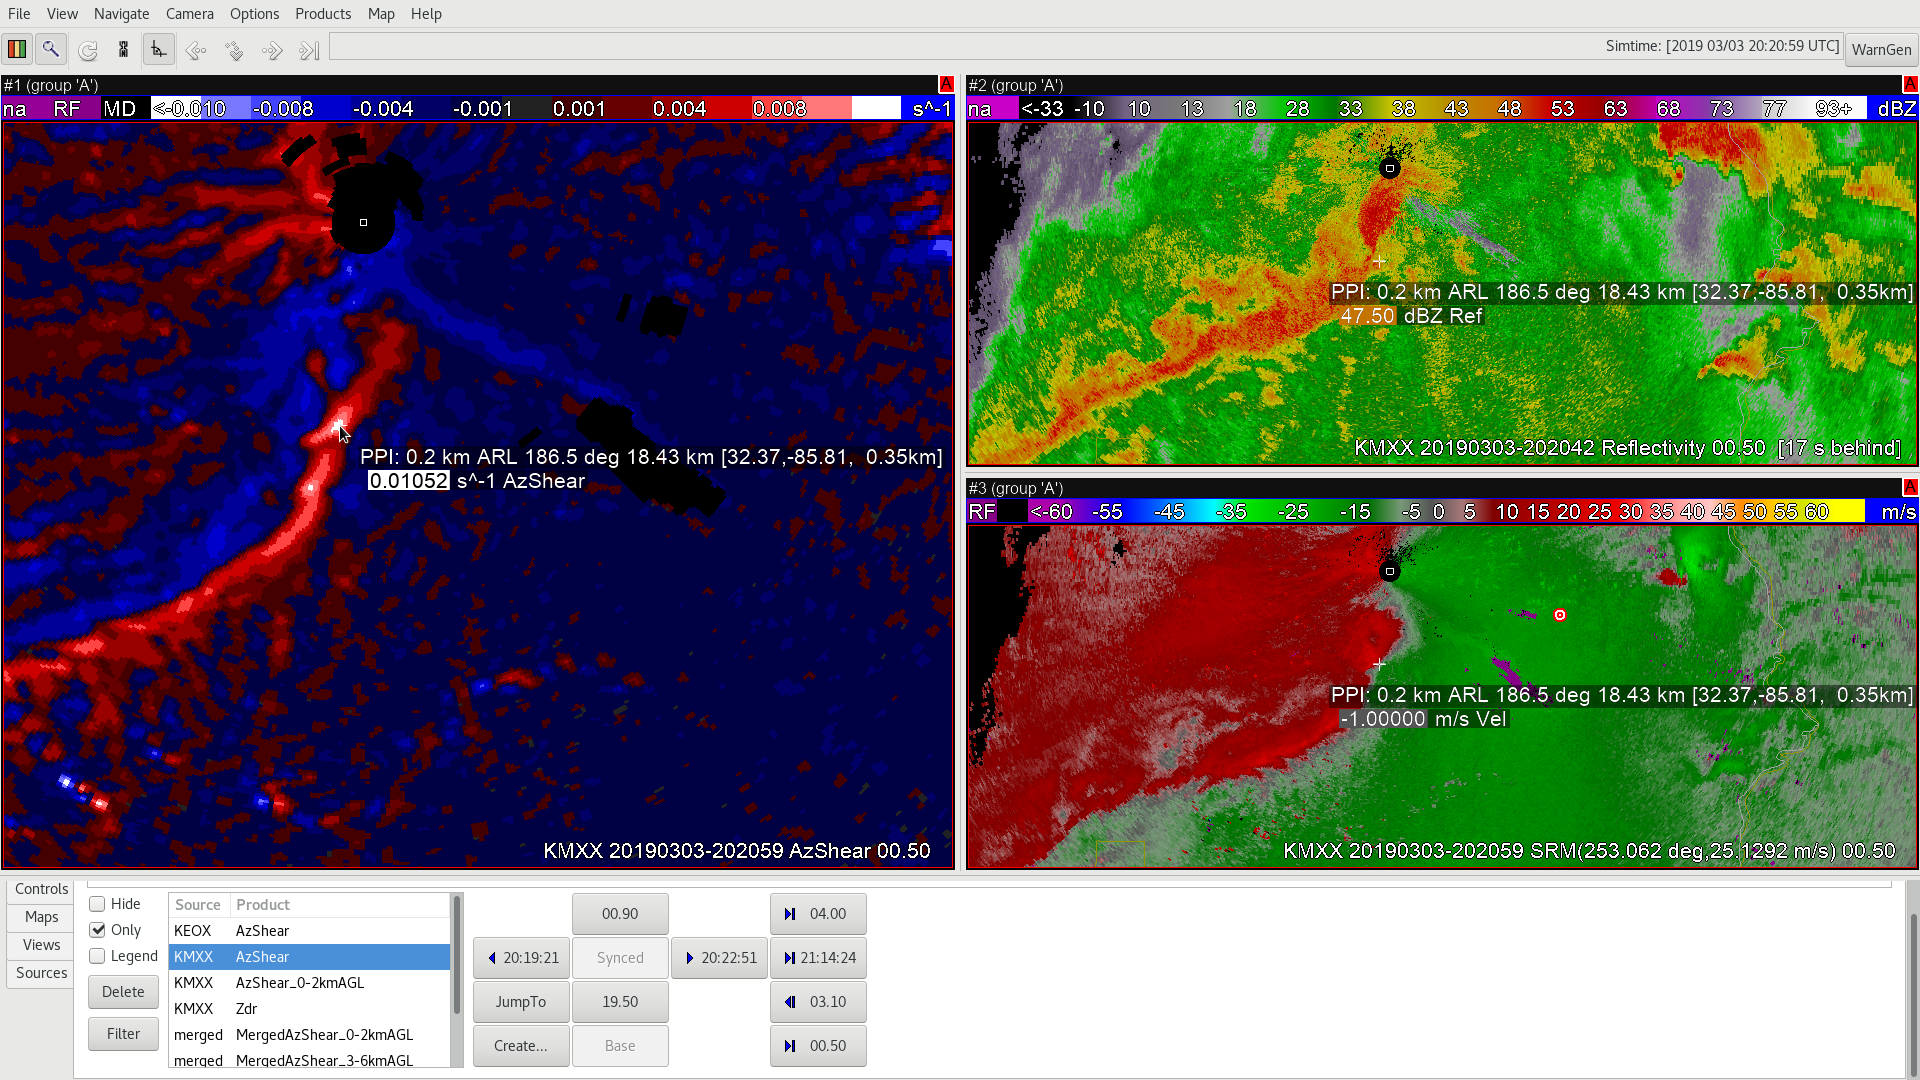
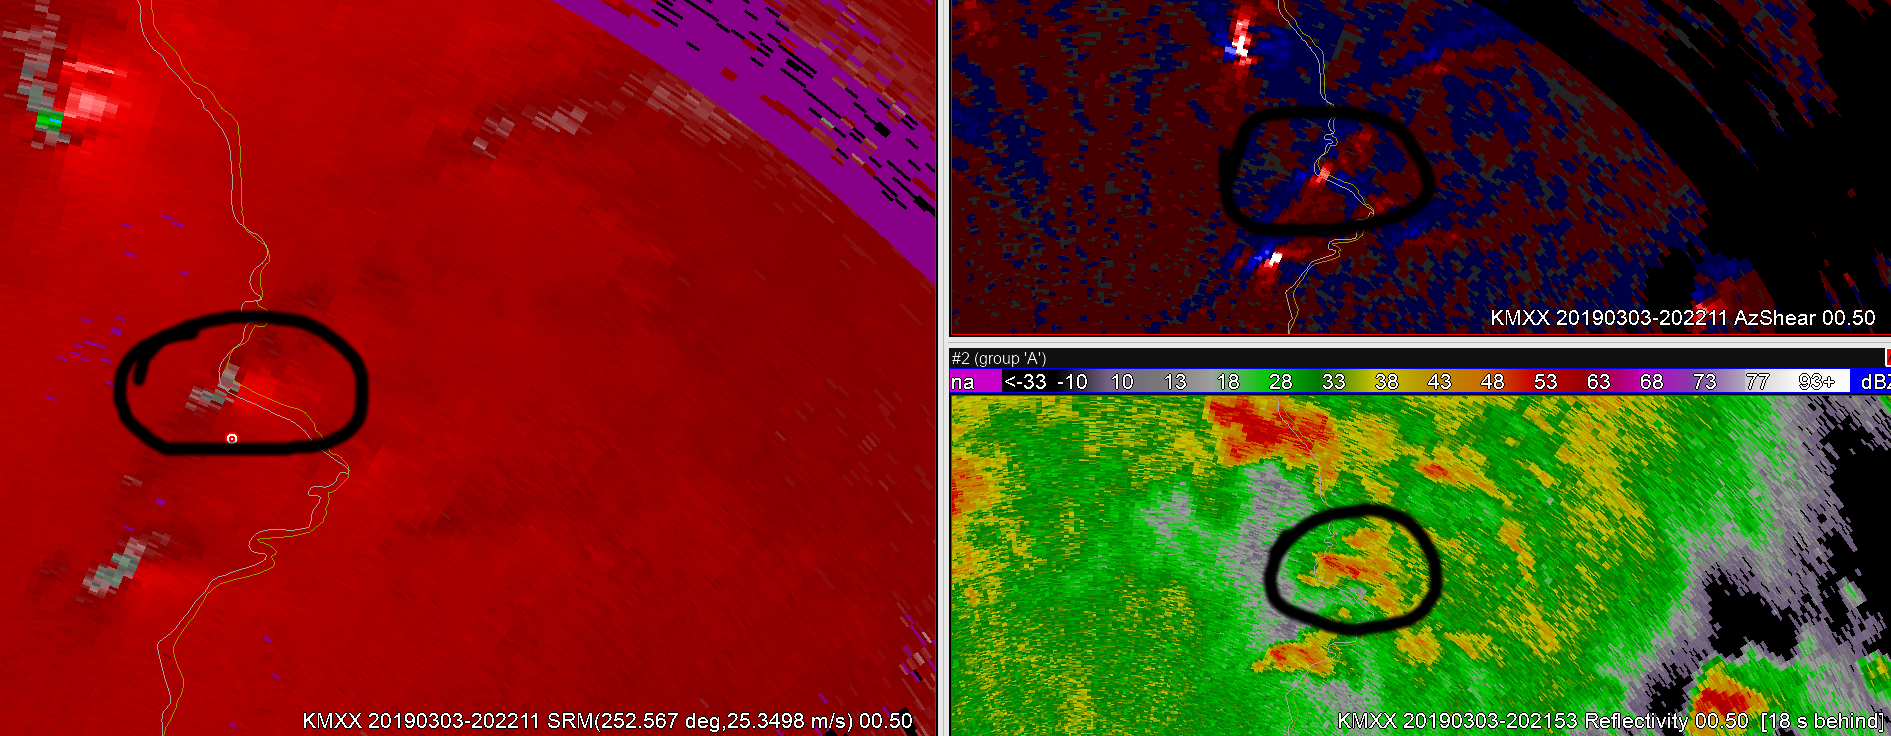
This image indicates high AzShear values in a reflectivity area of concern, but also in an area where velocity values are not overly concerning. As a radar operator, these high AZShear values would tell me to pay close attention to the next several Z/V radar scans.
Tag: AzShear
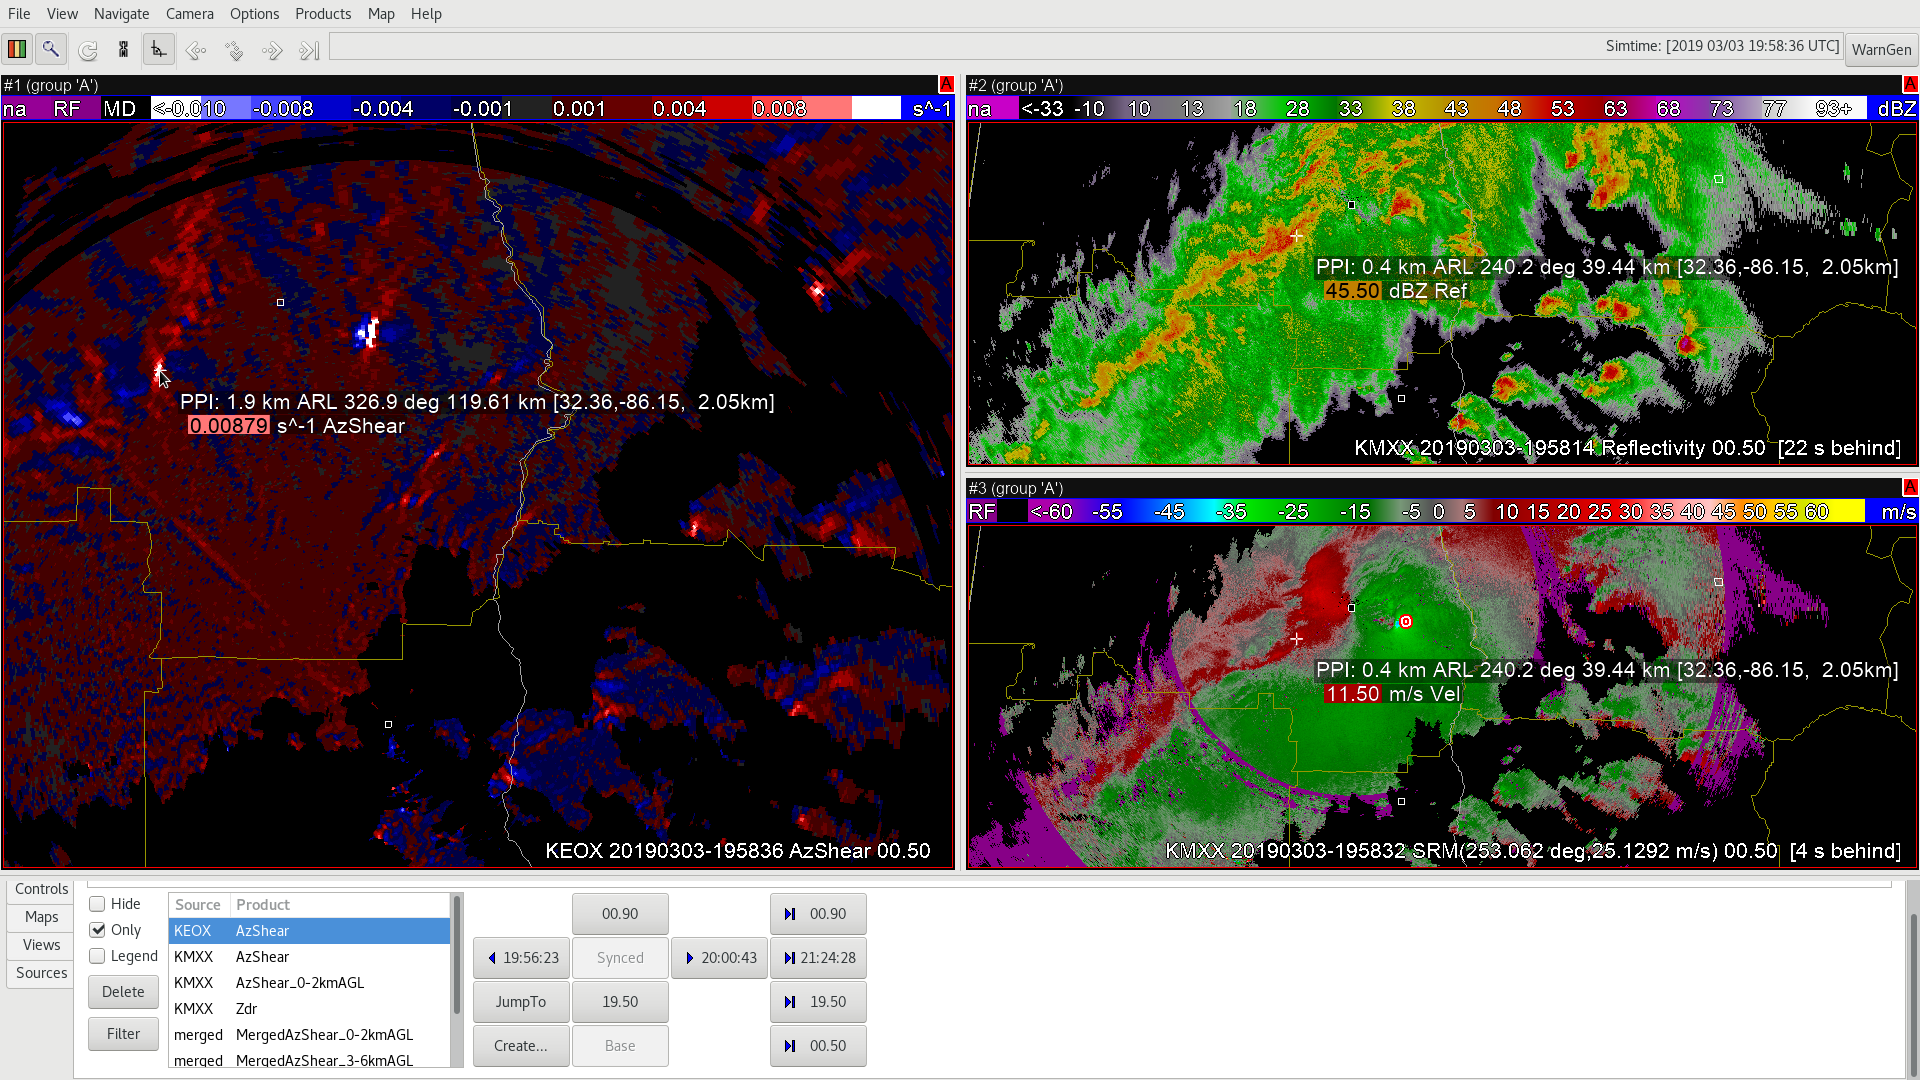
Viewing angle from different radars using AZ_shear is important


The top image shows two discrete supercells in the center of the image. Meanwhile the middle image is from KMXX radar which shows weak/harder to identify AZ_shear circulations for the two supercells. Bottom image is AZ_shear from KEOX that has a different viewing angle that shows much more pronounced AZ_shear circulations. A Best practice…for using the AZ_shear single radar product is for forecasters to use multiple radars for better situational awareness since some radars might not show that strong of a signature compared to others due to different viewing angles. -Jake Johnson
Archive Event – AzShear

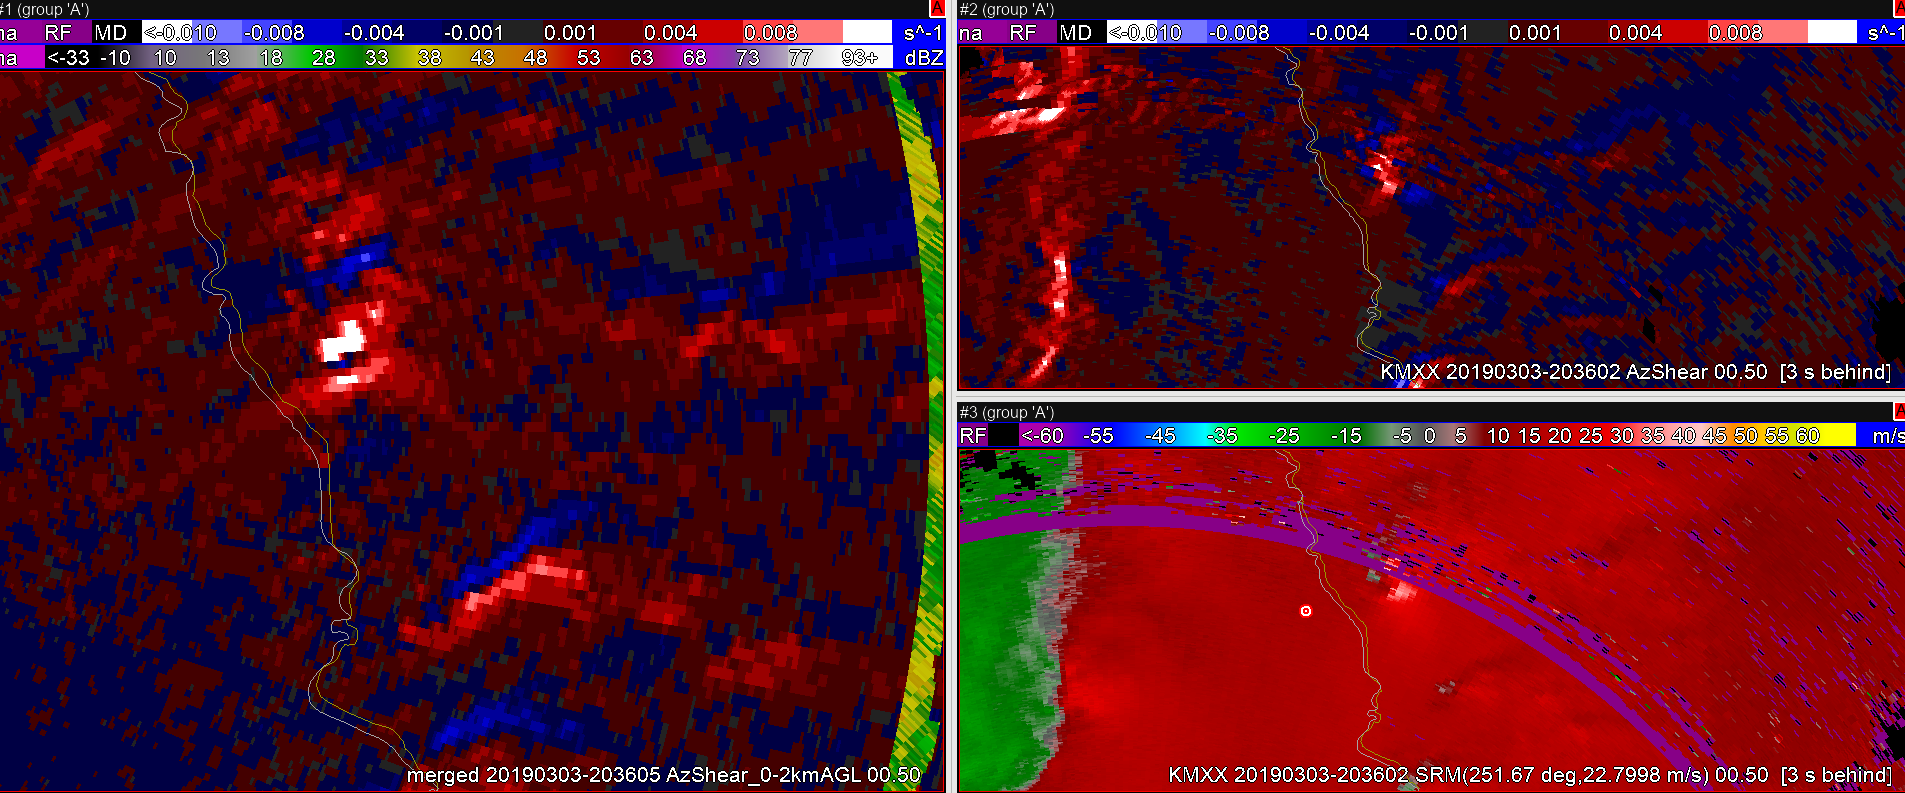
The two images above…KMXX 0-2km AZ product had a bright spot before the velocity couplet developed later on the leading edge of the QLCS which is a helpful pro-active approach to watch this area for possible QLCS tornadic development. -Jake Johnson
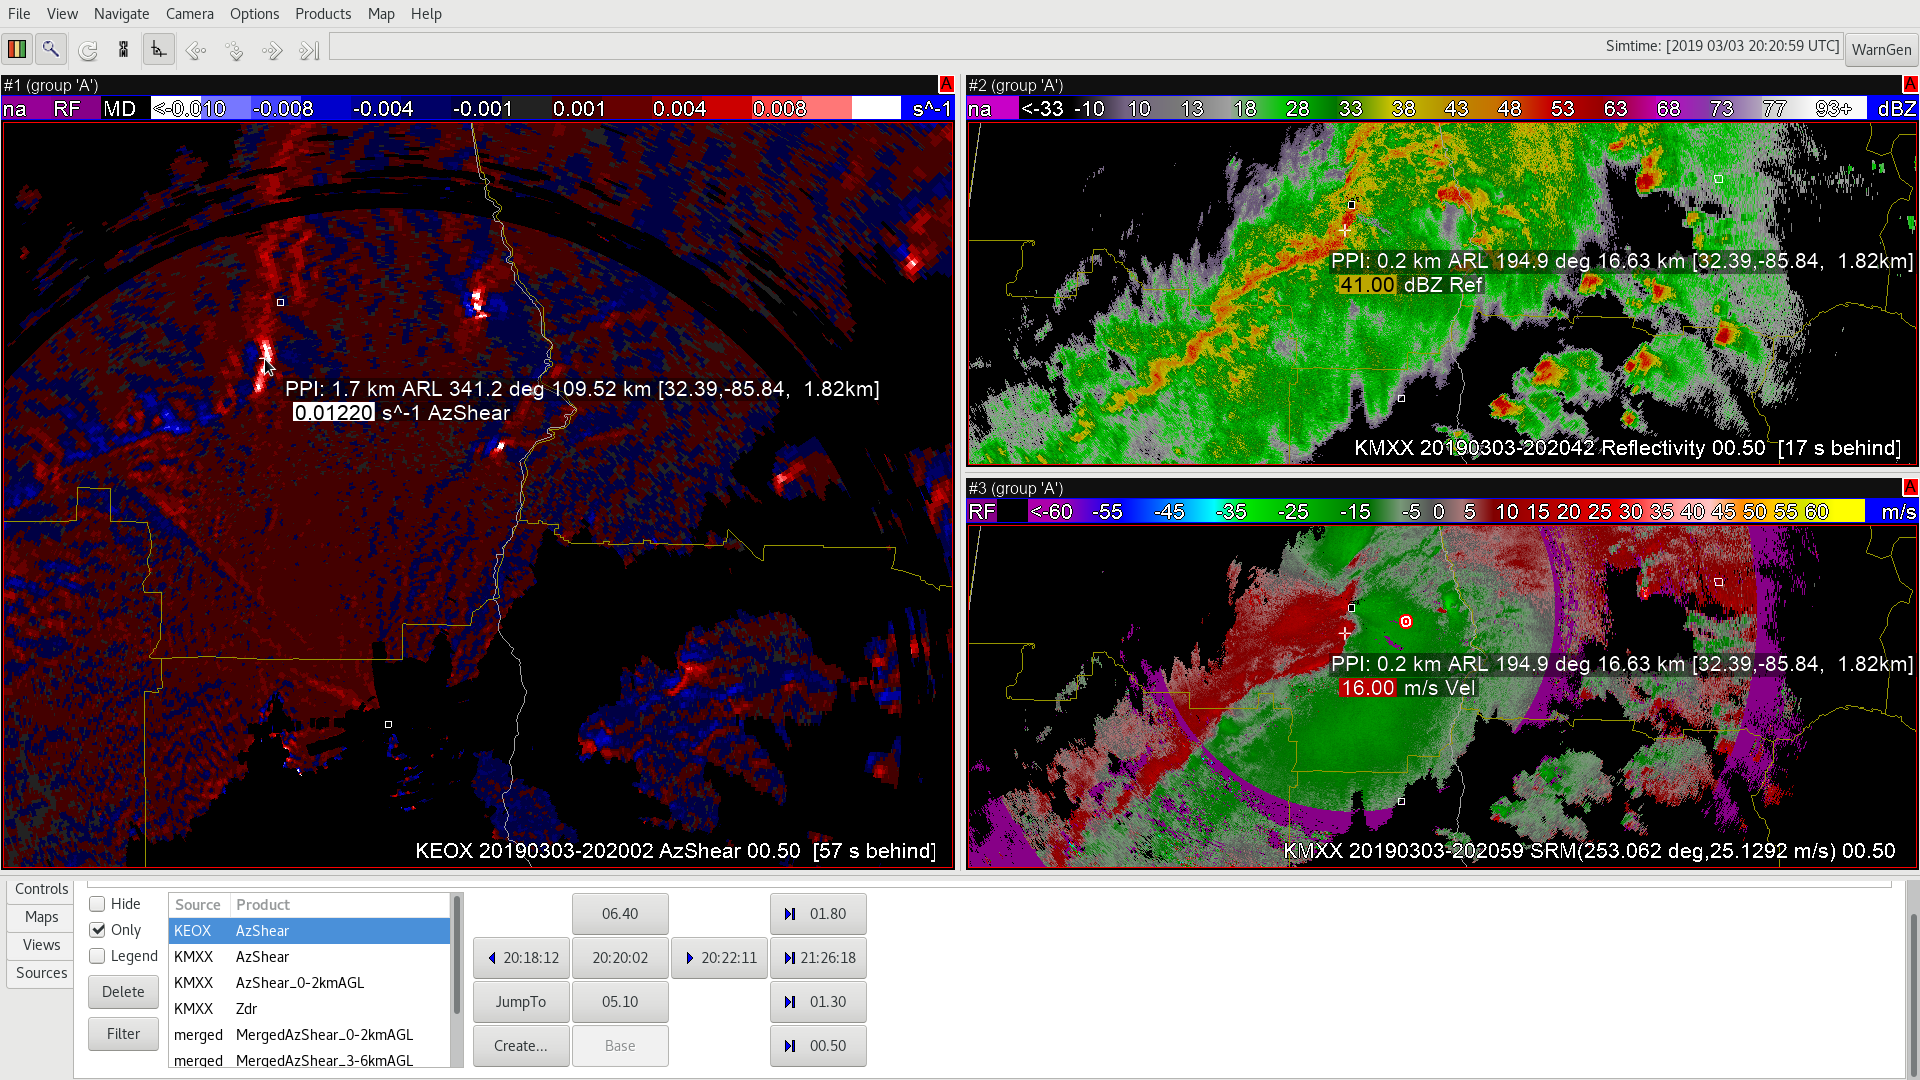
Two images above…KEOX radar had a different viewing angle compared to KMXX and it actually showed a brightness in the AZ_shear product way before KMXX. Its best to look at multiple single radars and look for developing AZ_shear circulations for better situational awareness. – Jake Johnson
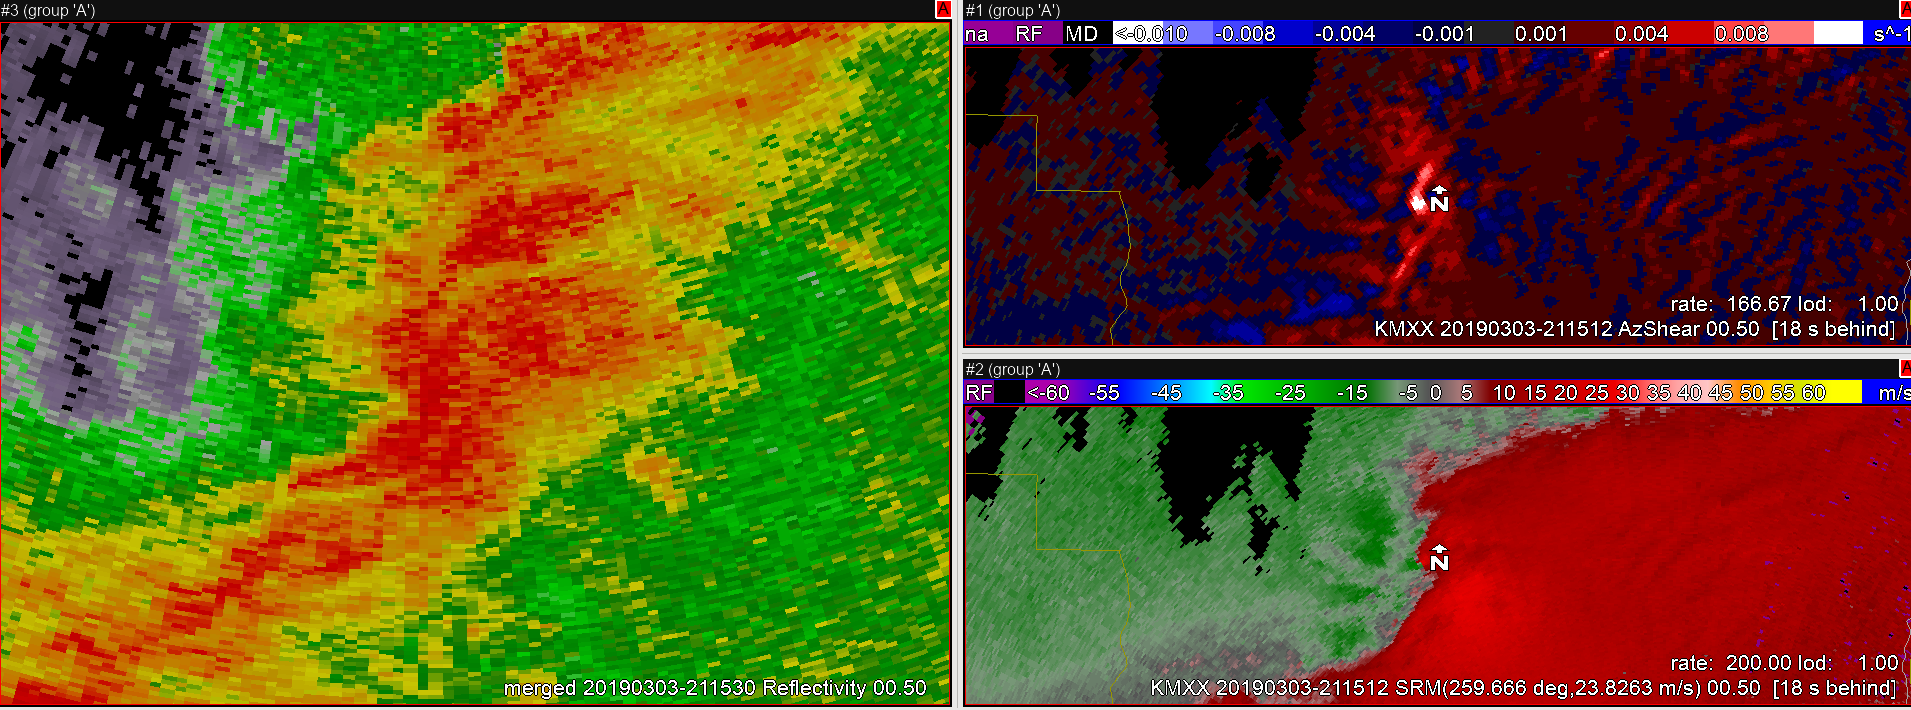
AZ_Shear from KMXX shows developing circulation
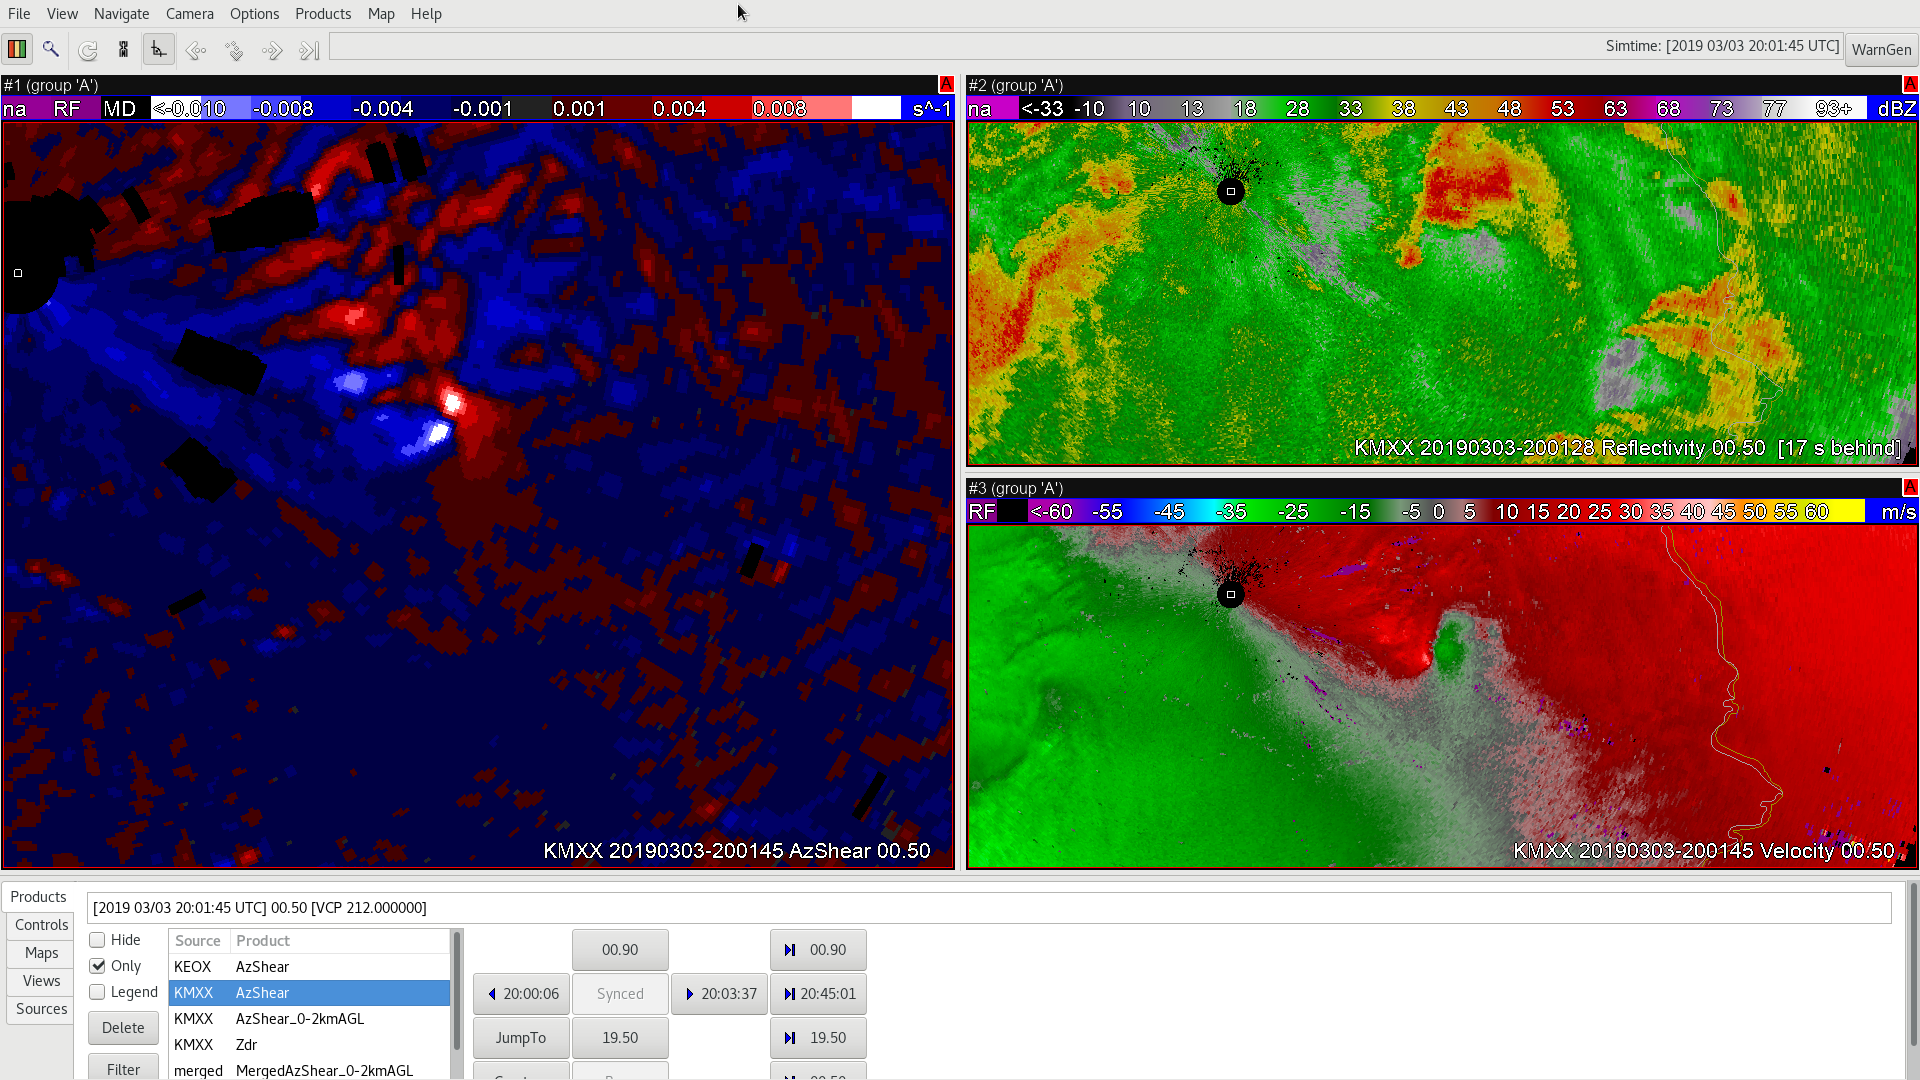
Figure A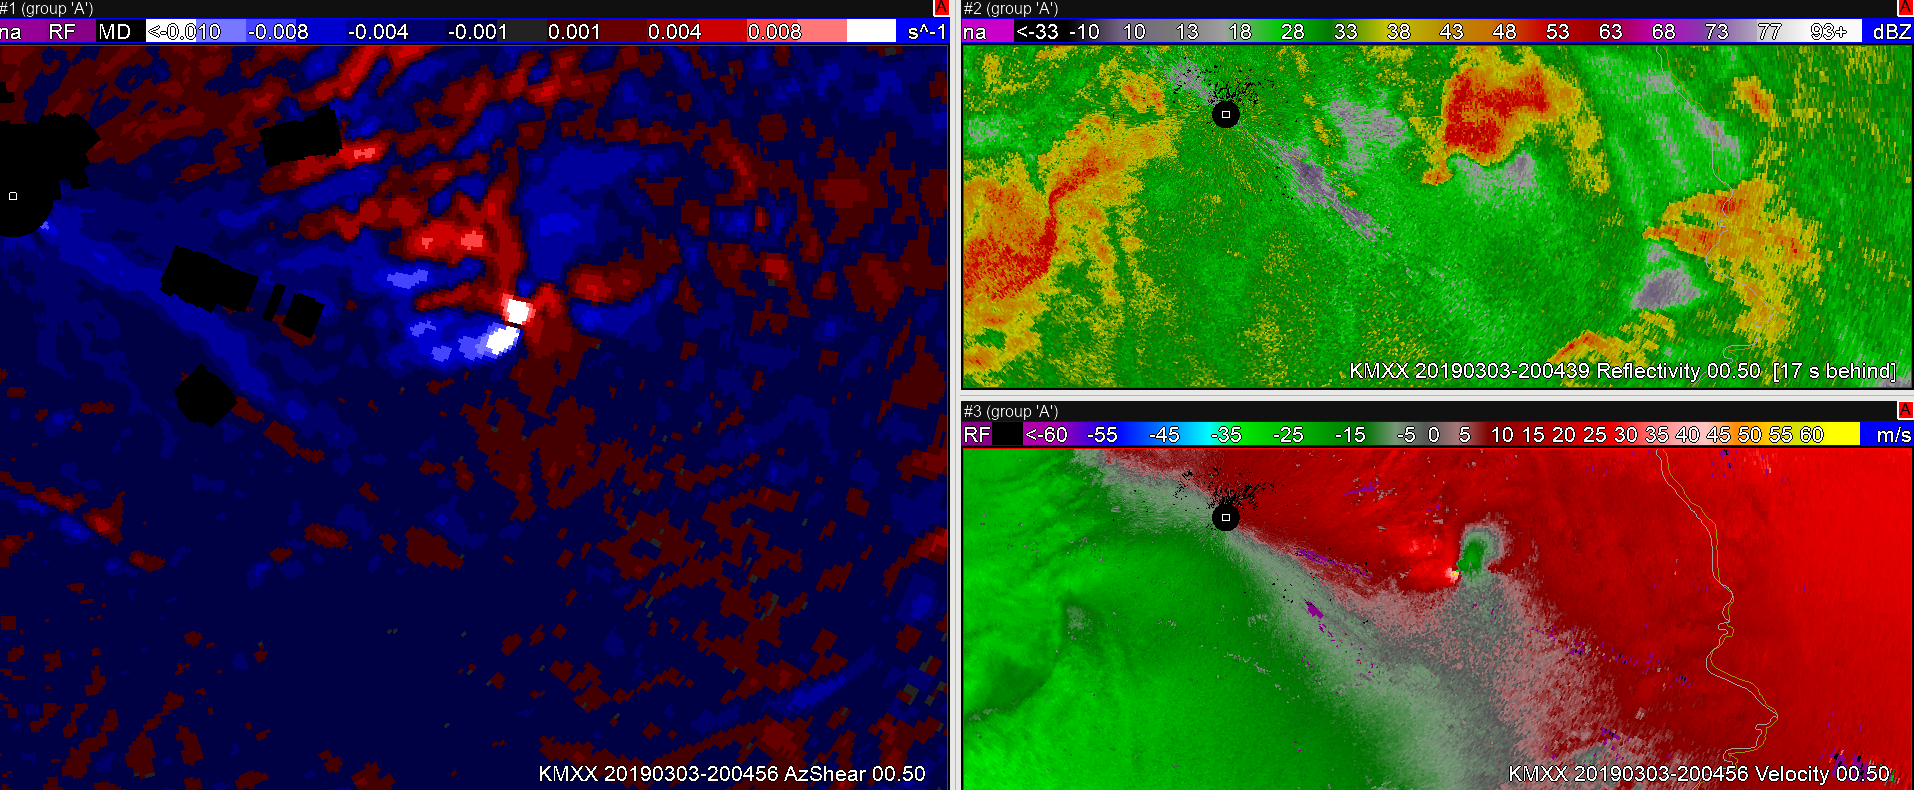
Figure B
AZ_Sheer product from KMXX shows developing shear circulation at max values in same location of zero iso-dop on velocity product at 2001Z in Figure A. Then at 2004Z velocity product shows a developed couplet while AZ_shear remains maxed out but grows in size. The AZ_shear in Figure A had the shear couplets further apart that became closer together in Figure B which is also the same time the velocity couplet first developed. -Jake Johnson
AzShear not helpful in depicting the increasing rotational velocities
Here is an attempt to show how a circulation may evolve over time and become stronger and tighter (increasing rotation rate) however the single radar AzShear does not help the user identify the increase in shear rates. The merged product AzShear was even more nondescript with its weaker appearance of the circulation.
It would be helpful to have some way to better visualize the change in shear over time in the AzShear products, either with a trend line or a different color curve.
When we are making warn/don’t warn decisions, changes of just a few kts rotation velocity may tip the scales, the AzShear product as it is now does not provide the resolution/detail for these changes.


SRM – 2122, 2124, 2126, 2128 UTC


KMXX AzShear (Top), Merged AzShear (Bottom) – 2122, 2124, 2126, 2128
— SCoulomb
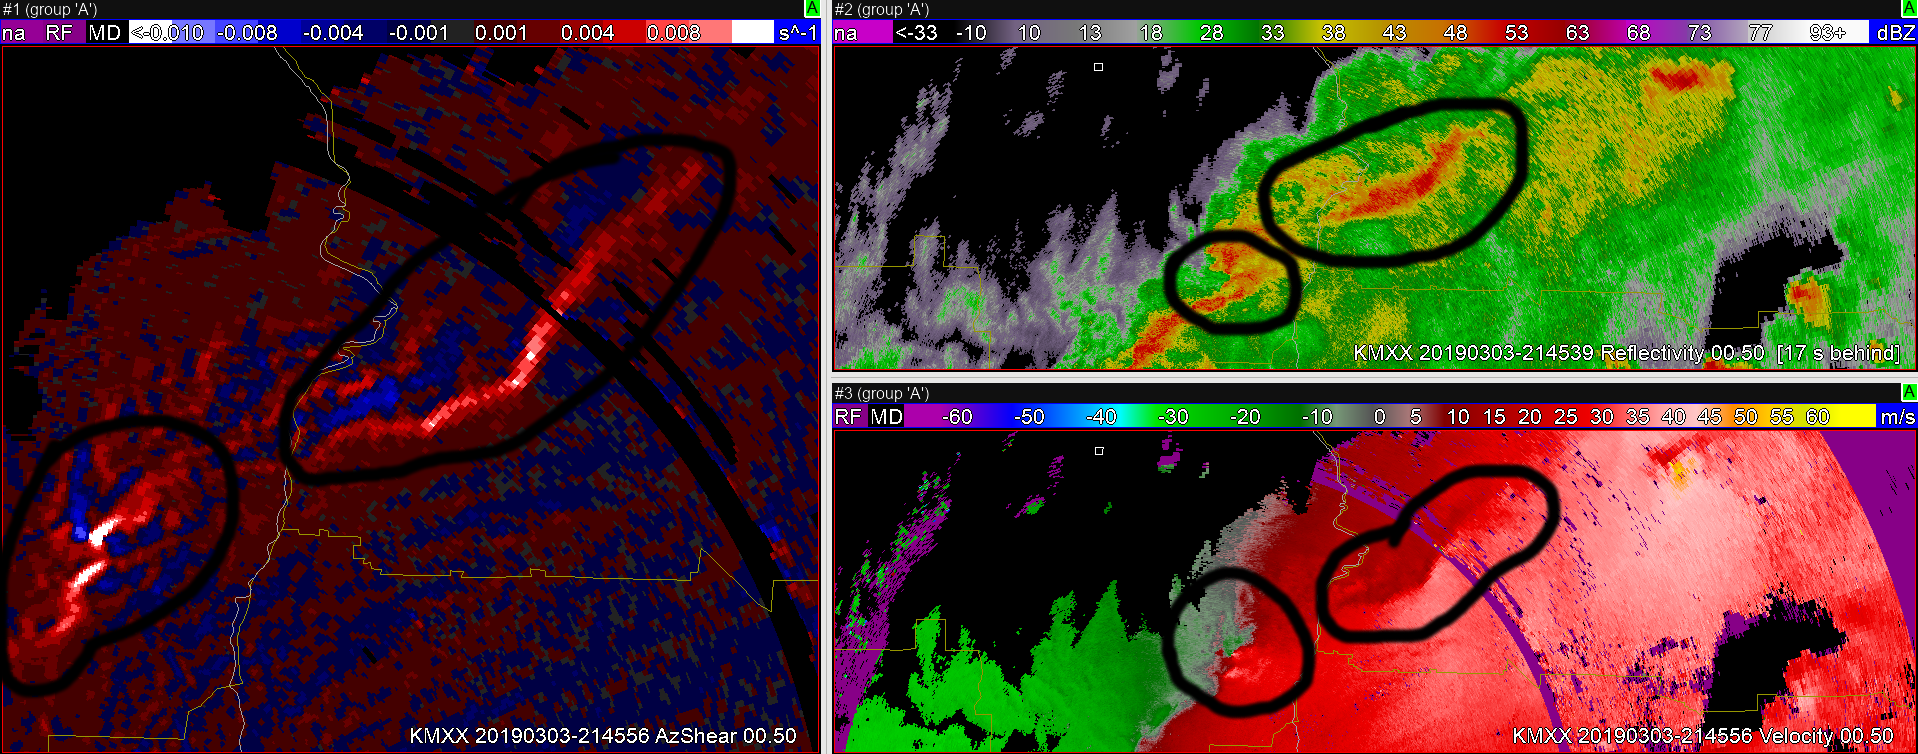
AZ Shear Final Thoughts
Ultimately, AZ Shear has a lot of potential value in warning operations. It is really good at highlighting areas that need immediate investigation. Notice in this case how AZ shear maxima are present along a segment of the the storm that has begun to bow. Additionally, it has highlighted an area of rotation along the QLCS. Within a warning environment, I could foresee it increasing lead time on warnings because your attention is gravitated immediately to specific areas of AZ shear maxima. One thing I think would be of great benefit is making some of the az shear values closer to zero transparent, so that it can be easily overlaid on velocity products. In this case, I would also recommend using a different color scale than red because it will end up blending in with the velocity data.
South Beach
Quick ID of QLCS circulation by AzShear
Single radar AzShear may be a game-changer for identifying the quick mesovortex spin-ups along a squall line. QLCS events remain one of the most challenging for radar meteorologists and any help in identifying these features could add needed lead time and/or confidence to the warning decision. Just being able to discriminate which circulation is most intense along a line would be sufficient argument to move this product into operations but the added benefit of early identification and consistent tracking of these features should get the attention of decision-makers.
— SCoulomb
Layered AzShear troubles with Sails
Although SAILS scans are great for base data interrogation, it does cause issues with derived products such as the layered AzShear from a single radar. Here both the 0-2 and 3-6km products have previous scan data still present. This caused the AzShear feature to “split apart” while the circulation itself remained in tact. This seemed to be more of an issue with the 0-2km product but also impacted the 3-6km one.
For some forecasters this may not be a big deal at all but for others having to process in their mind what is going on with the product seemingly split a circulation for no reason can really throw them off or cause unneeded mental anguish (as minor as it may be). In a highly stressful situation such interruptions can mount up over time increasing fatigue or cause forecasters to no longer consider looking at a particular product. I have seen some even turn off SAILS by default so they don’t have to deal with the idiosyncrasies it may cause. This could reduce lead time or cause someone to miss an important feature for “convenience” sake and not for some other valid reason.

— SCoulomb
Azimuthal Shear Application to Velocity Couplet?
An application of AZ-Shear that may show some promise is that it seems to hint at storms/areas which may develop into a velocity couplet. In this example you can see that high Azimuthal Shear values are beginning to be detected by the program, while very little response stand out in the velocity field.
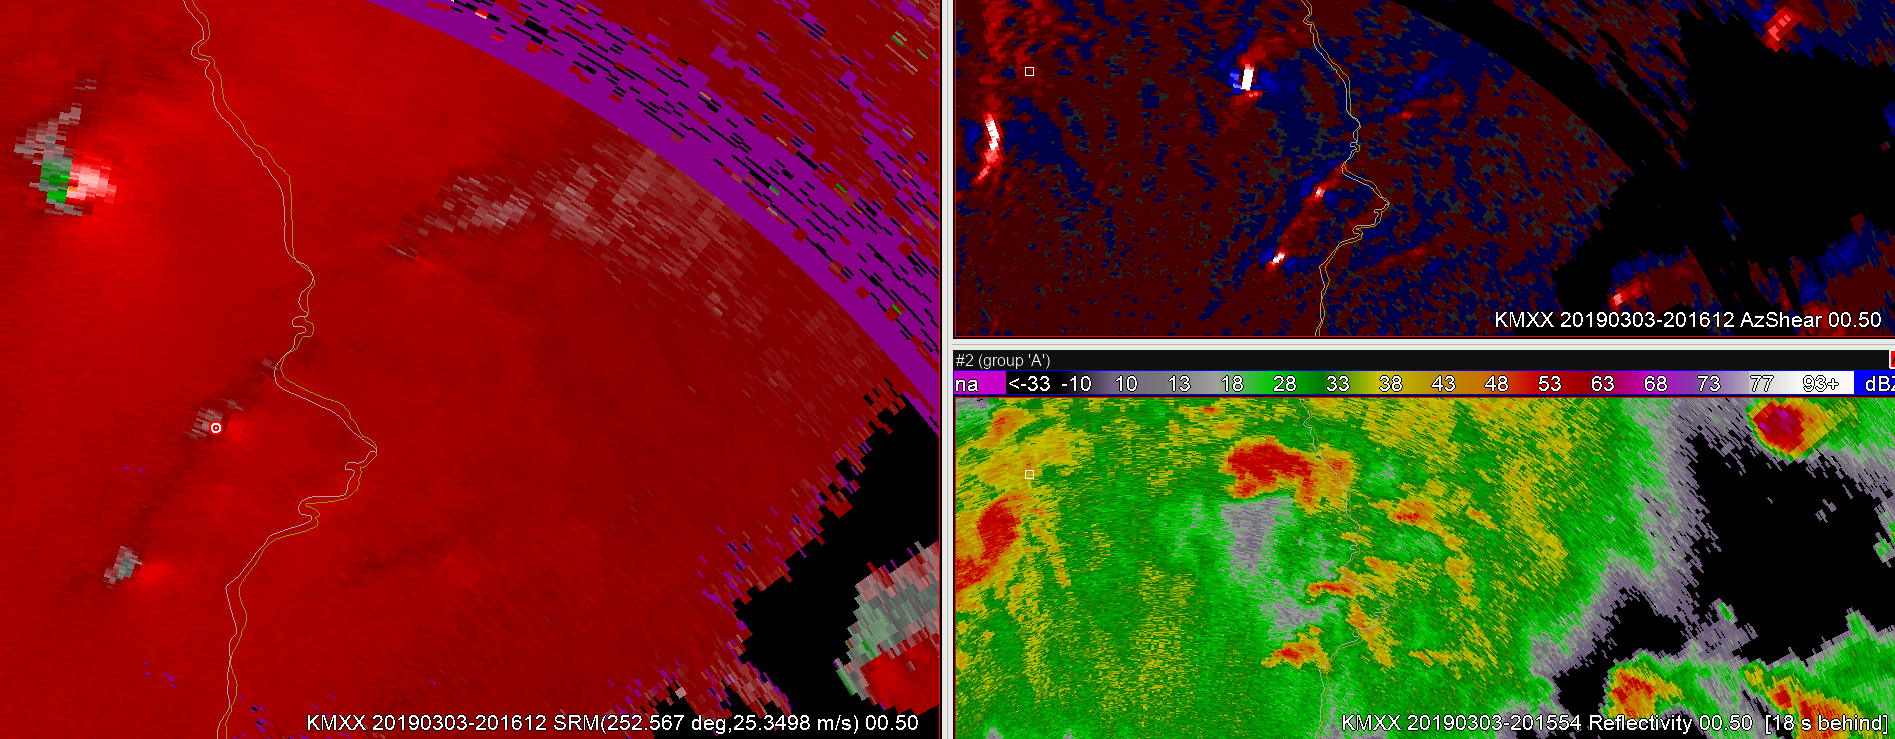
Notice how a few minutes later a velocity couplet is beginning to form, when only a few minutes prior AZ Shear was the only indicator. If this becomes is a trend that develops, it might be able to increase warning times on tornadoes.
South Beach
Merged AzShear for the win!
As the circulation moved into the Range Folded area on KMXX, the merged product was available to continue to track the strength/position of it. Even though the merged product showed multiple circulations on previous scans it was still possible to track the shear values through the time the storm of interest was in the Range Folded area which would help with messaging or product updates.
— SCoulomb