Lower Max Values for Gridded LTG Data in West?

As expected, the max value on gridded lightning data will likely need to be location specific and might even need to be adjusted based on time of year or even type of storm to better visualize storm trends. I can see how this would quickly become complex and would require local research that might only be done at offices with someone interested in ltg data. Regardless, as has been discussed ad nauseam, changing the max value needs to be easier for forecasters. Simply adjusting the color map is not a long term fix!

300 Max
300 Max Value
50 Max Value
50 Max Value
Tags: None

First DTA over PIH

Finally got a cell to exceed 25 flashes/min (only lasted for a minute or two), which triggered a DTA (since there is a lower threshold in the west).

DTA

At the same time, ProbSevere was near the highest we had seen all day at ~36% with MESH of 0.83 in.

ProbSevere

The OT algorithm also began to indicate a possible OT with the storm at roughly the same time.

OT

Hard to say which of these products was the first to key in on the intensification as they all started showing signs at approximately the same time. However, the lightning time series does show a rapid increase just prior to 2245 (lightning jump?).

TimeSeries

Issued a SPS based on the experimental products and base radar data.

Ertel

Tags: None

Lightning Data, Alerts Comments

Monitoring the ongoing thunderstorms, Earth Networks continue to supply helpful lightning data.  This is a good supplement to watch indicating future thunderstorm growth or at least some pulsing. The lightning flash data drops out, much like a missed satellite frame. Interestingly enough, there are a couple other troubling notes. Multiple lightning lines (streamers of history) are located in the same circled area. What exactly does this mean to the forecaster? Additionally, four areas inside the circle are showing flash rates above 25 strikes per minute. It is confusing to an operational forecaster and takes time to interpret data that should be straightforward. The display has to be massaged to increase ease and usability. At 2315z there is a circle inside a circle…. and a dangerous thunderstorm alert inside a thunderstorm alerts.

UFFSU

EN Circle in circle

Tags: None

LMA detection before ENTLN?

Switching to Colorado, there was a storm that the LMA picked up on while there were no ENTLN data and a scan later only a few…

This is from 2303Z where the LMA was picking up on something.

2303Flash

Then at 2308, the ENTLN data is finally picking up on “something.” It is really hard to see in this degraded image but there is one negative CG strike and then 3 “pulses.”

2308lightning


I usually see “some” in cloud lightning before I see any LMA detection so this was interesting to see especially with such a weak cell.


Lauren13

Tags: None

More CI Detection

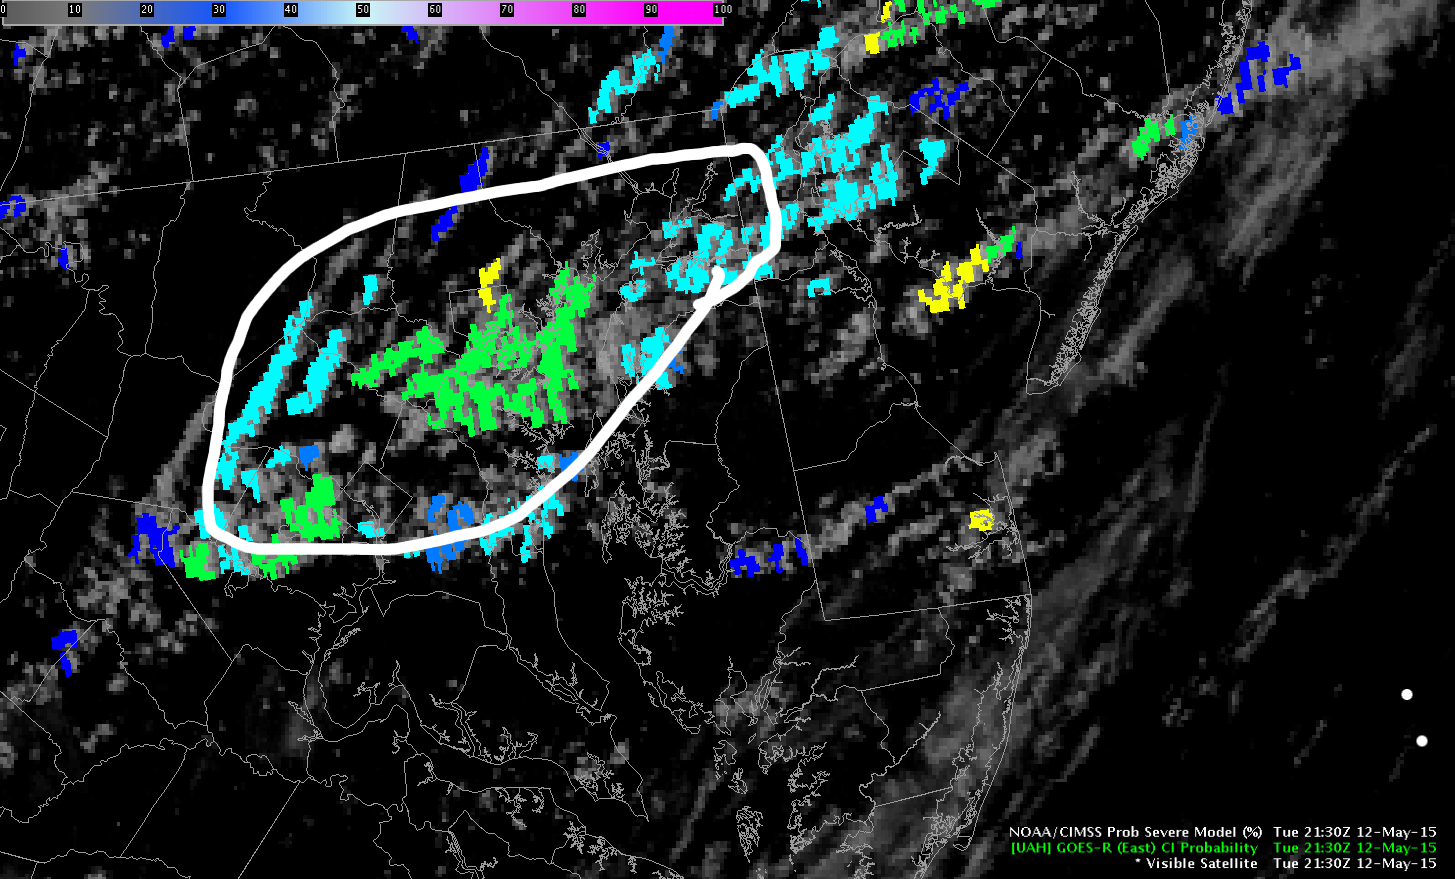
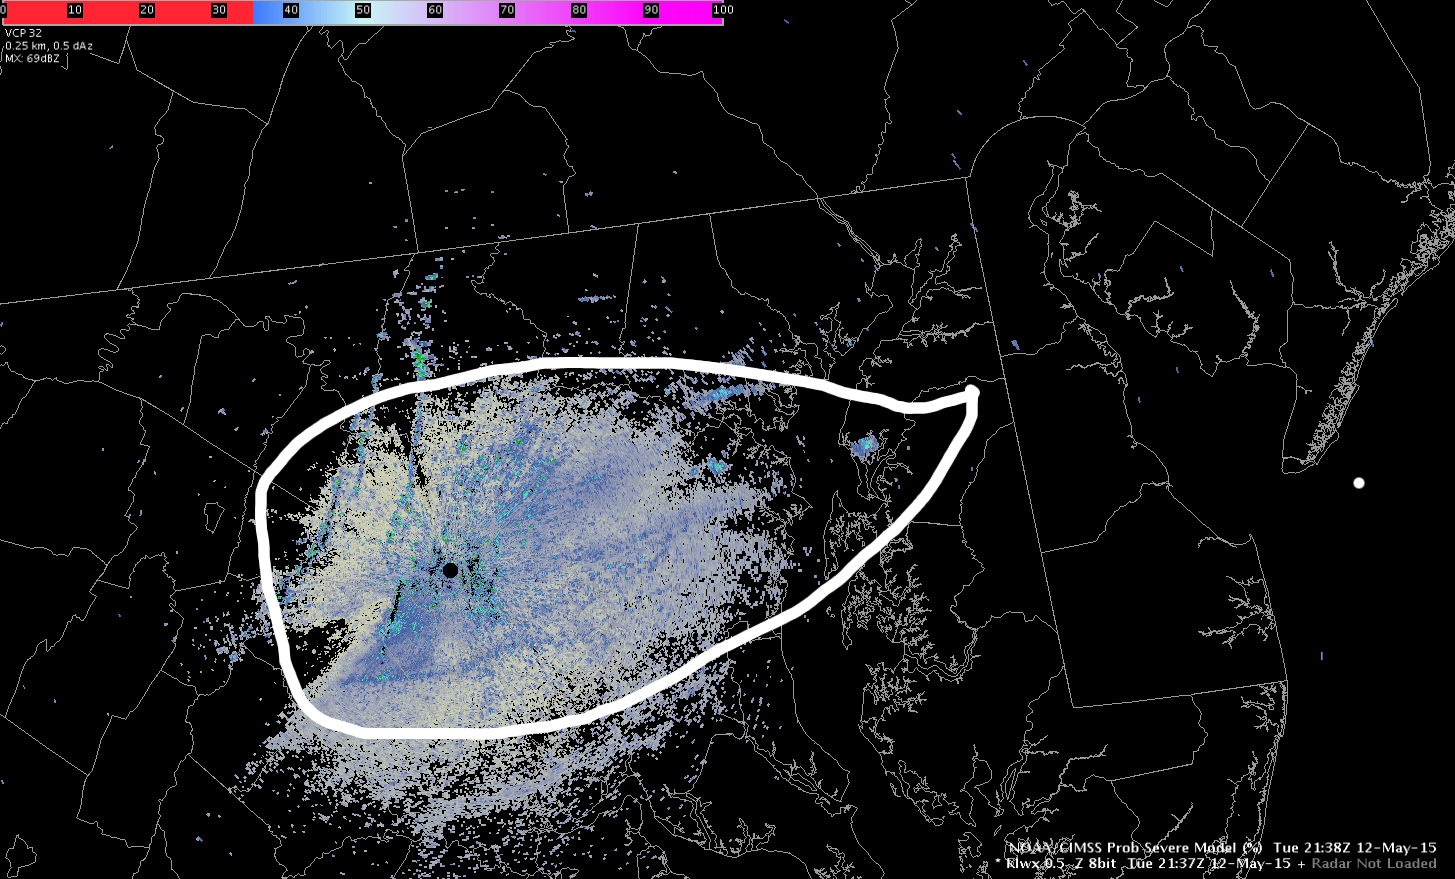
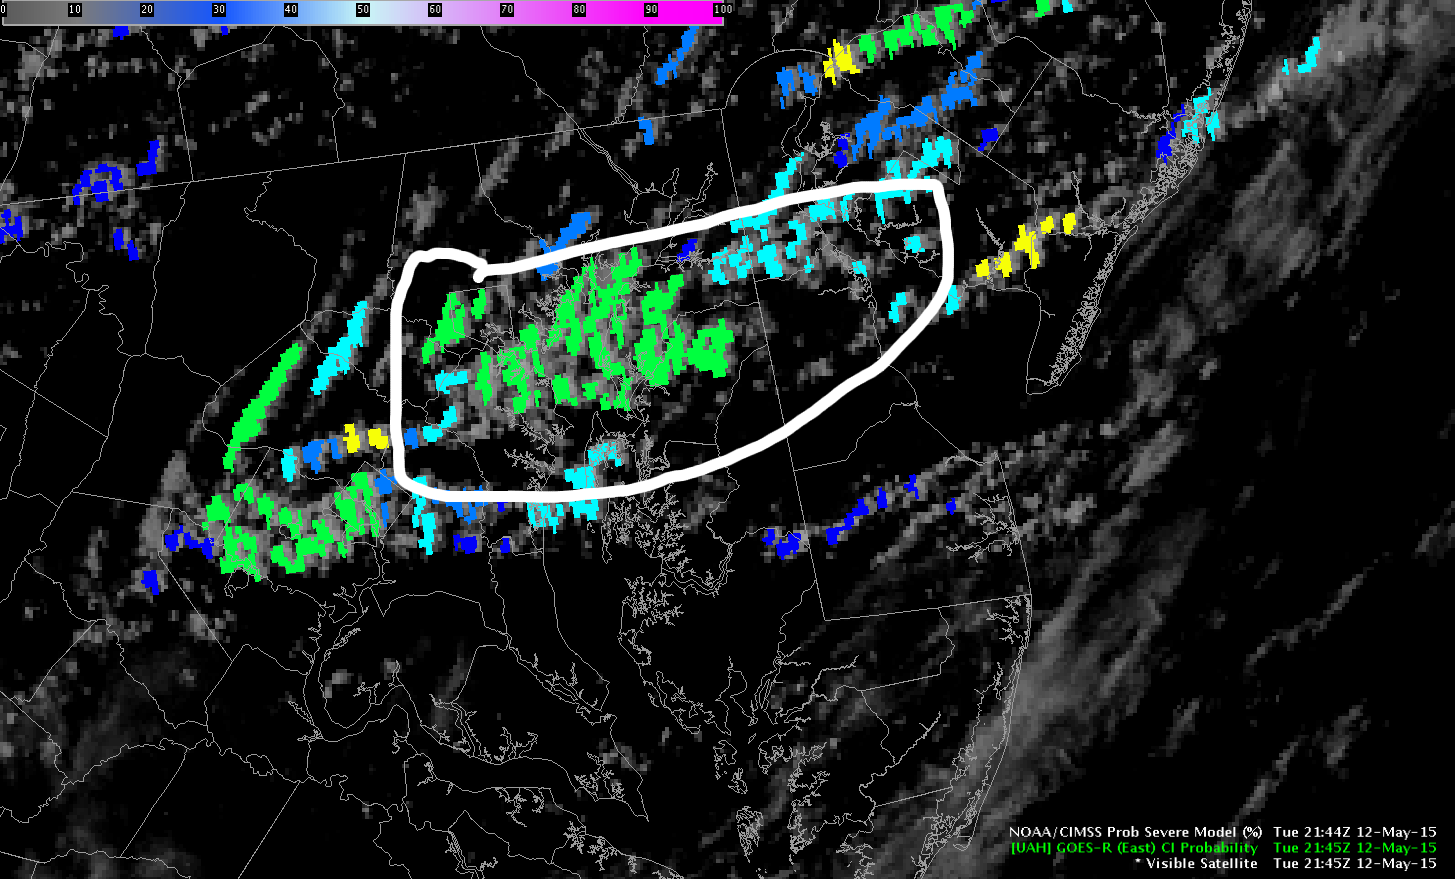
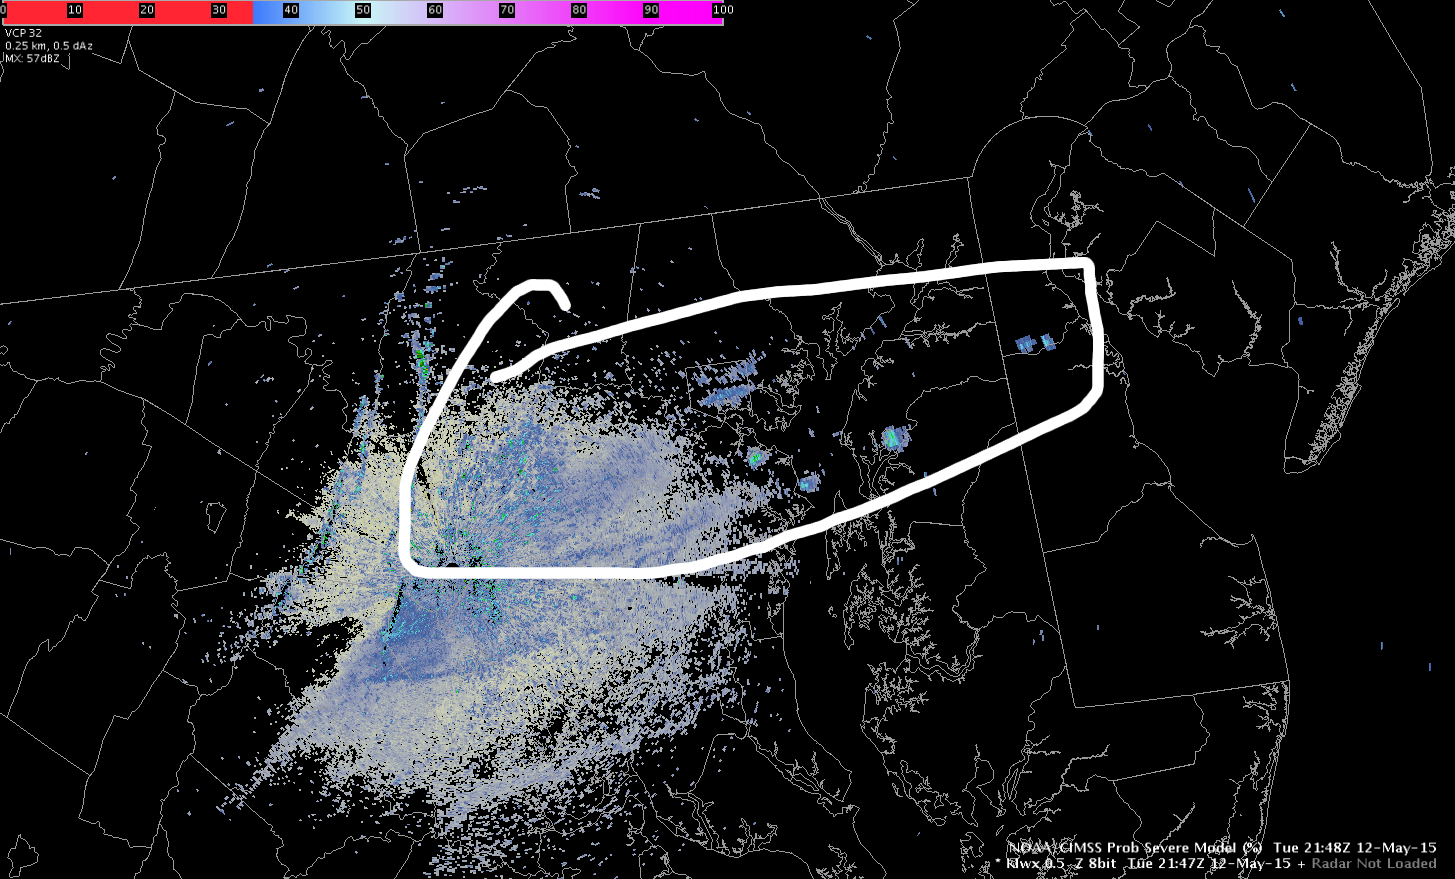
Here is another set of images showing some shower development (there is no lightning).

2130Z CI product

2130CI

2137Z Radar- not much to see, maybe “a” shower.

2137radar

2145Z CI product- the highest probabilities have moved east

2145CI

2147Z Radar.

2147radar

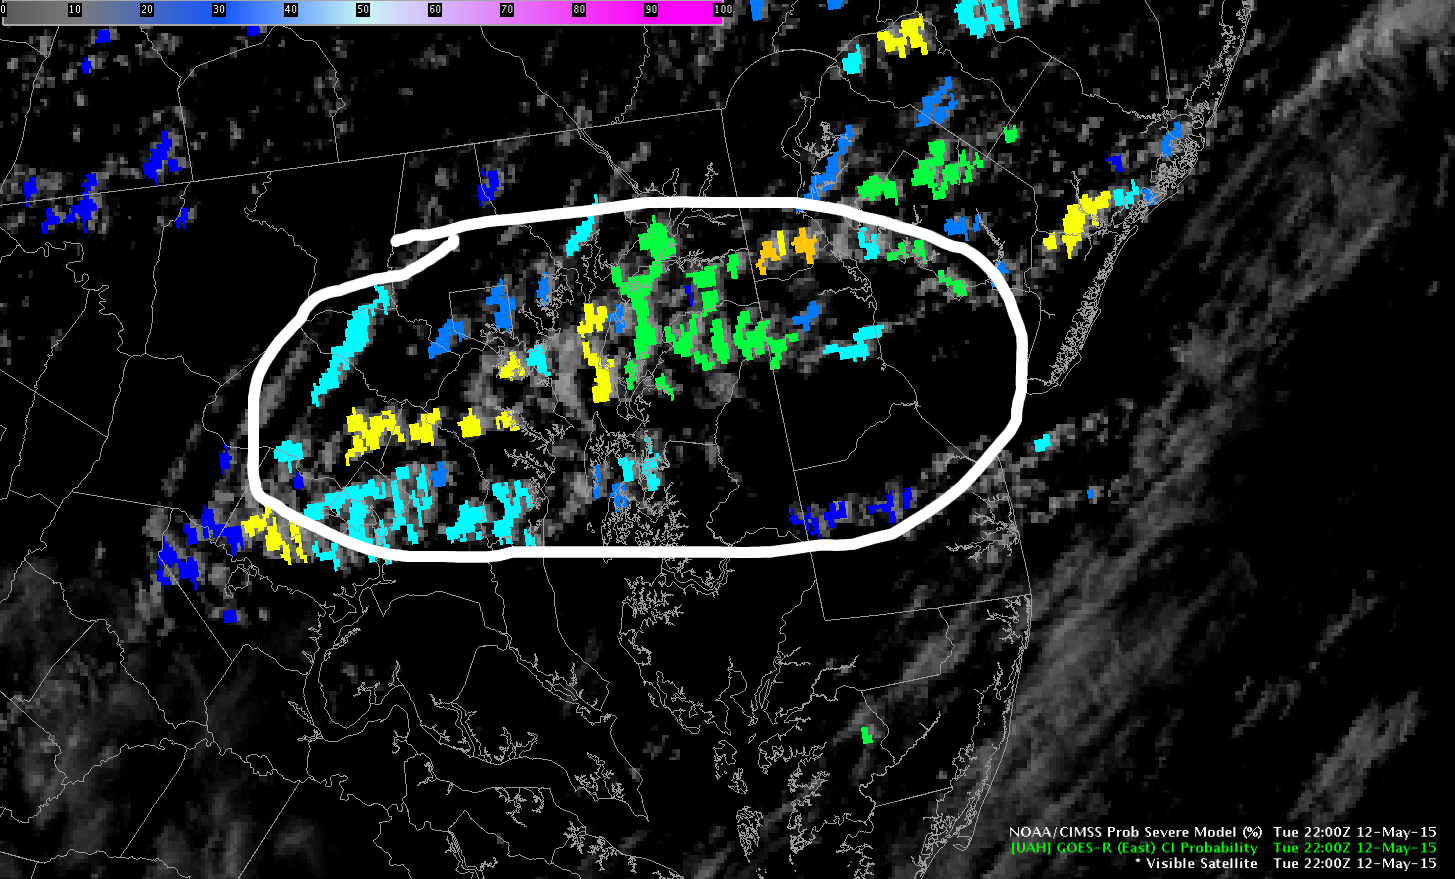
2200 CI has increased in some areas. The yellow is over 60% while the green is 50%

2200Sat

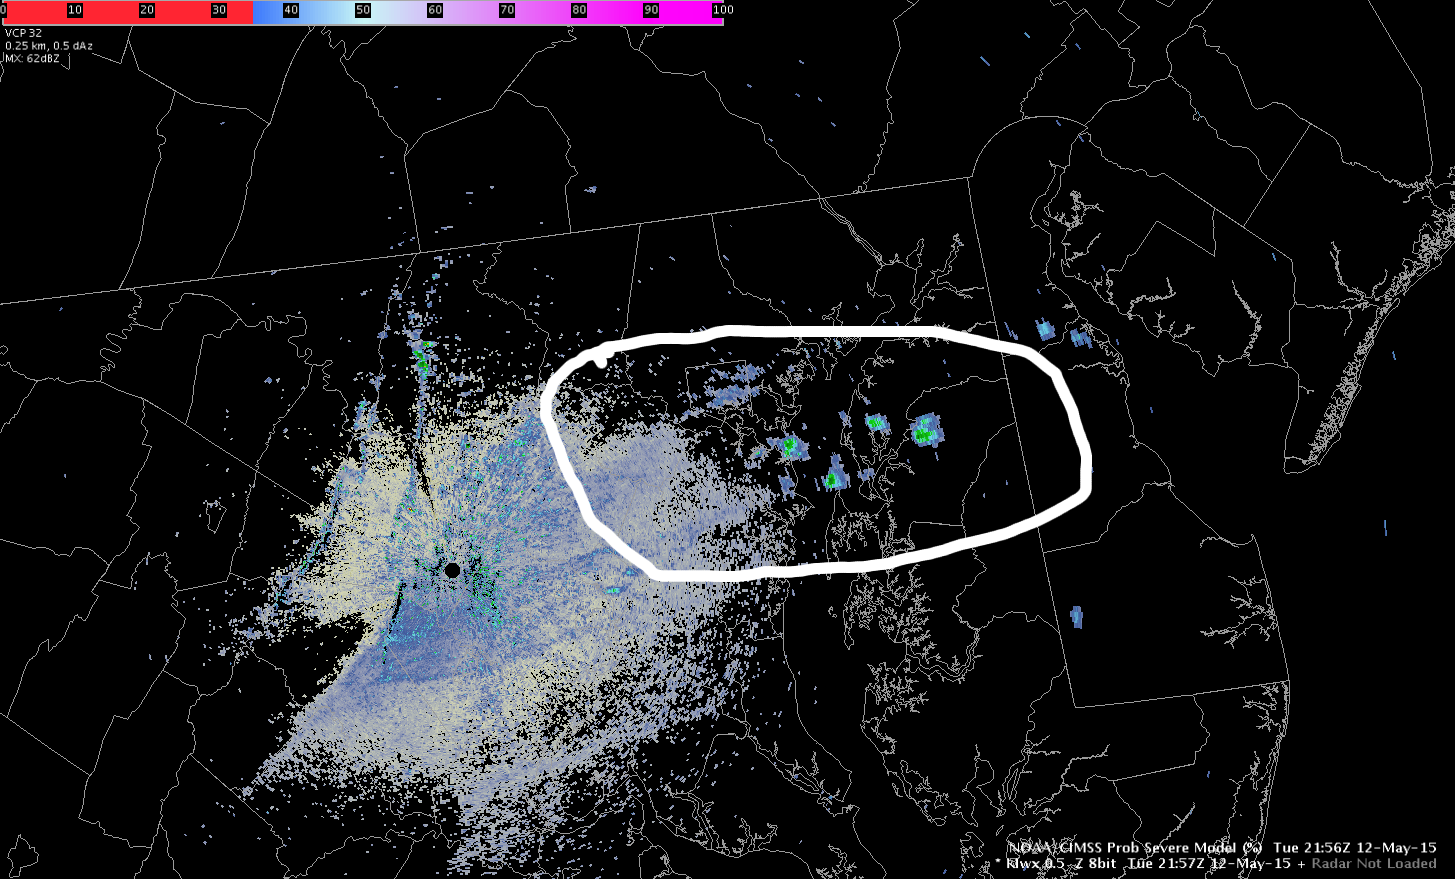
2156Z radar is showing some shower developing

2156Radar

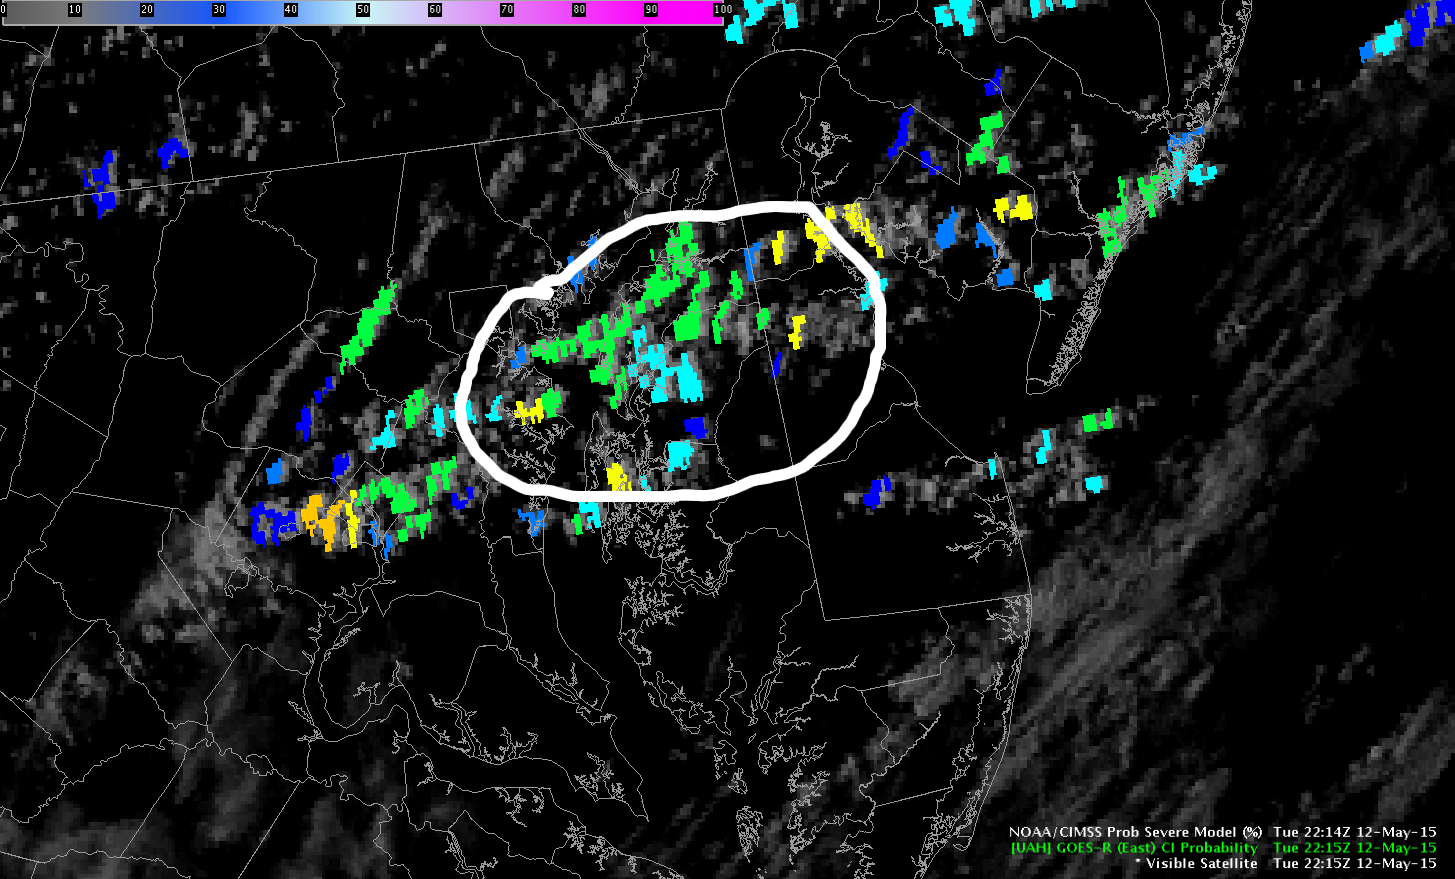
2215Z CI…still showing moderately high probabilities

2215sat

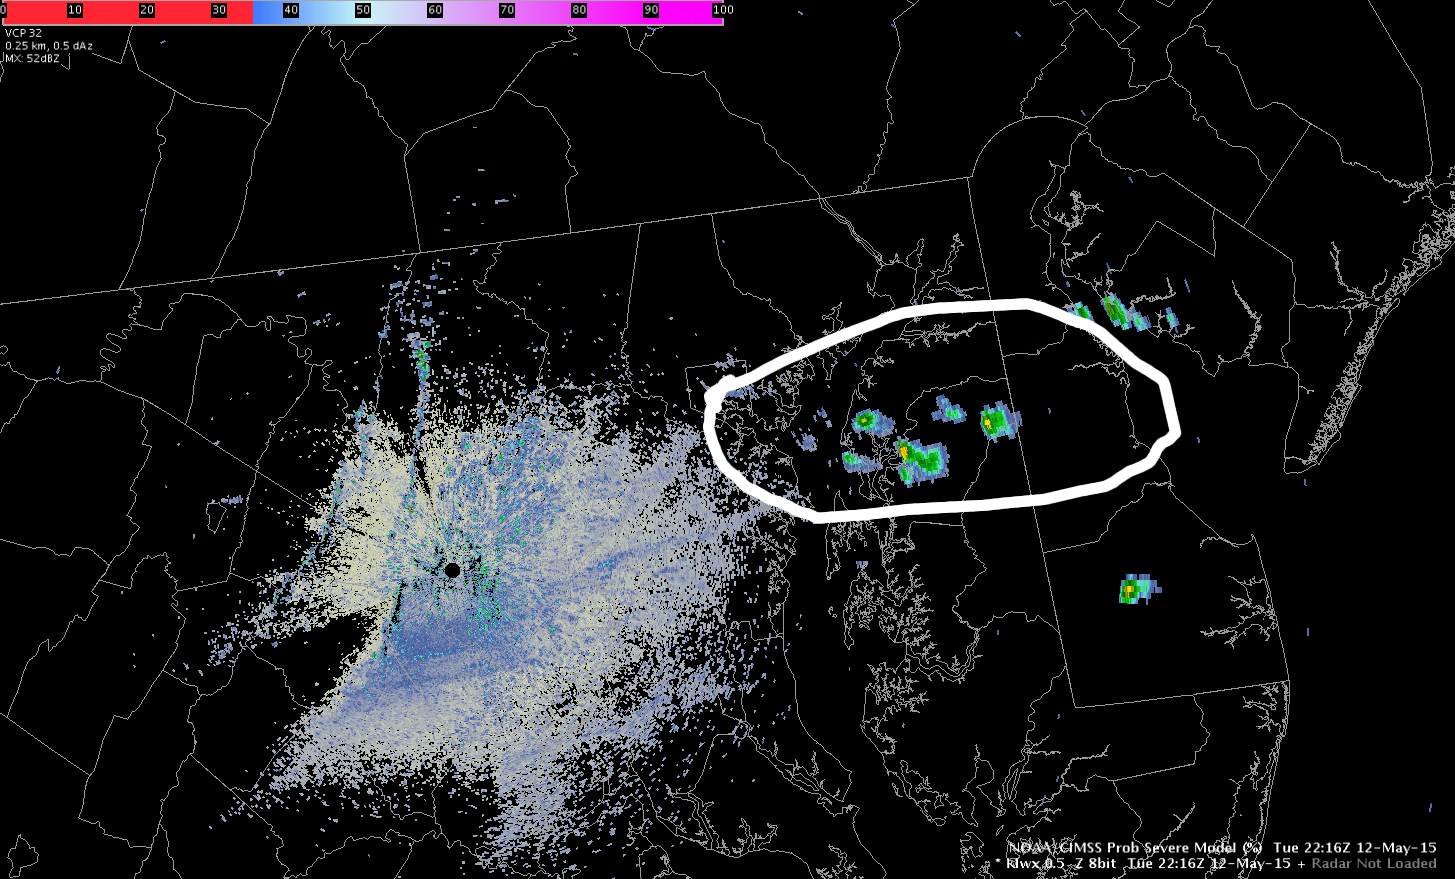
2216 radar shows more showers

2216radar


What is interesting about this example is that even when showers started showing up, even some that are near or above 35dbz, the CI is still picking up CI’s on it. This is likely because the CI product actually stops at a certain glaciation rate which is roughly equal to 35 dbz. So CI doesn’t “know” about the radar and the dbz levels. It just shows that even though CI may still be showing probabilities, there could still be something on radar.


Lauren13

Tags: None

Prob Severe vs. Tstorm Alerts Near Tampa

A few rounds of storms have moved through Tampa Bay this afternoon and evening. I have been monitoring another round of development on a 4 panel showing Prob Severe, reflectivity, and Earth Networks alert data with lightning track. While Earth Networks has had issues with over-alerting, this product was the first to alert to a developing strong storm. The boxes from Earth Networks are overlapping and confusing as it appears lightning data is being pulled from the same storm, but parsed into separate tracks. These alerts were posted at least 45 minutes before Prob Severe indicated 77% probability of going severe in the next 60 minutes.  Reflectivity did a better job that prob severe hinting, at least, at the chance for thunderstorm growth.

UFFSU

eni prob reflectivity

Tags: None

Dangerous T’Storm Alert

Storms continue to move through the Tampa Bay area.  Storms continue to display a high degree of electrical charge. Alerts from the Earth Networks lightning guidance remains on. As these storms move slowly to the west, one notices a tremendous amount of alerts. The photos below show dangerous and significant thunderstorm alerts in the bottom right page. You can see that there are a number of alert boxes present at 2100z.  The times associated with these boxes all expire after 2115z.  Yet, these boxes come and go so rapidly that they are really useless, disappearing when lightning ramps down it appears. It just lacks reliability with its current display.

UFFSU

2100z ENW dangerous tstorm box 1

2115z  ENW dangerous tstorm box 2

Tags: None

NUCAPS Sample

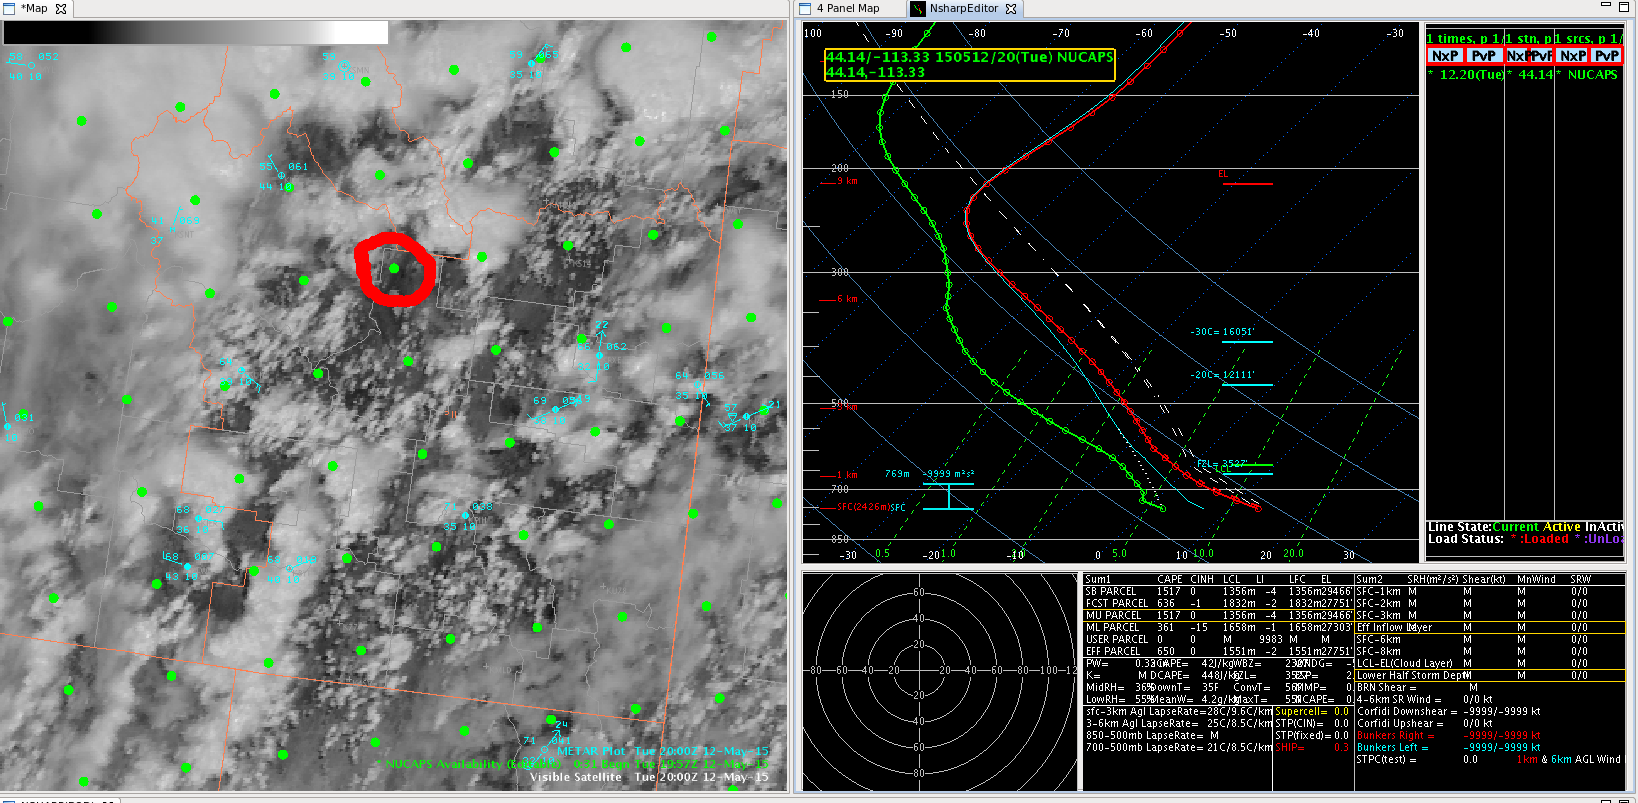
Tested NUCAPS sounding for southeast Idaho.  The point used is circled.  The visible image was close to the sample time, but there may have been some cloud contamination.  Adjusted the surface observations upward based on the nearest MesoWest surface observation.  It was difficult because a lot of the lower points needed to be adjusted to keep it realistic.  The instability seems a little high, but it could be localized.  Will see how the thunderstorms in the area develop over the next few hours.

Screenshot-CAVE:PIH - D2D -3

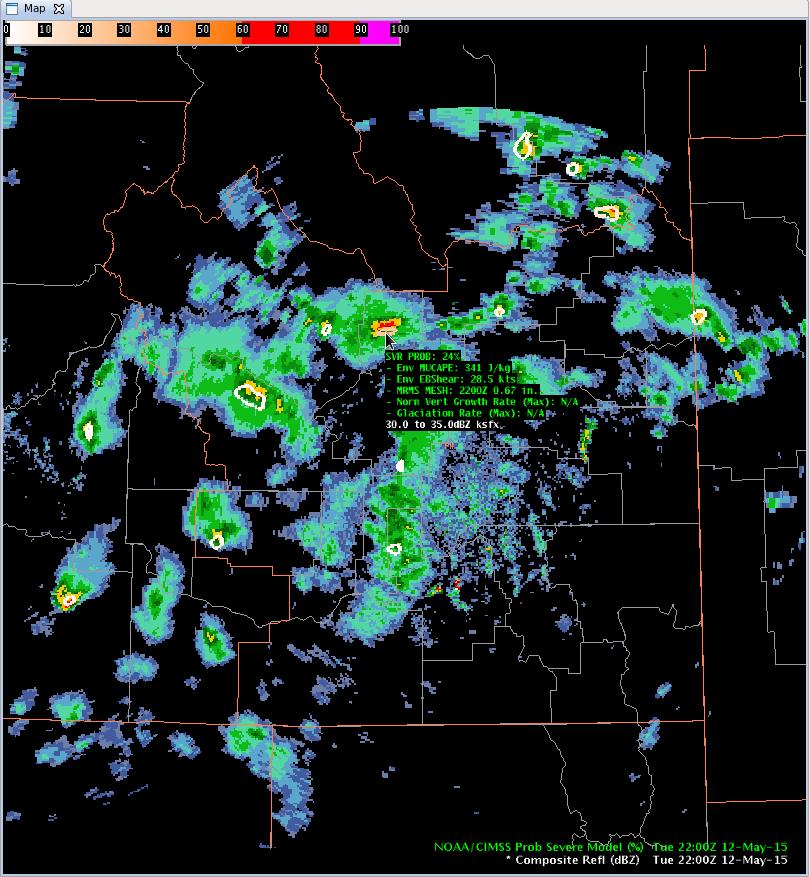
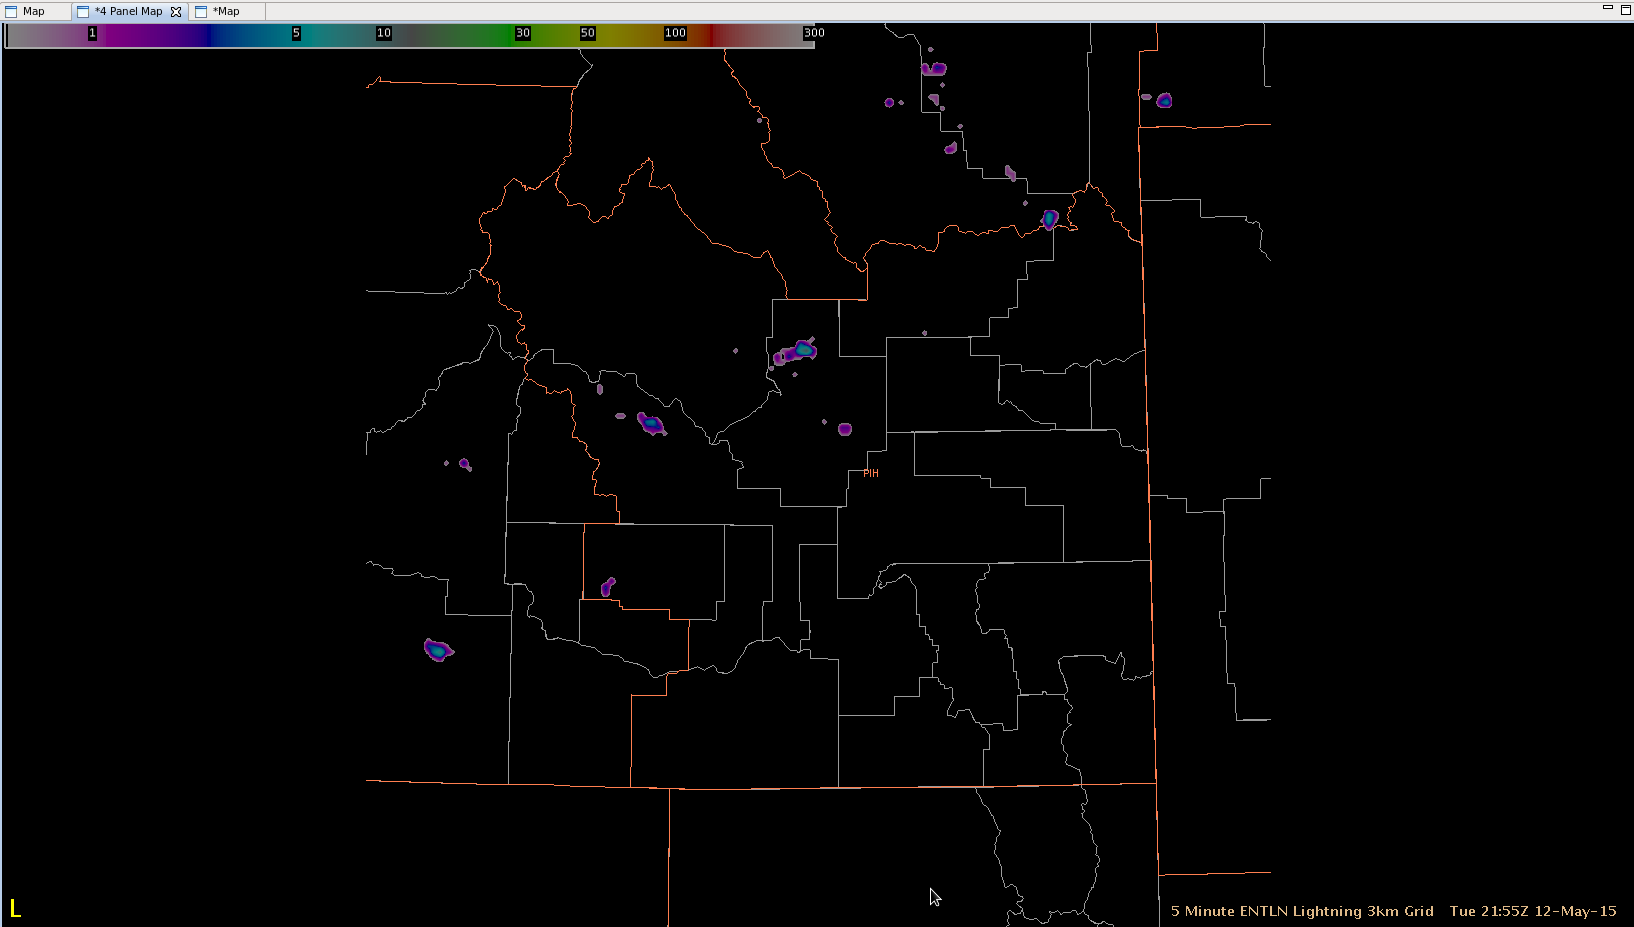
Update: This thunderstorm moved over the sampled area about two hours later.  It peaked at about 55-60 dBZ Composite Refl and had a NOAA/CIMSS Prob Severe Model reading of 24% at that time.  The 5-minute ENTLN Lightning 3 km grid peaked at 11 with this storm.  There was no ground truth to verify what happened there.  But will note the complex mountain terrain in that area and how difficult thunderstorm modeling and forecasting is in Western Region (with local effects, etc.).  This was a decent test.

Screenshot-CAVE:PIH - D2D -4Screenshot-CAVE:PIH - D2D -5

-Champion

Tags: None