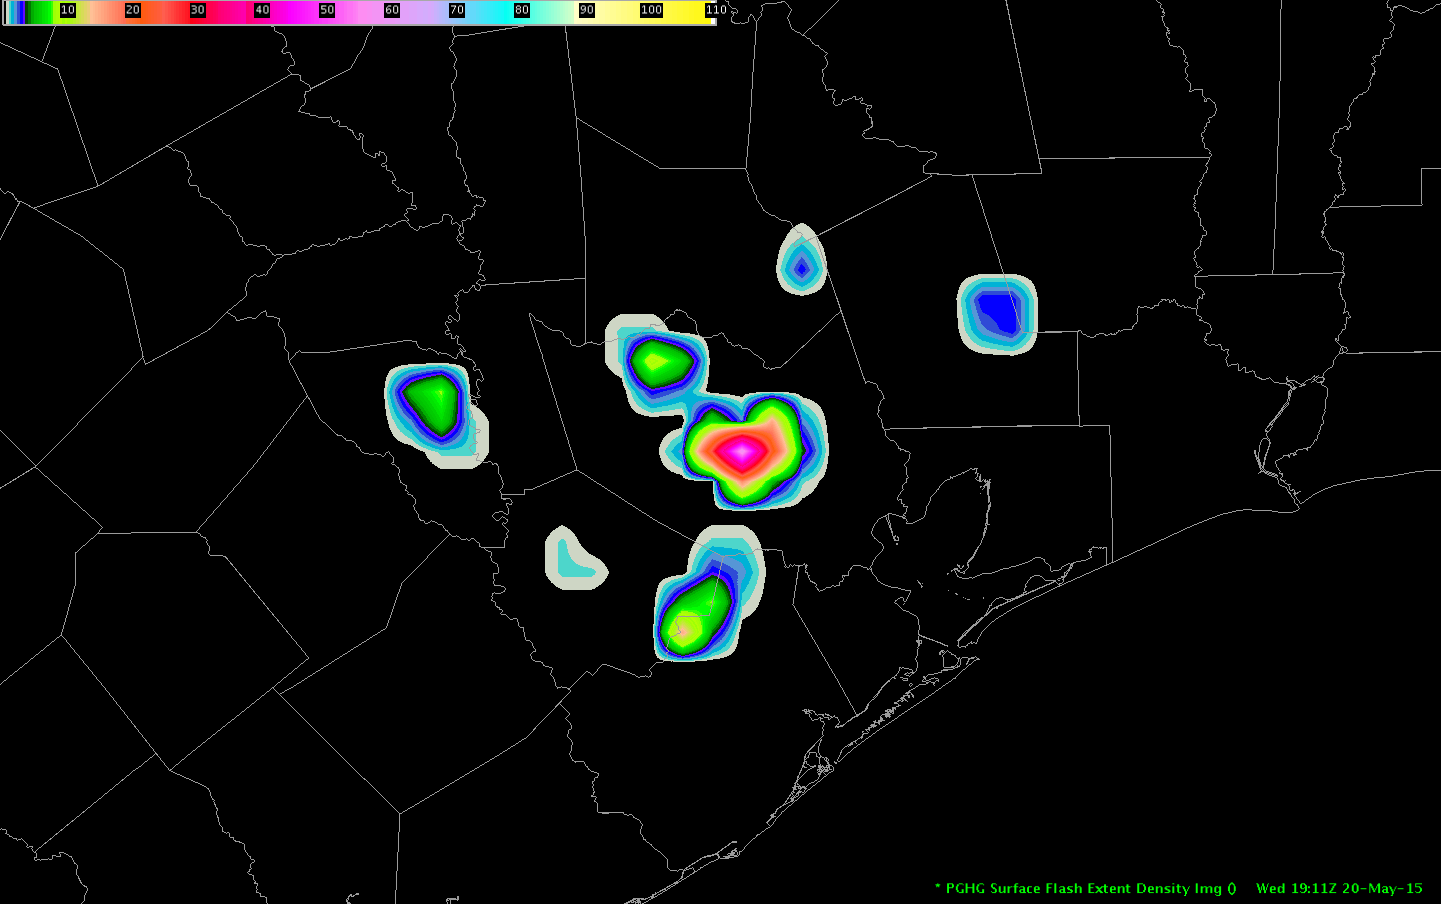
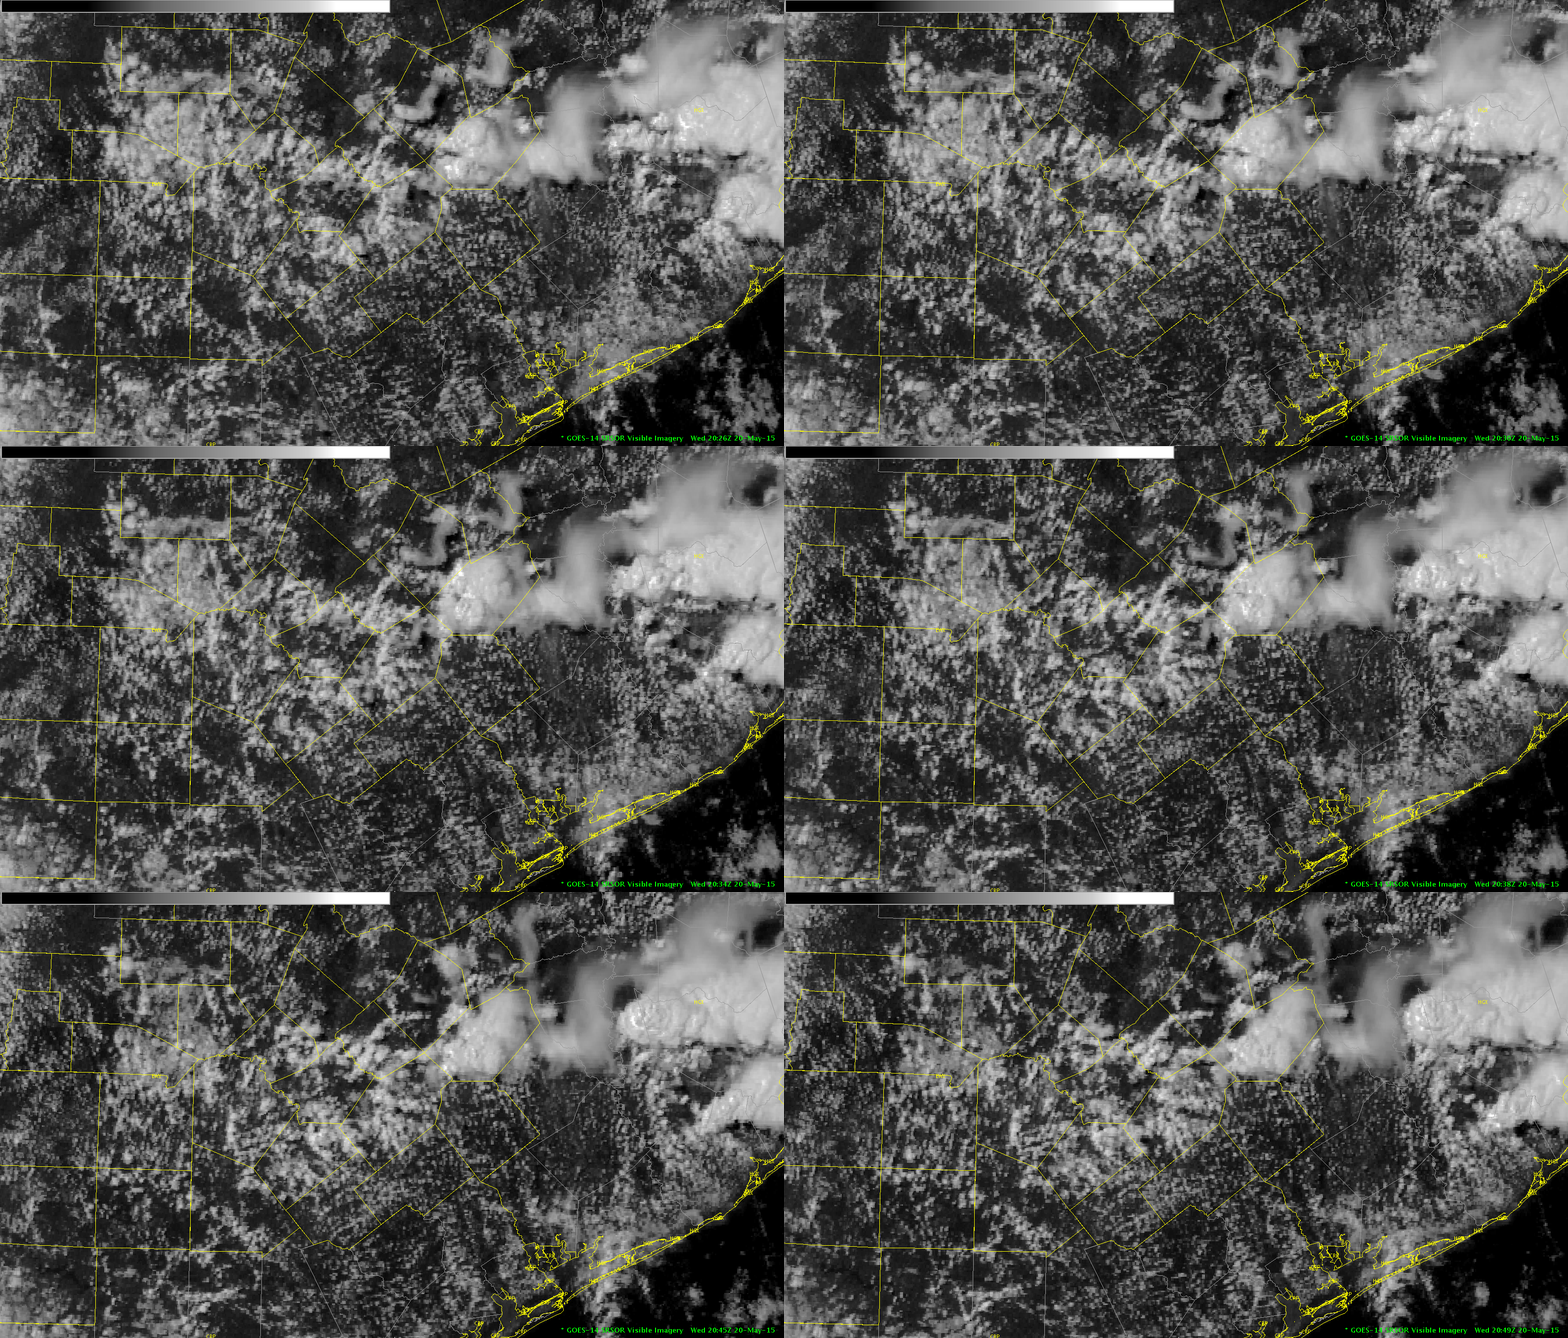
The 1 minute temporal resolution allows for visual tracking of individual small convective cell development. (first image) This details in not as easily detected in the 15 min typical visible satellite imagery…because the vertical development gets disconnected from the low-level feature kin that time span.
It is also easier to visualize the shear. In the example below…you can see the se low-level flow advecting the 2500-3500 ft cu Nw…as depicted in the 18z ruc sounding. This flow then veers to the west as you go up to 600 mb (15000ft)…which is seen in the blow off of the towering cu to the east.

Pickles