An official website of the United States government
Here’s how you know
Official websites use .gov A
.gov website belongs to an official government
organization in the United States.
Secure .gov websites use HTTPS A
lock (
) or https:// means you’ve safely connected to
the .gov website. Share sensitive information only on official,
secure websites.
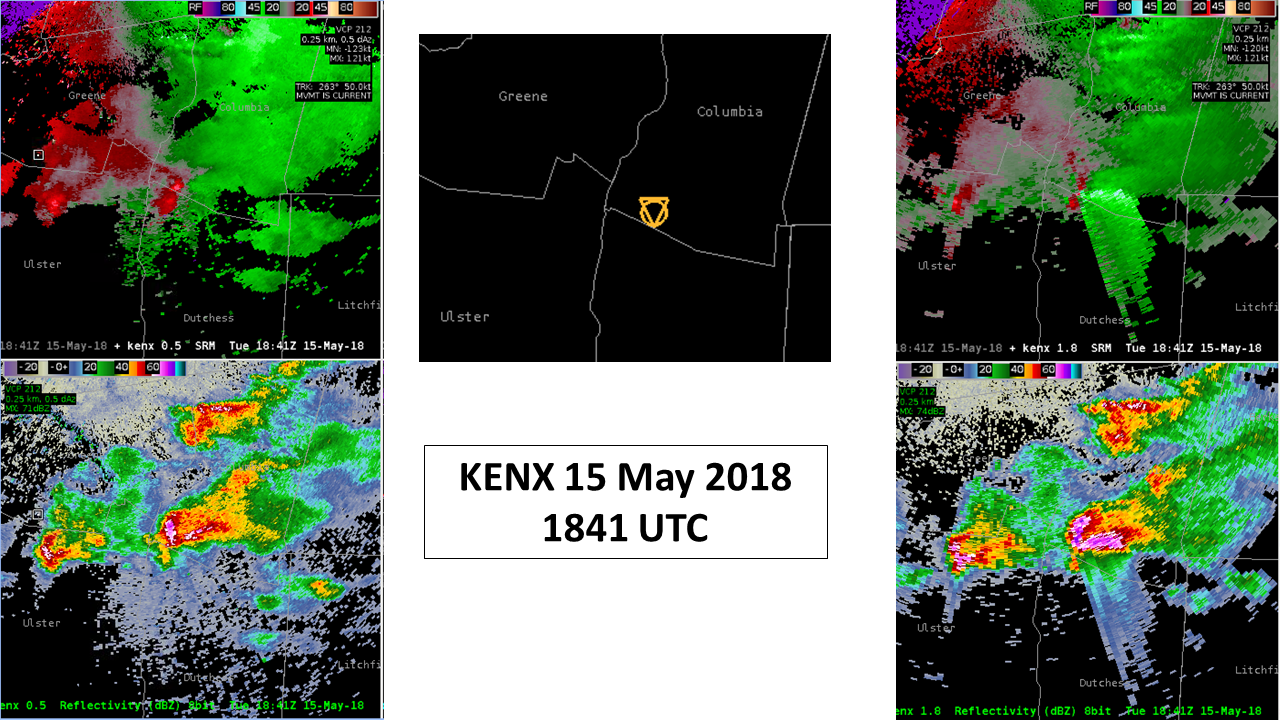
In this case, the tornado circulation was well displaced to the west of the main body of the supercell. Based on video and spotter reports, it’s likely associated with the very weak reflectivities west-southwest of the heavier reflectivity. The NMDA and NTDA both correctly honed in on this area, despite little in the way of an obvious velocity signature. One of the facilitators was able to share their screen and show the AzShear and DivShear outputs for this time frame, and the correct identification of the tornado location matches well with those fields.
This is 2133 UTC when the NMDA was maxed out with 8 tilts (0.5 – 5.1) being incorporated into the detection. Rotation track at the upper left shows how quickly this escalated.
Below is a jump ahead to 2146 UTC. Through this time, the NTDA was very consistent with tracking the circulation even as depicted in leftward curving rotation track.
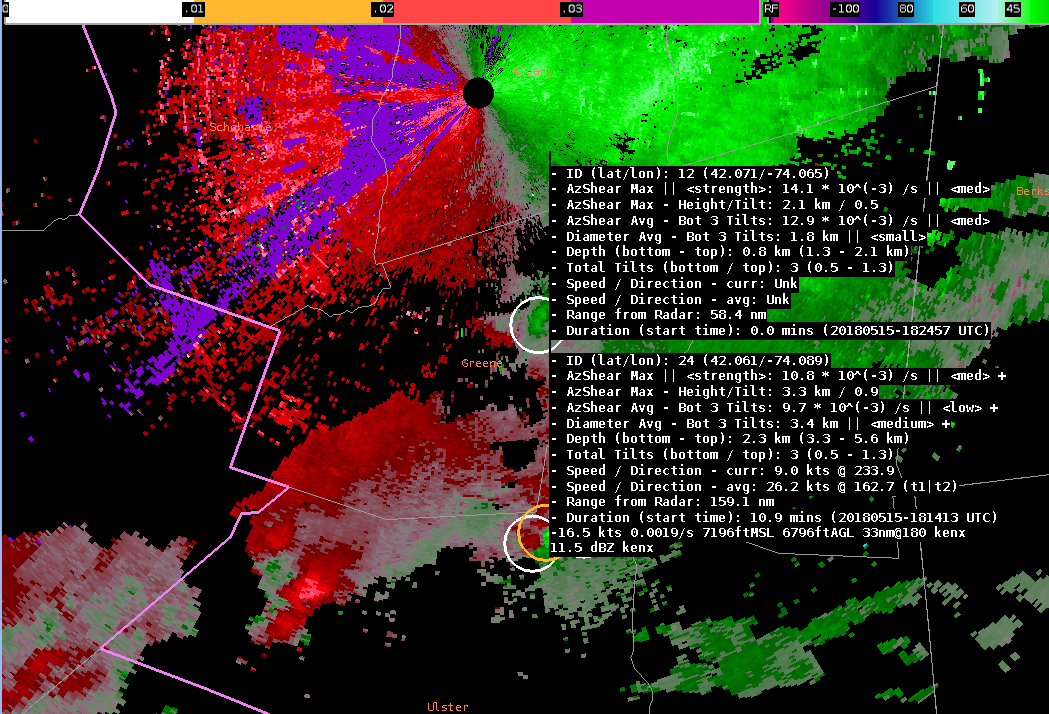
This is a case where there are 3 NMDA detections in close proximity, two of them (the orange colored ones) are stronger than the third. The “orange” detection to the north uses 0.9 – 5.1 degrees elevations while the other to the south uses 0.5 to 1.3 degrees detection. It looks like two scales of circulation are being detected. This can be seen below in particular at the overlapping elevation cuts (0.9 and 1.3). By the time you get to 1.8 and 2.4 elevations, the larger scale circulation is by far more prevalent.
So here’s a thought. Imagine viewing this in all-tilts with icons displaying only if that slice is part of the detection? In this case, going up the tilts would show first the southern icon, then both, then only the northern icon. Knowing which tilts are involved for the NMDA is very useful information and functionality such as this could make that easier to assimilate.
This seems to be an issue with undershoot. The NTDA uses only 0.5 degree elevation and at this range this corresponds to about 1600 ft AGL. That is likely well below cloud base. The upper right panel is mid-level rotation tracks and the panel immediately to the left of that is low-level rotation tracks. Note how rotation is more evident in the “mid” levels, which again underscores the disadvantage the NTDA has with just looking at 0.5. Side note: The NTDA and ProbTor (lower right) probabilities
Below is 2018 UTC:
The 2018 UTC screen shot shows a persistent and strong mid-level rotation track with good consistency on the ProbTor object. The NTDA has been jumping around a bit, again because it’s at a disadvantage because it’s still sampling below 3000 ft even at this range.
Below is another example of NTDA detections jumping around. In this case, perhaps it has more to do with the confusing velocity associated with merging cells.
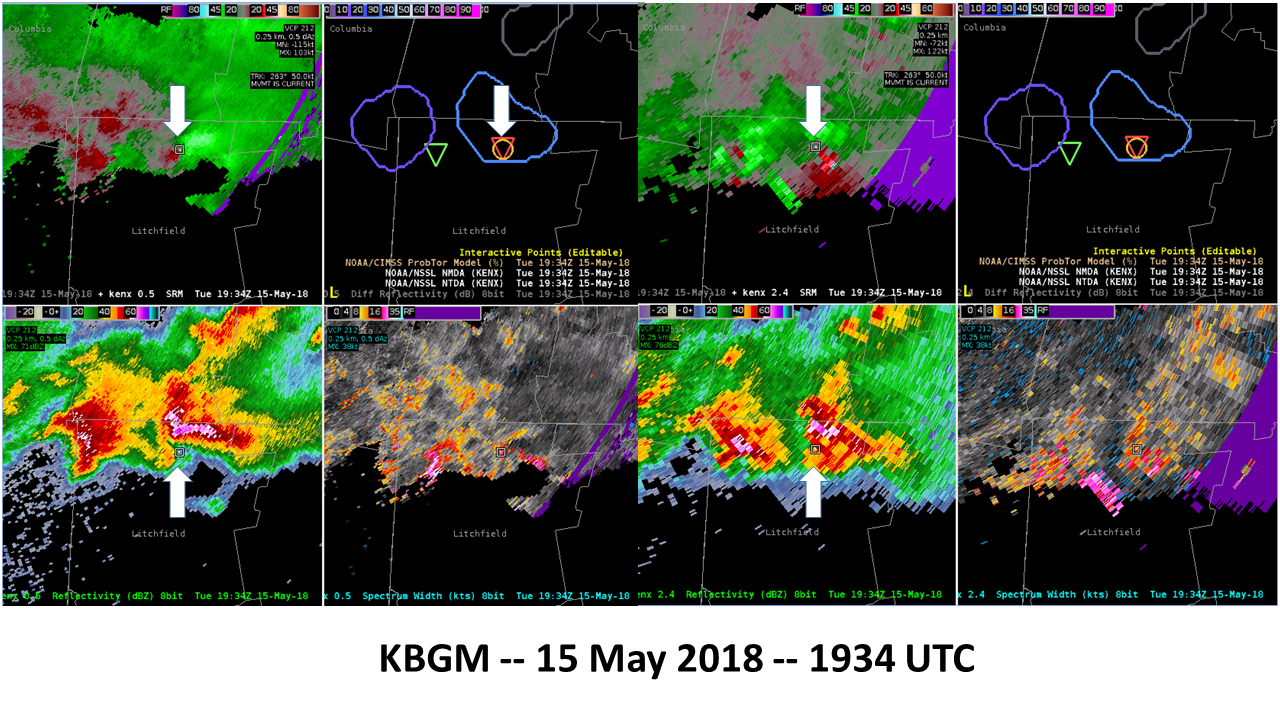
Below is a snippet of NMDA and NTDA detections. This area corresponds to the white rectangles in the upper left panels of the figure above. The columns are labelled by elevation slice. There’s a lot going on here: unambiguous range issues, beam blockage at lower elevations, and a very strong Updraft/Downdraft Convergence Zone (UDCZ) that is also producing noisy velocity data at the UDCZ interface (ref. Spectrum Width in bottom row).
Here I’ve attempted to show how both the NTDA and NMDA are susceptible to vertical data smearing of velocity data. Cursor square locations refer to the position of the overlapping NTDA/NMDA detections. The 0.5 cut is to the left and the 2.4 degree cut is on the right. This is a tough problem, with perhaps Spectrum width providing a sanity check for the NMDA at least
This about as good a hail spike you’ll see anywhere, let alone the Northeast. No surprise given the close proximity to radar and reports of 2” – 2.75” hail. For the NTDA detection, both the azshear and divshear values are in the “high” category. The probability was 40%. The NMDA detection extended only up to the 1.3 degree slice. The 1.8 cuts are shown to the right above. It’s asking a lot of any algorithm to make sense of velocity data in cases such as these, which is a good reminder in general when dealing with hail spikes, non-uniform beam filling, etc.
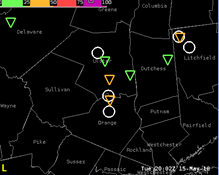
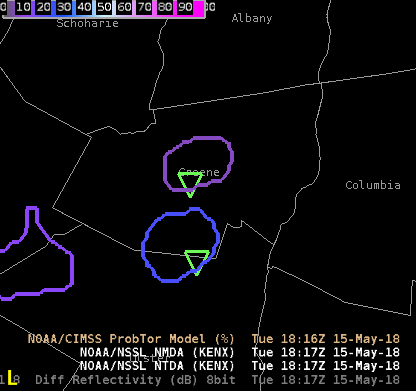
Looking below at another time (1817 UTC), it’s interesting to compare ProbTor with NTDA probabilities. Agreement between the two in terms of placement has been consistently good. There have been many times where the probabilities are similar, which is very surprising given that ProbTor is looking at coarser gridded azimuthal shear (1km?) as opposed to native resolution used by NTDA. Probably a coincidence. This is more the exception than the rule; most of the time NTDA is giving greater probabilities as one might expect.
I like the idea of overlaying multiple algorithms from multiple radars, as this give a more rounded view of a cell sometimes, especially if equidistant from RDA’s. I would like an ID from which radar I am looking at more apparent. With the NTDA there is an ID but it is difficult to see and find. With the NMDA there is no ID at all.
NTDA from both BGM and ALY overlaid on the KENX (Albany) radar.NTDA (relatively) high from both KBGM and KENX before tornado touches down in Sullivan County.NMDA from both BGM and ALY overlaid on the KENX (Albany) radar.NMDA from both BGM and ALY overlaid on the KENX (Albany) radar.NMDA from KENX (Albany). Many weak detections from a severe QLCS parallel to the RDA.NMDA from KBGM (Binghamton). Several detections from a severe QLCS perpendicular to the RDA.NTDA from both KOKX (NYC) and KENX (Albany) overlaid on KOKX radar.
Wanted to make a note about the visualization of the NTDA/NMDA algorithms when loading them on a 4-panel (all-panel rotate) AWIPS display. In this example, the algorithms were loaded onto all four panels. The first image shows that some adjustments were made to the settings on the panel displaying the V product — including a slight downsizing of the icon size, and unchecking option for scientific notation.
KBGM algorithm detections on the V panel of a 4-panel display.
However, on the panel displaying the SRM product, these options were not changed. The end result is that despite both of these displays being in the same overall AWIPS pane, the visualizations for NTDA are different between the two.
KBGM algorithm detections on the SRM panel of a 4-panel display.
I definitely expect that forecasters will have a desire to make changes to the default settings, in terms of which variables are displayed, how the units are displayed, and the size of the icons. For ease of use, it would probably be best to have the changed settings carry across all panels in the current AWIPS display, or else the settings will have to be changed four different times.
–Insolation
1842Z
We are examining a supercell in central Susquehanna County, Pennsylvania. At 1830Z, this cell had an NMDA detection (ID 34) beginning at the 0.9° slice and continuing through the 1.8° slice (3 total tilts).
KBGM V / algorithm detections at 0.9° at 1830Z.
However, it was noted that the mesocyclone on this cell continued much higher than the 1.8° tilt, as seen on the image below. So, it is worth noting that the algorithm probably did not continue going up through the storm as much as it could have.
KBGM V / algorithm detections at 5.1° at 1830Z.
Jumping ahead to the next full volume scan (below image) we see that an NMDA detection continues to be associated with this storm, and the depth has now increased to a total of 5 tilts. However, this is actually a new detection (ID 35), suggesting a problem with tracking as the supercell did not have any obvious changes that would have required assigning a new object ID.
KBGM V / algorithm detections at 0.9° at 1835Z.
While this detection does show greater depth than the previous detection, ascending to the 3.1° tilt, again it does seem to be under-doing the true depth of the mesocyclone. The image below is an example of the strong mesocyclone persisting through at least the 5.1° tilt.
KBGM V / algorithm detections at 5.1° at 1835Z.
–Insolation
1901Z
A QLCS evolution in Susquehanna and Lackawanna counties in Pennsylvania has provided an opportunity to examine the tracking of several features. In general, the NMDA detections along the line have been somewhat jumpy on KBGM. There was even a case in which one southeast-moving feature was sort of re-assigned the ID of a different NMDA object. Object ID 29 had been tracking fairly well from 1843Z to 1851Z, but suddenly on the 1854Z scan, this feature (a kink/meso within the QLCS) was assigned Object ID 16, which had previously been at a different location within the line.
It is also worth noting that this feature has had a consistent NTDA detection (ID 30) which has been tracking very nicely throughout the duration of this feature’s lifecycle, so the tracking problem did not extend to the NTDA algorithm.
KBGM V / algorithm detections at 0.5° at 1851Z. The feature in question is the co-located detection at the immediate bottom-left of the sampling data. At 1851Z, this feature had NTDA ID 30 and NMDA ID 29.KBGM V / algorithm detections at 0.5° at 1854Z. The NTDA feature remains consistent, but the NMDA detection has been changed to ID16. Note the very erroneous speed/direction values as well.
–Insolation
1915Z
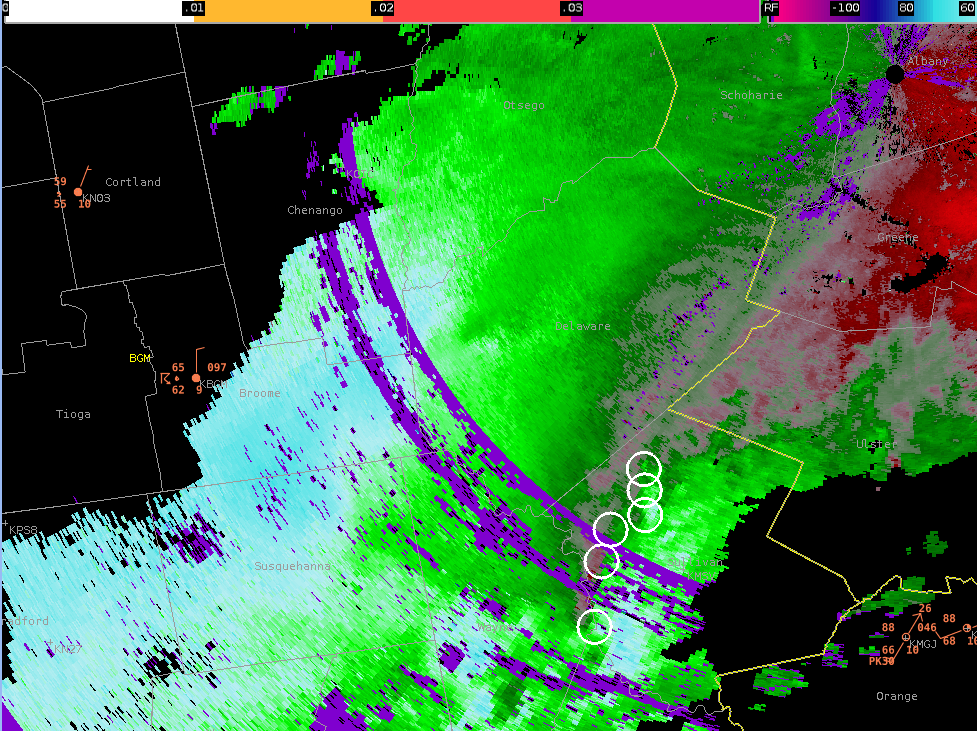
Two well-defined QLCS circulations have developed in Wayne County PA. The main issue to highlight here is that the northern circulation did not generate an NTDA detection, despite a very tight circulation with a 30-35 knot Vr as determined from velocity data. This is problematic given that a TDS ended up occurring from this circulation. At 1918Z, several scans after the feature developed, an NTDA object was finally assigned (ID 40) but this was much too late to catch the touchdown.
The southern circulation may have also produced a tornado, and NTDA was making detections on it, if perhaps a little lower on the probabilities than would have been ideal.
A tertiary note on this setup is that problems with NMDA ID tracking continued, as discussed in the previous blog post.
KBGM SRM / algorithm detections at 0.5° at 1910Z. The NTDA feature did not make a detection on the northern circulation, which did produce a TDS.
–Insolation
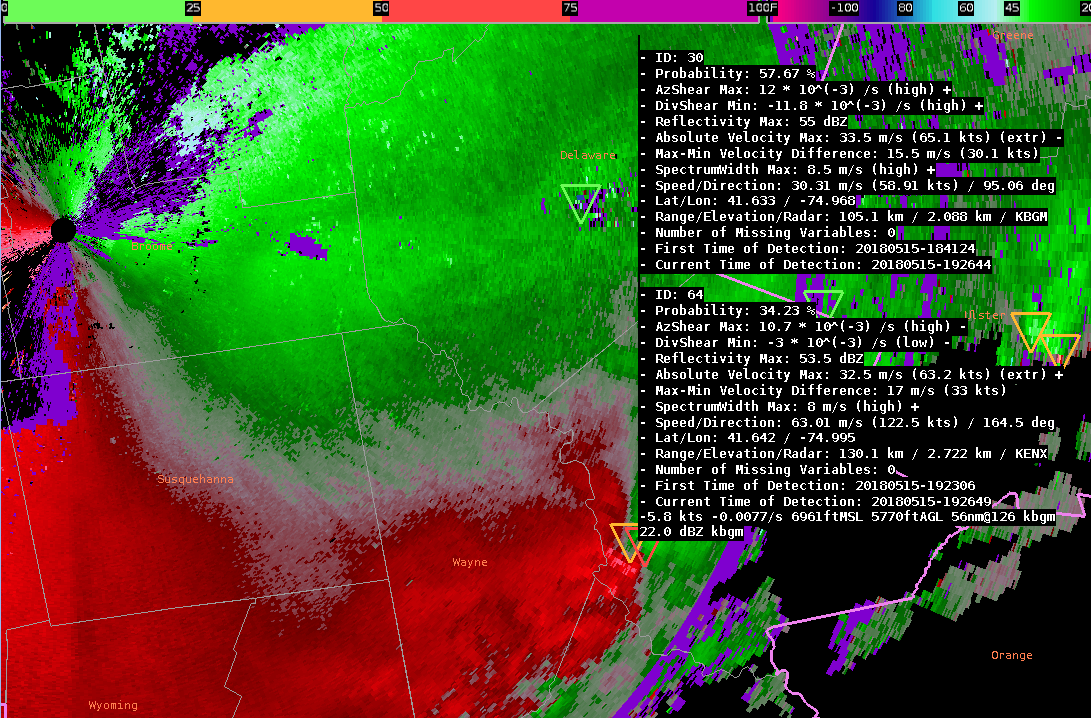
1940Z
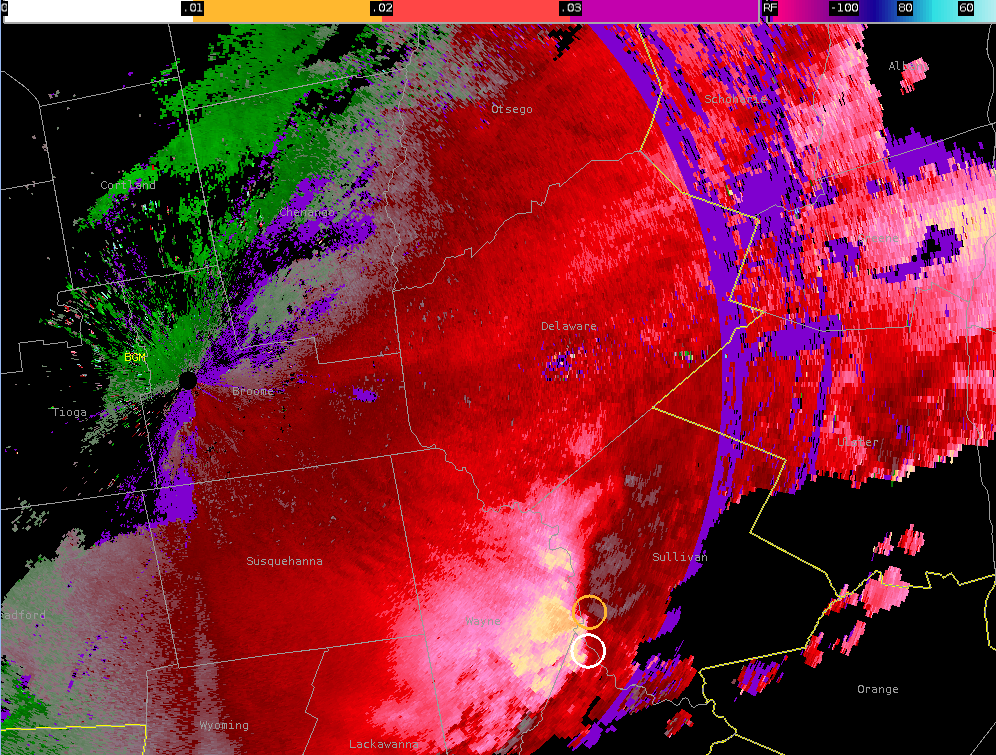
This is a follow-up to the above post about what was originally referred to as the northern circulation in Wayne County. It was noted in that post that an NTDA detection on that feature eventually occurred. Although the initial touchdown and the first 10 minutes or so were missed, the subsequent NTDA detection (ID 30) has been consistent and accurate, correctly detecting a tornadic circulation (per spotter reports). This consistency is noted especially because the storm is not only getting quite far from the radar, but it is crossing the ring of range folding. On the other hand, the NMDA detections remain jumpy, with this feature oscillating between two different NMDA IDs (16 and 29) for no evident meteorological reason.
KBGM SRM / algorithm detections at 0.5° at 1939Z. The NTDA feature shown here has remained consistent, even as the storm has crossed into the ring of purple.
–Insolation
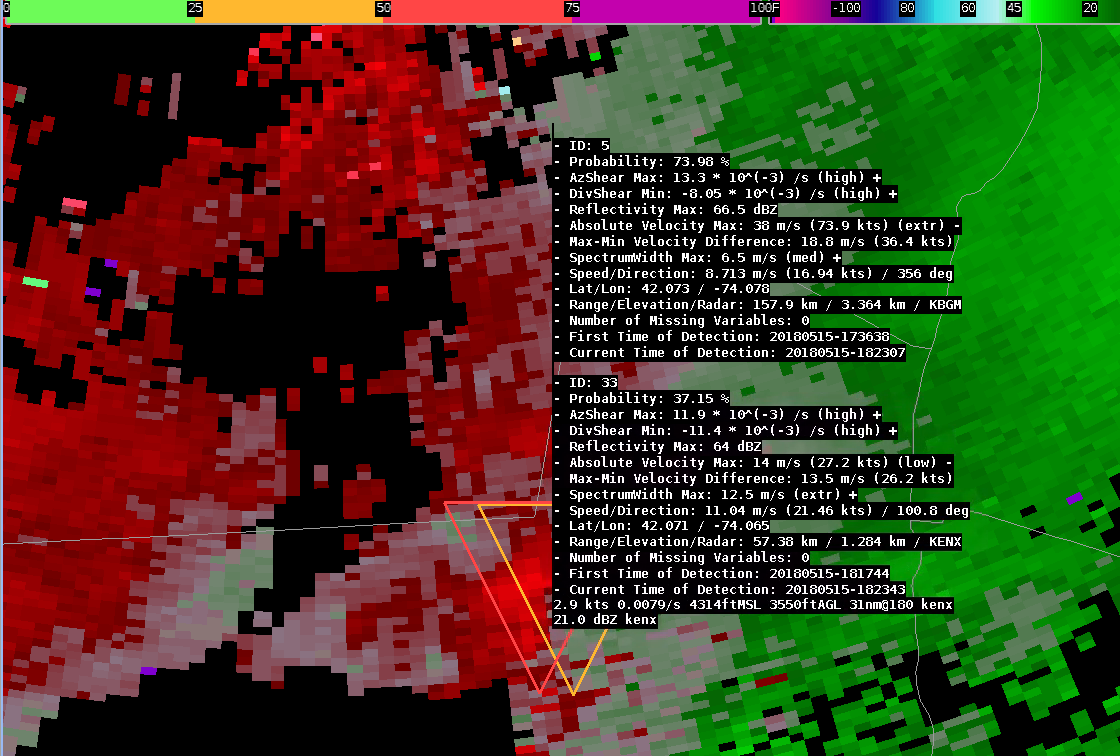
2008Z
An interesting case is unfolding on the Ulster/Orange county border, as an area of rotation within a QLCS is now intersecting an area of beam blockage on the KOKX radar. Within the beam blockage, reflectivities are much lower, and the velocity data is showing signs of spurious / possibly-erroneous values. Nonetheless, this does remain an area of meteorological concern, and the algorithms have been consistently tracking the feature. NTDA (ID 5) has been more consistent with the tracking than NMDA, as has been the case for most of the event.
KOKX 0.5° Z / algorithm detections at 2010Z. The NTDA has been consistently tracking this feature and its probability has increased to 83%, but note that the feature is moving through an area of beam blockage.KOKX 0.5° V / algorithm detections at 2010Z. Note the spurious velocity data (also present on the previous two scans) that may have led to the very high probability with the detection.
As the feature exited the beam blockage, it did appear that the circulation was not quite as intense or tight as the 2010Z images might have suggested. It is tough to say with certainty, given that this remains a strong part of the convective line and some tornado potential is possible, but it appears that some of the spurious velocity values may have tripped NTDA too high in this case.
As of 2013Z, a similar NTDA detection (ID 10) was made on another part of the line just to the southeast (not pictured).
Saw a few instances where the NMDA produced an excessive number of detections along a shear axis. This ended up cluttering the screen, and I fear would result in forecasters turning it off after a bit. Suggest having some sort of proximity filter (i.e., no detections within X number of KM of another) to avoid these situations. Could be set to have a greater number of detections filtered for weaker mesos, but keep the stronger ones.