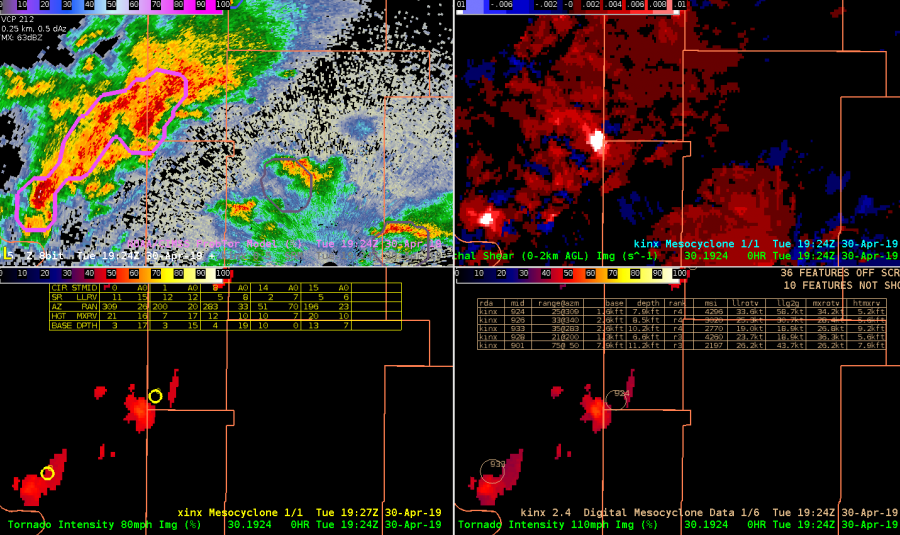
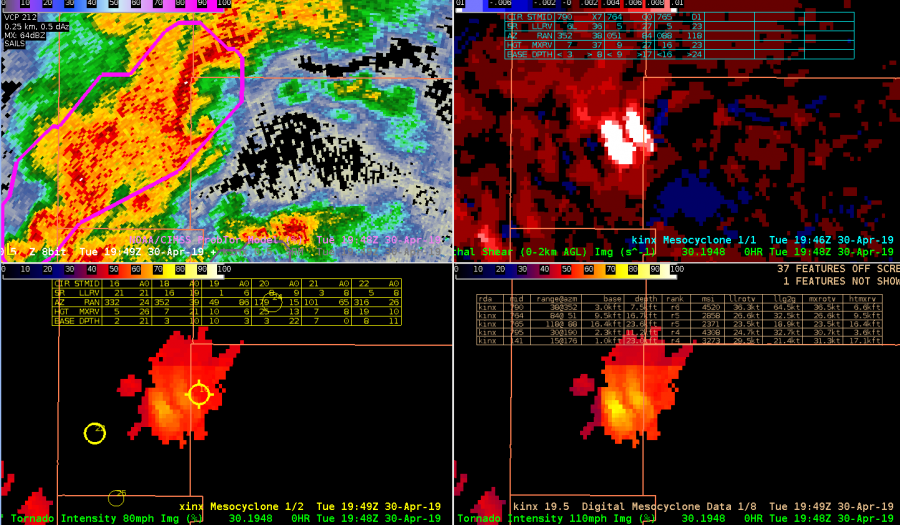
Tracking this northern most SC @ 1926 UTC prior to tornadogenesis. Azshear 0-2 km product did a nice job highlighting shear with developing storm very early on in storm evolution and was very persistent in highlighting area of shear throughout. Temporal continuity was very good. Lower two panels are 80 and 110 mph intensity probabilities. Used this 4-panel to monitor evolution. Also displayed is legacy mesocyclone (upper-right), DMD (lower right) and XDMD l(lower left). This SC also exhibited well-organized ZDR arc and KDP foot (not shown) that whose centroids were normal to storm motion suggesting MC intensification was likely.
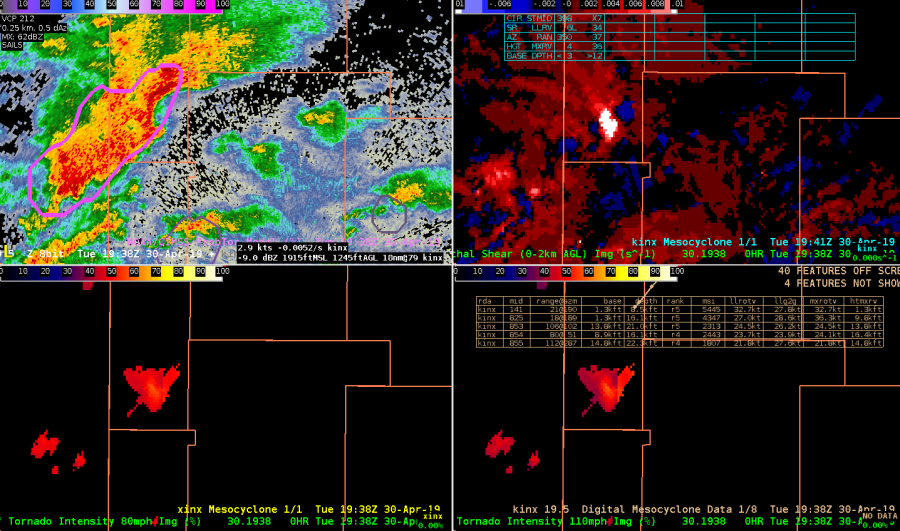
1938 utc Azshear still showing strong signal with CPTI gradually increasing to near 60%. ProbTor increased to 78% as well. DMD, XDMD and MD not showing much and did not seem to be very helpful.
CPTI was insightful with increasing probabilities of tornado intensity probabilities at higher speeds (110 mph lower right). Note that XDMD was also indicating MXRV of 26.
1448 UTC – would occasionally see dual maxes in AZShear and CPTI products that was a bit of an issue at times.
CPTI 110 probablities up to ~ 75 % at this time (lower right)
Overall…0-2 km Azshear was quite helpful in quickly grabbing attention to areas of concern. 0-2 km product was temporally very consistent. Its location relative to developing Mesocyclone was typically off…but still very useful. XDMD, did seem to perform better than legacy DMD products but not much at least with this storm. Early in storm evolution, examining ZDR/KDP centroids relative to storm motion was also helpful as a reality check on MC intensification and increasing SRH with this particular storm. Bottom line was generally pleased wiith AzShear and CPTI performance for this storm. – Quik TWIP
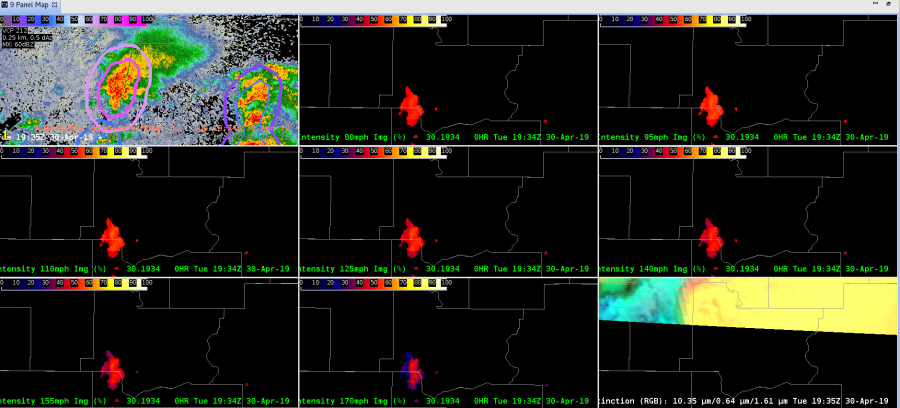
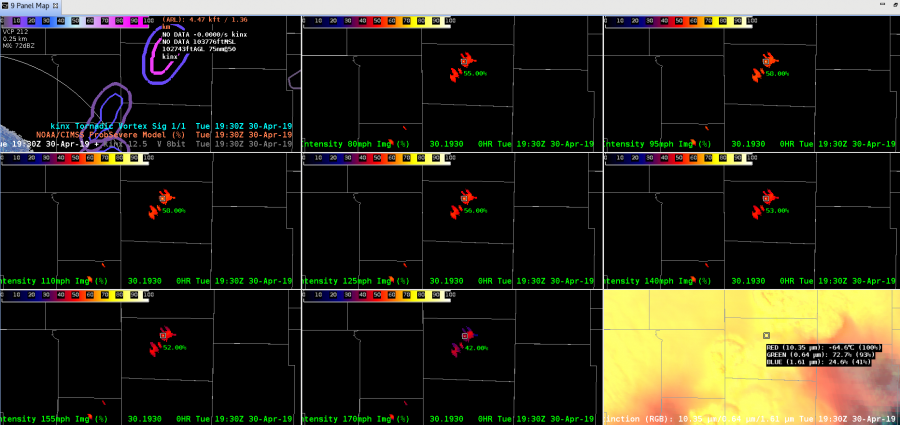
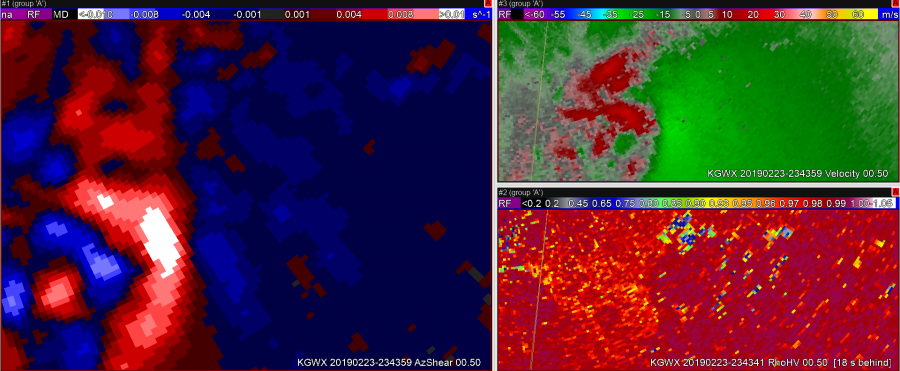
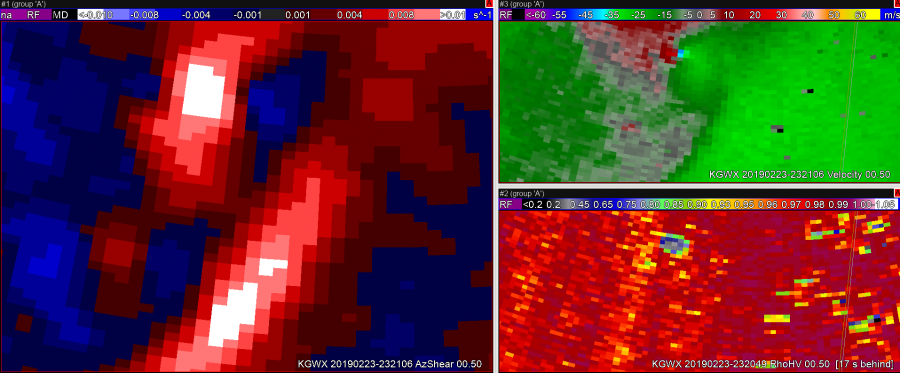 Photo above shows a double maximum in AzShear. One of these is clearly colocated with a TOR on ground via CC. However, velocity shows two very different situations, possible strong tornado on ground versus convergence along the RFD gust front. If you were just looking at the AzShear product, both of these areas would be cause for concern, when in fact the impacts are extremely different. Would be nice to be able to differentiate between extreme high values of AzShear near a tornado versus more broad convergence on any wind shift area.
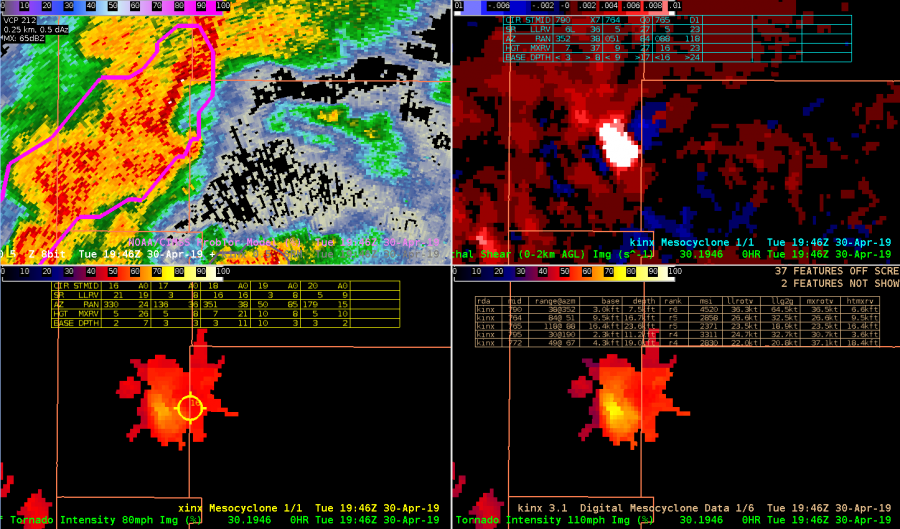
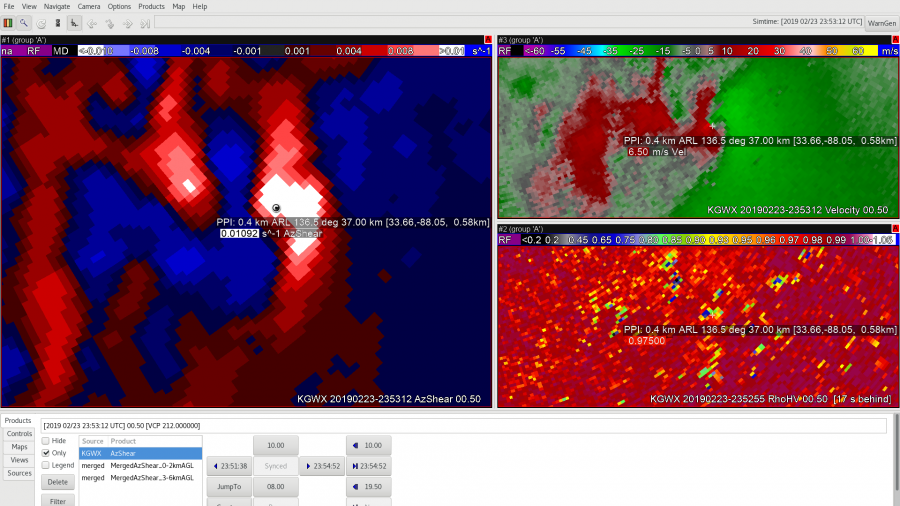 This next image shows a region where the AzShear maximum is too broad. This may simply be a color table issue, but clearly there is an area within the white region where a tornado is on the ground, and other regions within that max where only general convergence is occurring.
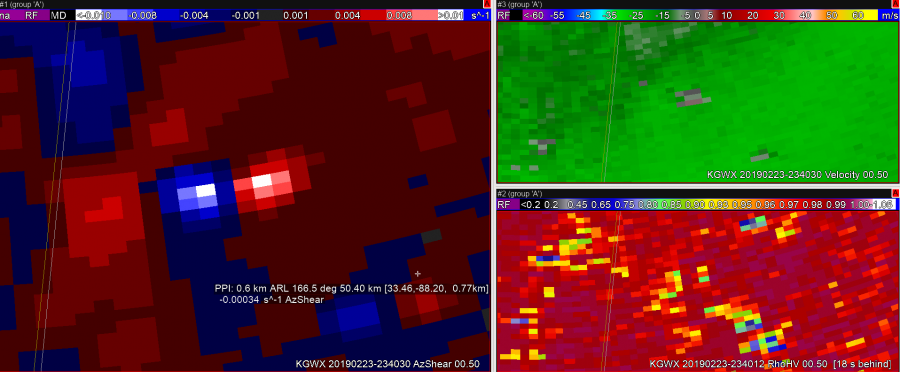 This image shows a location where some ground clutter is producing a false positive and negative AzShear couplet. Mathematically it makes sense to see this here given the V data, however to an untrained eye or someone just solely depending on AzShear you could be led astray.