
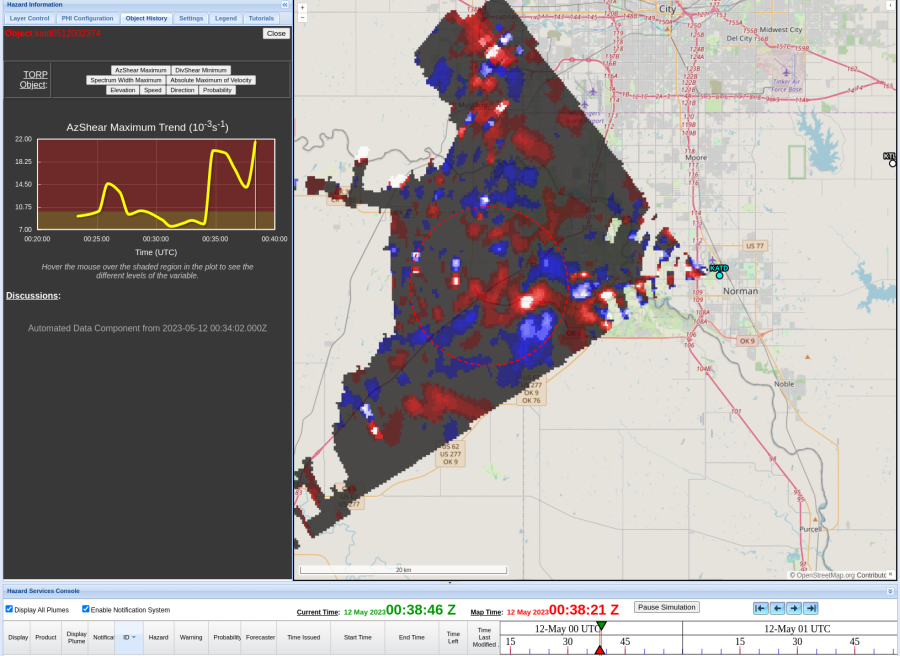
I grabbed these two DivShear/AzShear plots and trend graphs from the PAR to show how they aided my warning decision and result in 10 extra minutes of lead time. While the plots are from right around the time of the first tornado report, and a sharp increase is noted in each field, it was actually the earlier increase just before 0025z that nudge me to issue a warning. The velocity fields also showed increasing storm inflow (not pictured), so this combined with these AzShear/DivShear trends resulted in increased lead time on a tornado warning. 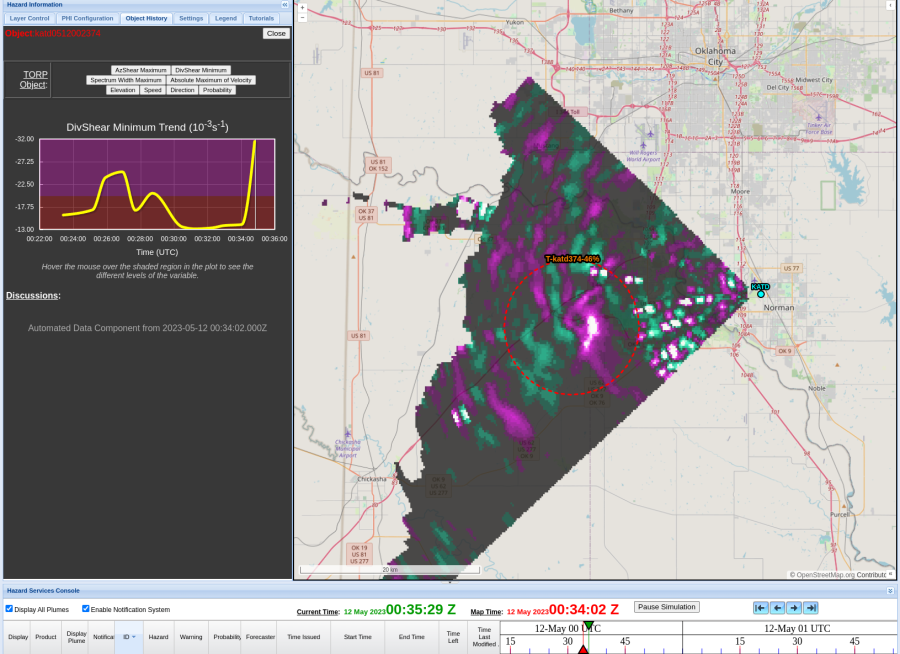
Here is a later example of a clearly tornadic DivShear signature in the PAR data: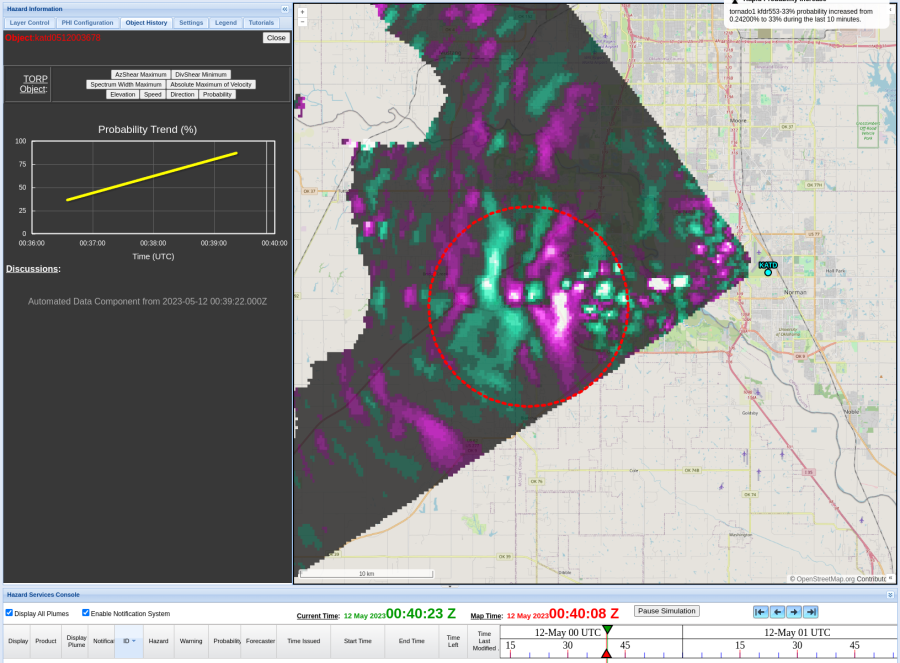
-Orange Lightning