23 Feb 2019 AzShear

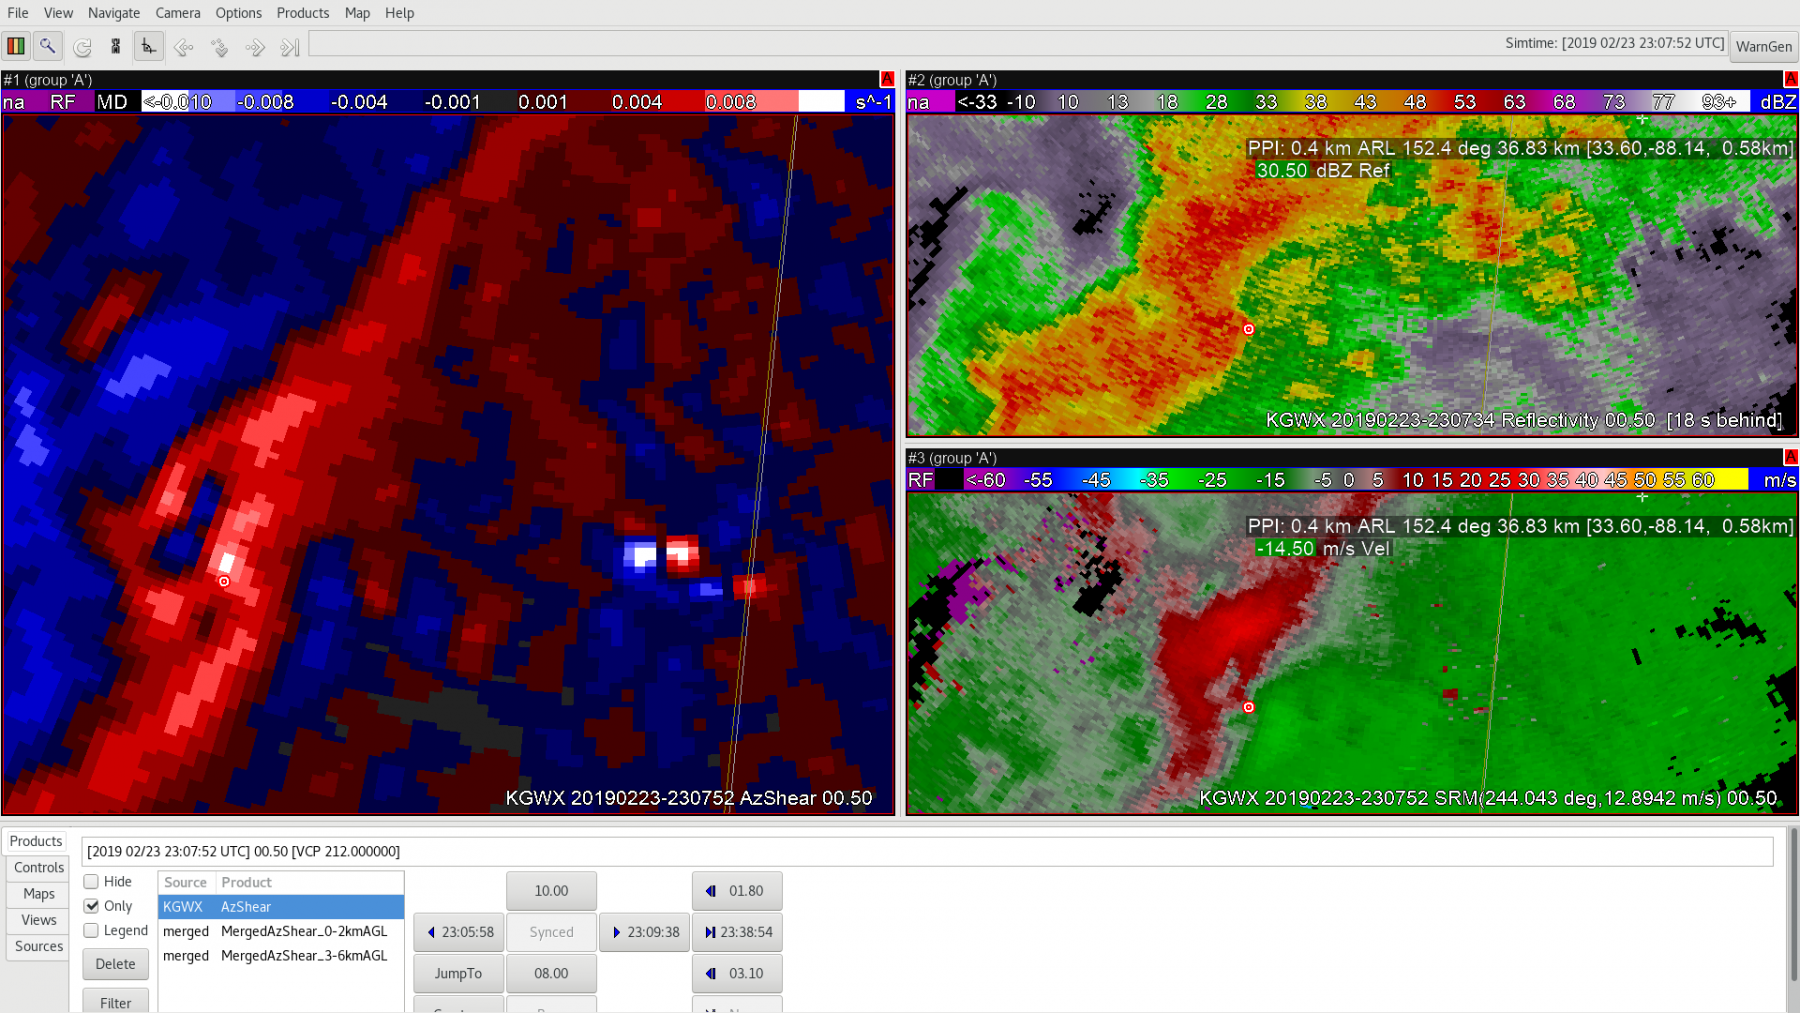
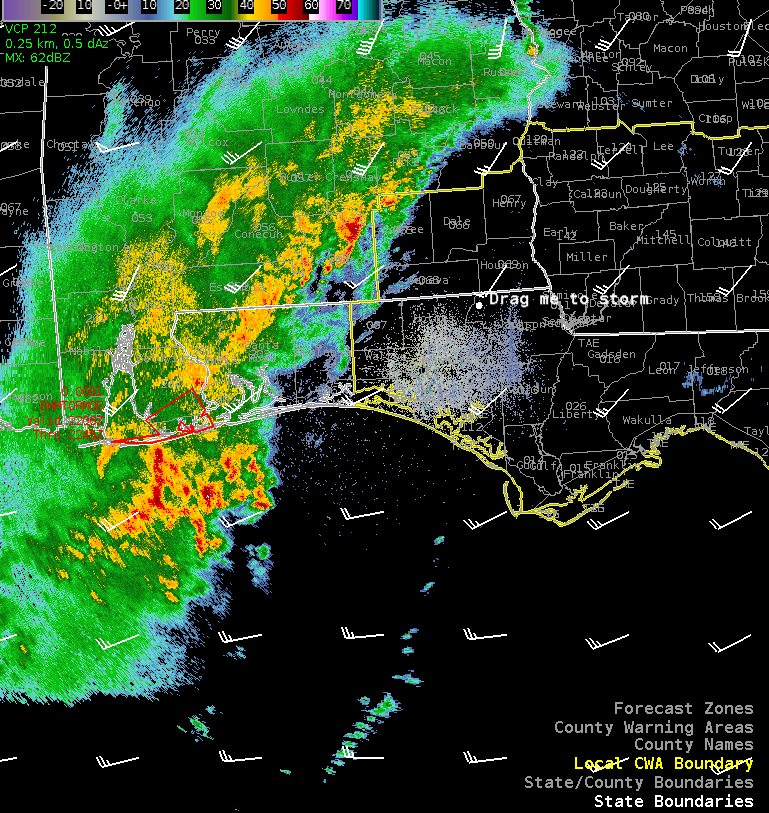
The single radar AzShear product seems particularly useful in the warning environment, especially as an SA tool. At 2307Z the AzShear product highlights an area of enhanced shear near the inflow region of a supercell SW of a KGWX (immediately north of the little red marker) whereas the base velocity has no discernible couplet. Roughly 11 minutes later, at 2318Z, the couplet was clearly visible on base velocity with AzShear even more pronounced value. As an SA tool, AzShear shows promise for highlighting potentially problematic areas before fully reflected in the base products. This product has the potential to help with warning lead times, especially if the storm is in a favorable tornadic environment.

— Stanley Cupp

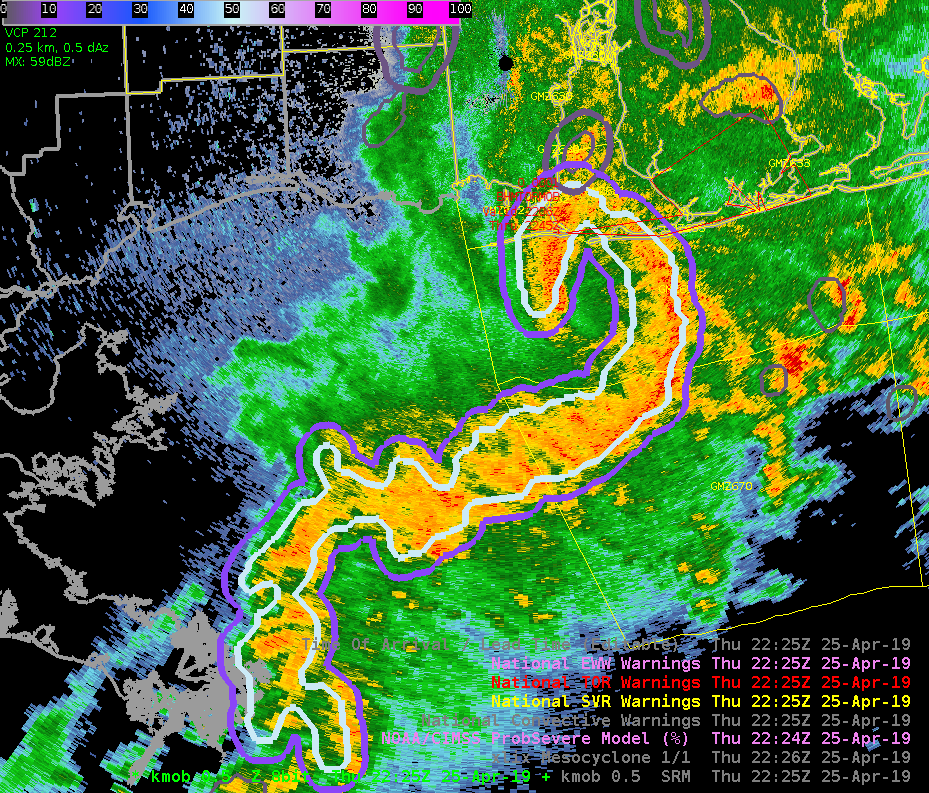
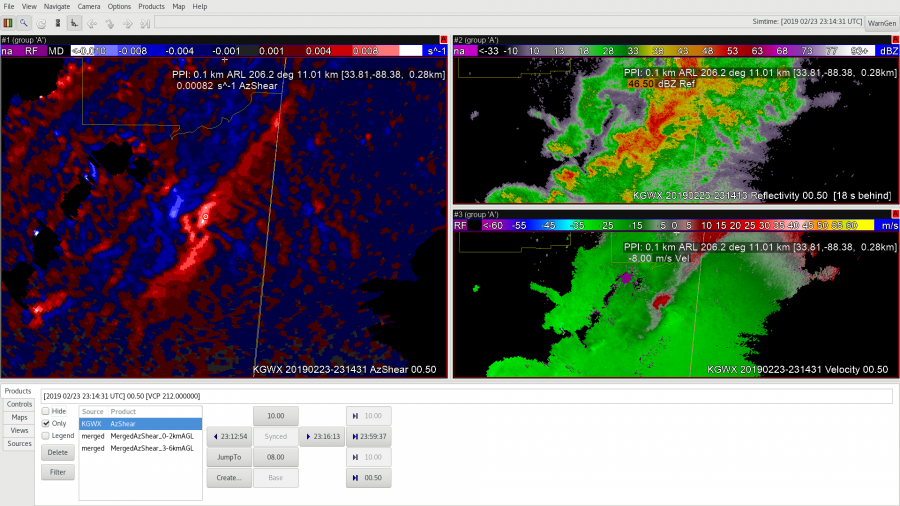
2307Z AzShear, base reflectivity (top right), and storm-relative velocity (bottom right)

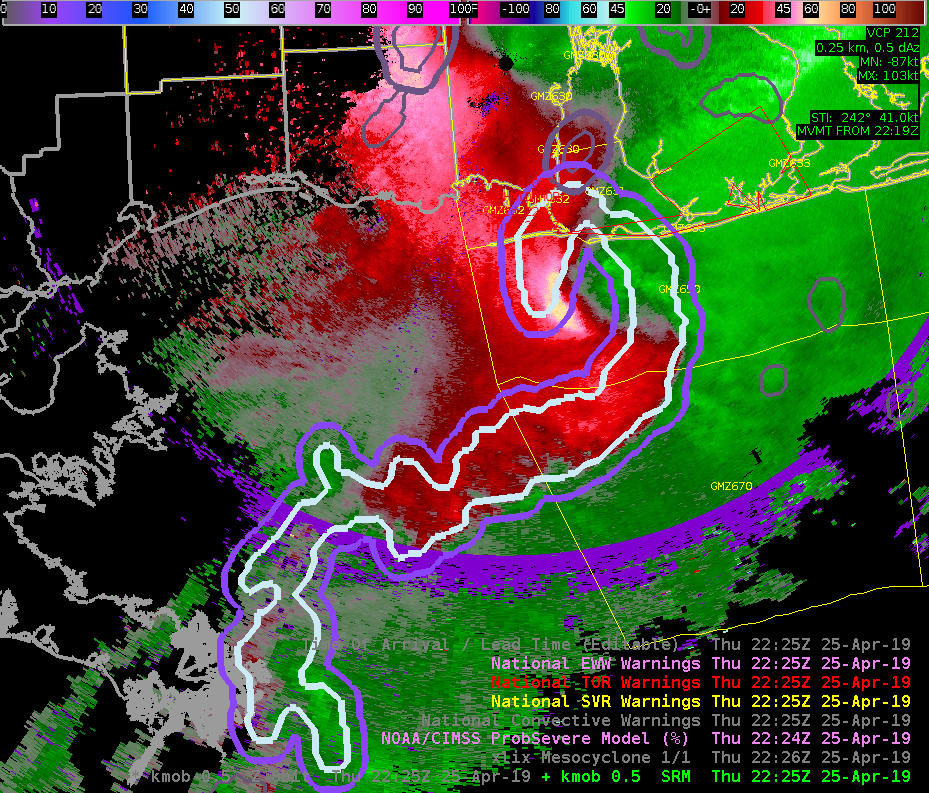
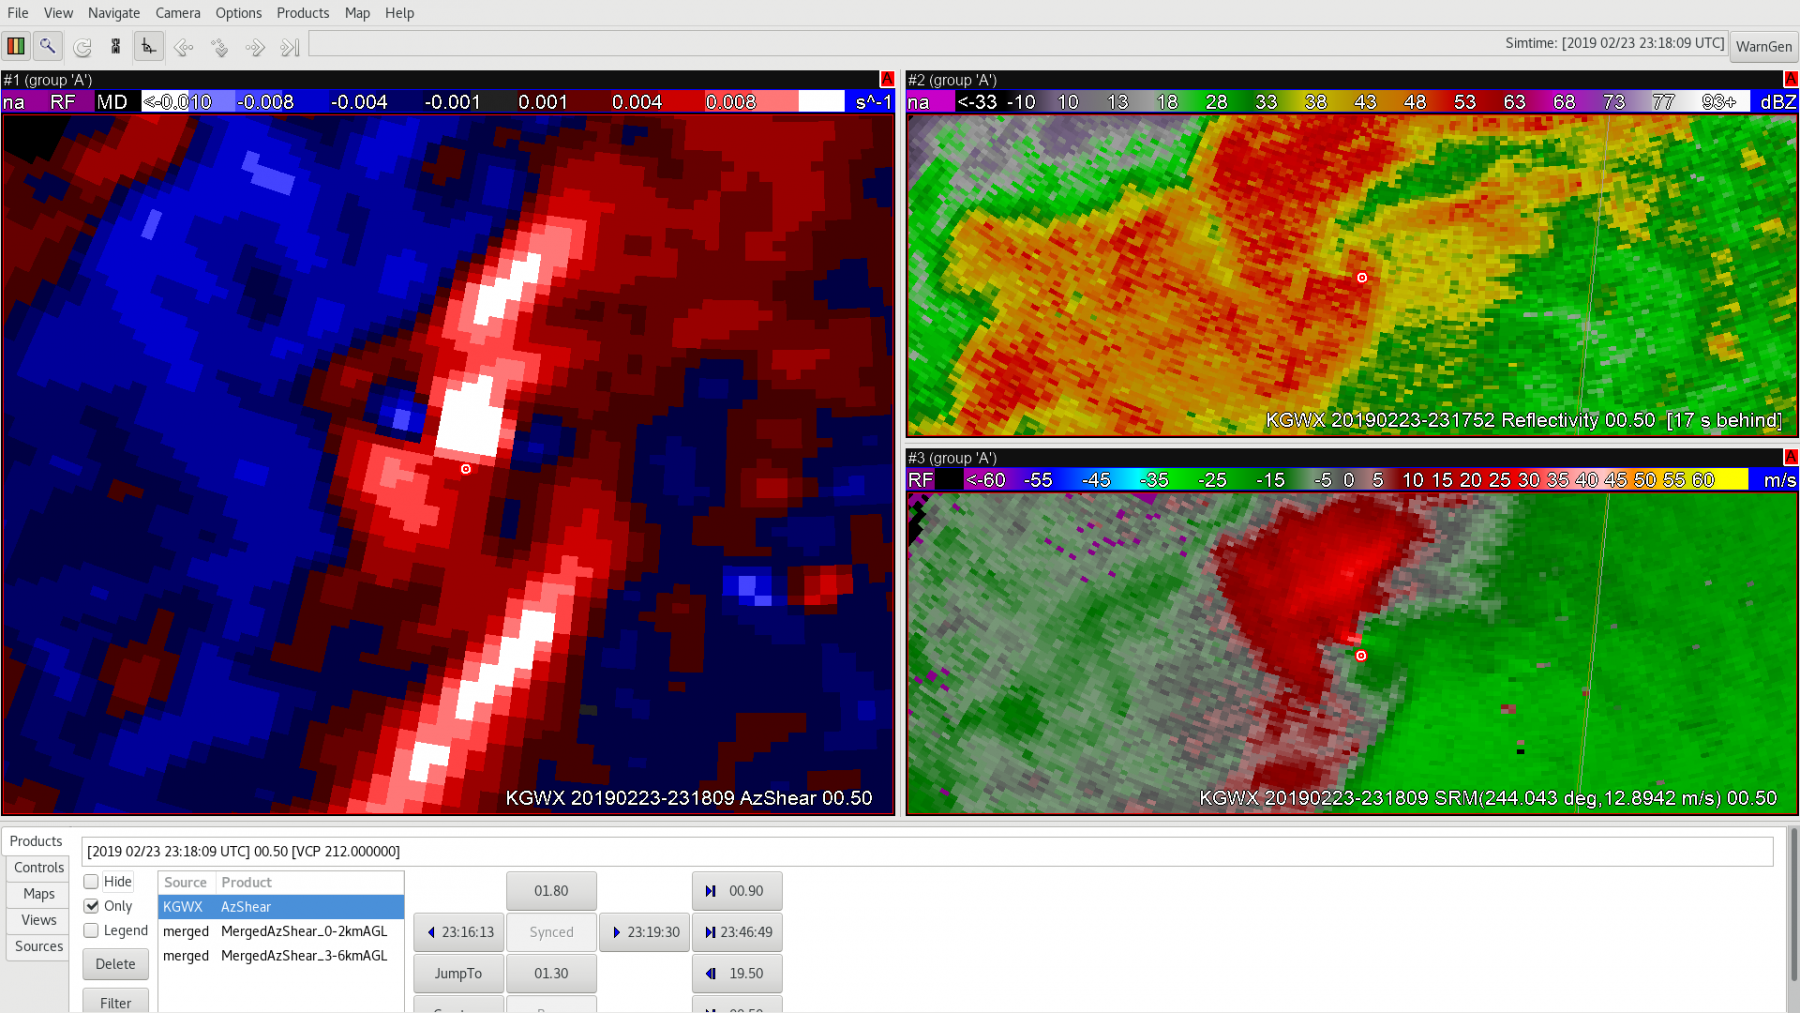
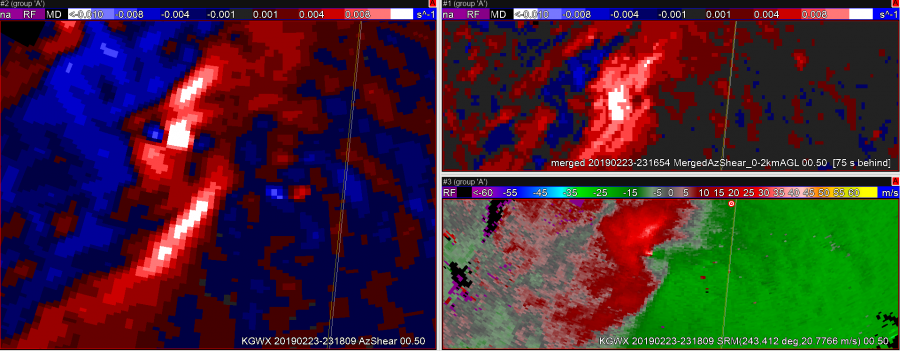
2318Z AzShear, base reflectivity, and storm-relative velocity

AZ_shear 5

Can see the strong AZ-Shear signal developing along the zero-isodop in the velocity product.


One big benefit of the AZ-Shear product is that i can see is increasing shear along the zero isodop line.  This caught my attention of increasing rotation compared to looking/waiting for the velocity product  couplet to develop.  This seems more pro-active in this case to possibly anticipate earlier tornadic development. -Jake Johnson


66


6

23 Feb 2019 Case – AzShear

The single radar AzShear provides good continuity with persistent mesocyclones. It also highlights well meso handoffs. The single radar AzShear is far superior to the merged product. The merged product does not provide as smooth of a track and suffers from obvious different depictions of the circulation from varying ranges and sample times giving a more blotchy appearance and larger overall signal.

— S Coulomb

AllSky & TPW Check

Did a quick check of the merged TPW and AllSky products and as previously advertised/anticipated, the convection has been riding right along the gradient of the higher instability, but there is some discrepancy as to whether it’s right in the heart of the higher PWATs or along the leading edge, depending on if you’re looking at the AllSky or TPW, respectively. Noticed quite a bit of a latency in the availability of these products (up to an hour), which wouldn’t be good in an operational setting. Compared the values of the TPW and AllSky PWAT with the RAP, and the AllSky matched up much closer to the RAP. However, with the amount of cloud cover in the region (for obvious reasons), the GFS is the predominant data type (basically a model-to-model comparison). Either way, the general idea/trend is helpful if serving as a mesoanalyst in an operational environment.

~Gritty

(CAPE)

(AllSky PWATs)

(Merged TPW)

Hypothetical DSS Decision Support Screen – TAE support of Panama City Music Festival

This is an example how the DSS meteorologist could use RGB imagery, gridded lightning products, CG lightning, and range rings for event support.

In this case – we are a HYPOTHETICALLY supporting the Panama City Music Festival denoted by the 10nm range rings.  Process would be to monitor products to predict when lightning is likely to impact an highly vulnerable population.

Layered TPW Shows Arrival Of Moisture

We’ve been monitoring a boundary on both the KEOX and KEVX radar, likely associated with weak surface convergence per surface obs. 
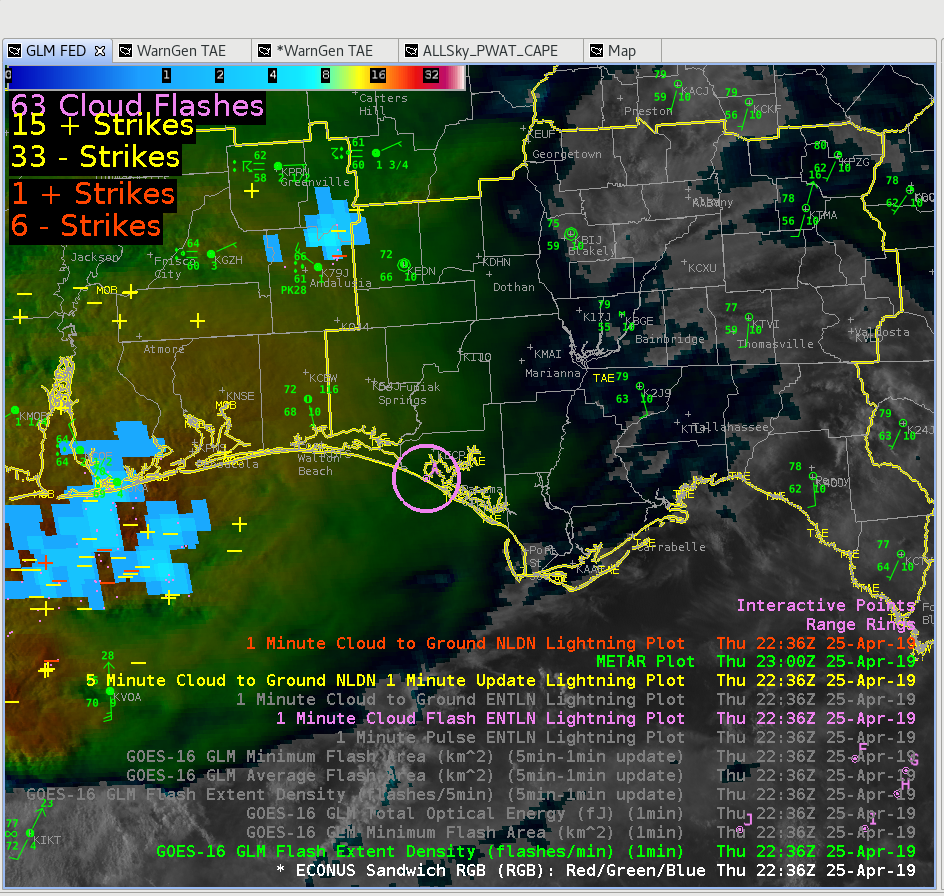
The layered TPW product shows a tongue of moisture approaching the region. It looks like a line of towering cumulus developed over the Gulf of Mexico as this moisture interacted with the convergence line.
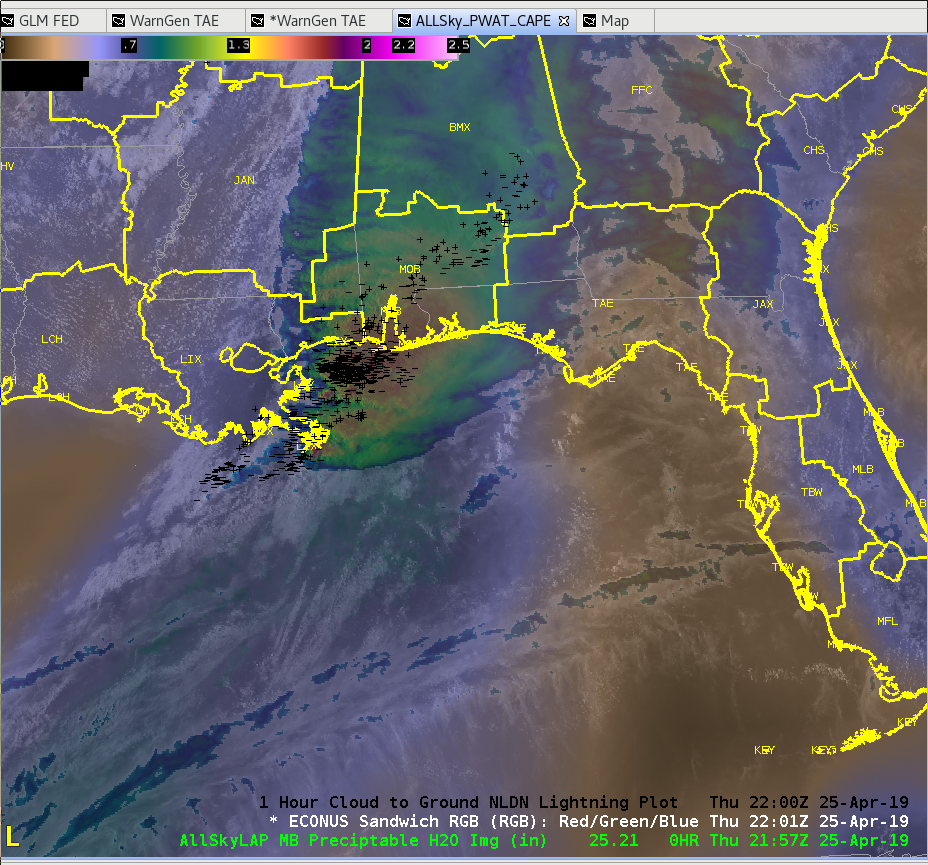
Sandor Clegane

Large ProbSevere Blob

Here is one drawback of ProbSevere that has been briefly discussed. The areal extent of the identification is not based off of some of the features that feed into it, but rather the dBZ reflectivity representation. In this case, for a MCV and line of storms, the blob below is approximately 152 miles long using a center line to calculate the distance. ProbSevere kept this size of storm for two 2 minute calculations before breaking the storms apart into several different identifications.

-Alexander T.

Tracking Meteogram Tool With AzShear

One of the discussion points that has come up about the Merged AzShear product is monitoring the trends of the AzShear as storms progress. One way to do this that is built into AWIPS is the Tracking Meteogram tool. The following are a  GIF and PNG for a MCV just off of the MOB CWA. The radar image is above. The GIF shows the tracking tool and AzShear and then the plot showing the trends. In this case you can see general increase in AzShear values. There are some limitations of the Tracking Meteogram took like only being able to track one feature at a time, there is a lot of things to edit and modify with the Meteogram (the position and size of the tracking area), and this would not be an easy tool to modify and update while trying to focus on other warnings.

-Alexander T.

NUCAPS – Unmodified vs Modified

Compared the NUCAPS sounding today (4/25) over WFO TAE.  See the point evaluated below (labeled point A below):

This is the “unmodified sounding.”  Overall the thermodynamic profile looked realistic.  Looking in the PBL – noticed it was about 2C too warm and about 2C to dry.

This is the “modified sounding.”  As expected, no change to the mid level thermo profile.  The PBL did have the “correction” applied – not the “cliff” in the temp profile.  Overall, I was expecting a more sophisticated PBL nudging scheme.  In reality – it just appeared to force the T/TD from the nearest METAR, with maybe some minor smoothing.  This is something a forecaster could do in about 30 sec – so didnt gain much.

BETTER OPTION:  employ a more sophisticated nudging scheme to the nearest RAP/HRRR.  If you going to modify the sounding – might as well nudge it to a model analysis – which have a long history of being used in severe wx research.