All Sky Severe Environment

Mesoscale analysis is MUCH improved with ALL SKY products. It gives the forecaster a great visual of where moisture advection is occurring in the layered products.  In addition, CAPE and Total PW highlight the more unstable regions with intensifying storms from overlaid region radar data.   -Jake Johnson

NUCAPS Modified Sounding Analysis

Wichita Falls tornadic environmental data using NUCAPS Modified Sounding.  NUCAPS sounding surface data had temp/dewpoint of 73/68, looking at surface obs temp/dewpoint range near the NUCAPS point sounding was 74-76/69-70.  Therefore modified numbers were in the ball park.

NUCAPS 700-500mb Lapse Rate Gridded Product did a decent job with mid lapse rates across southwest Oklahoma showing a favorable environment for severe thunderstorms.


Wide angle view of GLM


This wide view of GLM shows the typical small number of very large flashes in the trailing stratiform region across KS and MO. Smaller more numerous flashes, also brighter in TOE exist along the front across central OK into northwest TX. The more discrete cells along the stationary front in southern MO are also evident with the greater flash rates, smaller flashes and brighter appearance in TOE.

GLM FED (UL), AFA (UR), TOE (LL), RALA (LR)

— S COULOMB

GOES-W & GOES-E GLM comparison


Looking at GLM for GOES-W in Full Disk (L)  and GOES-E in meso sector (R) the flash extent density and average flash area compare well to one another. Max FED values were 62 and 64 fl/5-min respectively. They also showed similar overall footprint with even the smallest flash values. Parallax is obvious with the peak  values separated by ~15 mi at this longitude.

GLM FED from GOES-W full disk (UL), GLM FED from GOES-E meso sector (UR), 10.3 um from GOES-W full disk (LL), 10.3 um from GOES-E meso sector (LR)

— S Coulomb

CPTI in Ranges for Analysis

CPTI product shows very little change in the probabilities from one level to the next, therefore i recommend doing ranges with this analysis.  This should highlight the threshold ranges of interest in a better way.

For example:  Cat 1 (80-110mph), Cat 2 (125-155mph), Cat 3 (170+ mph)

-Jake Johnson


Cell merger – AzShear, CPTI and DMD comparison

Gonna take a look at SC merger  noting two small SC storms WNW of KINX radar @ 2058UTC. Prob TOR with these storms ~ 25% at this time with generally weak AzShear with stronger northern storm.

2106 UTC – just before storm merger see uptick in Azshear (0-2 km) with slight increase in CPTI products (50-52 %).  DMD output not providing any useful information on these storms at this time probably.  ProbTor ~ 10%

After merger @ 2114 UTC although not much change in AzShear, CPTI probabilities do increase some to 55 to 60%. Note that only the XDMD mesocylone algorithm displays a mesocyclone icon at this time while legacy DMD products do not.

2126 UTC – ProbTor rapidly increased to 77% with marked increase in AzShear. CPTI products also near 70% (110 mph).  Now all three DMD products display icon by this time.  BUT the XDMD seemed to identify mesocyclone sooner than legacy products.  This was encouraging.


2142 UTC – looks like storm looses organization as inflow may have been disrupted. AZshear becomes elongated with CPTI values falling notably.   Encouraging to note the character of AzShear (became elongated ) was consistent with the less organized storm (velocity structure).  ProbTor falls to ~ 65%.  Note the xDMD algorithm did still correctly identify shear couplet (SRM not shown) where legacy algorithm fails.   XDMD performed much better and and had greater temporal continuity than legacy product in this example. In this more complex storm interaction example appeared XDMD was able to better identify and retain areas of shear/rotation compared to legacy.

-Quik TWIP


NMDA

It can be a bit hard to see from the color scale, but take a look at the bottom left screen. The NMDA is shown there. One thing that I have noticed about it is it was able to better track the Mesocylone compared with the normal one. However, I have not gotten to test this extensively yet.

Notice in the time-step below that the NMDA is the able to hold onto the mesocyclone when the normal one cannot.

South Beach

CPTI and Azshear

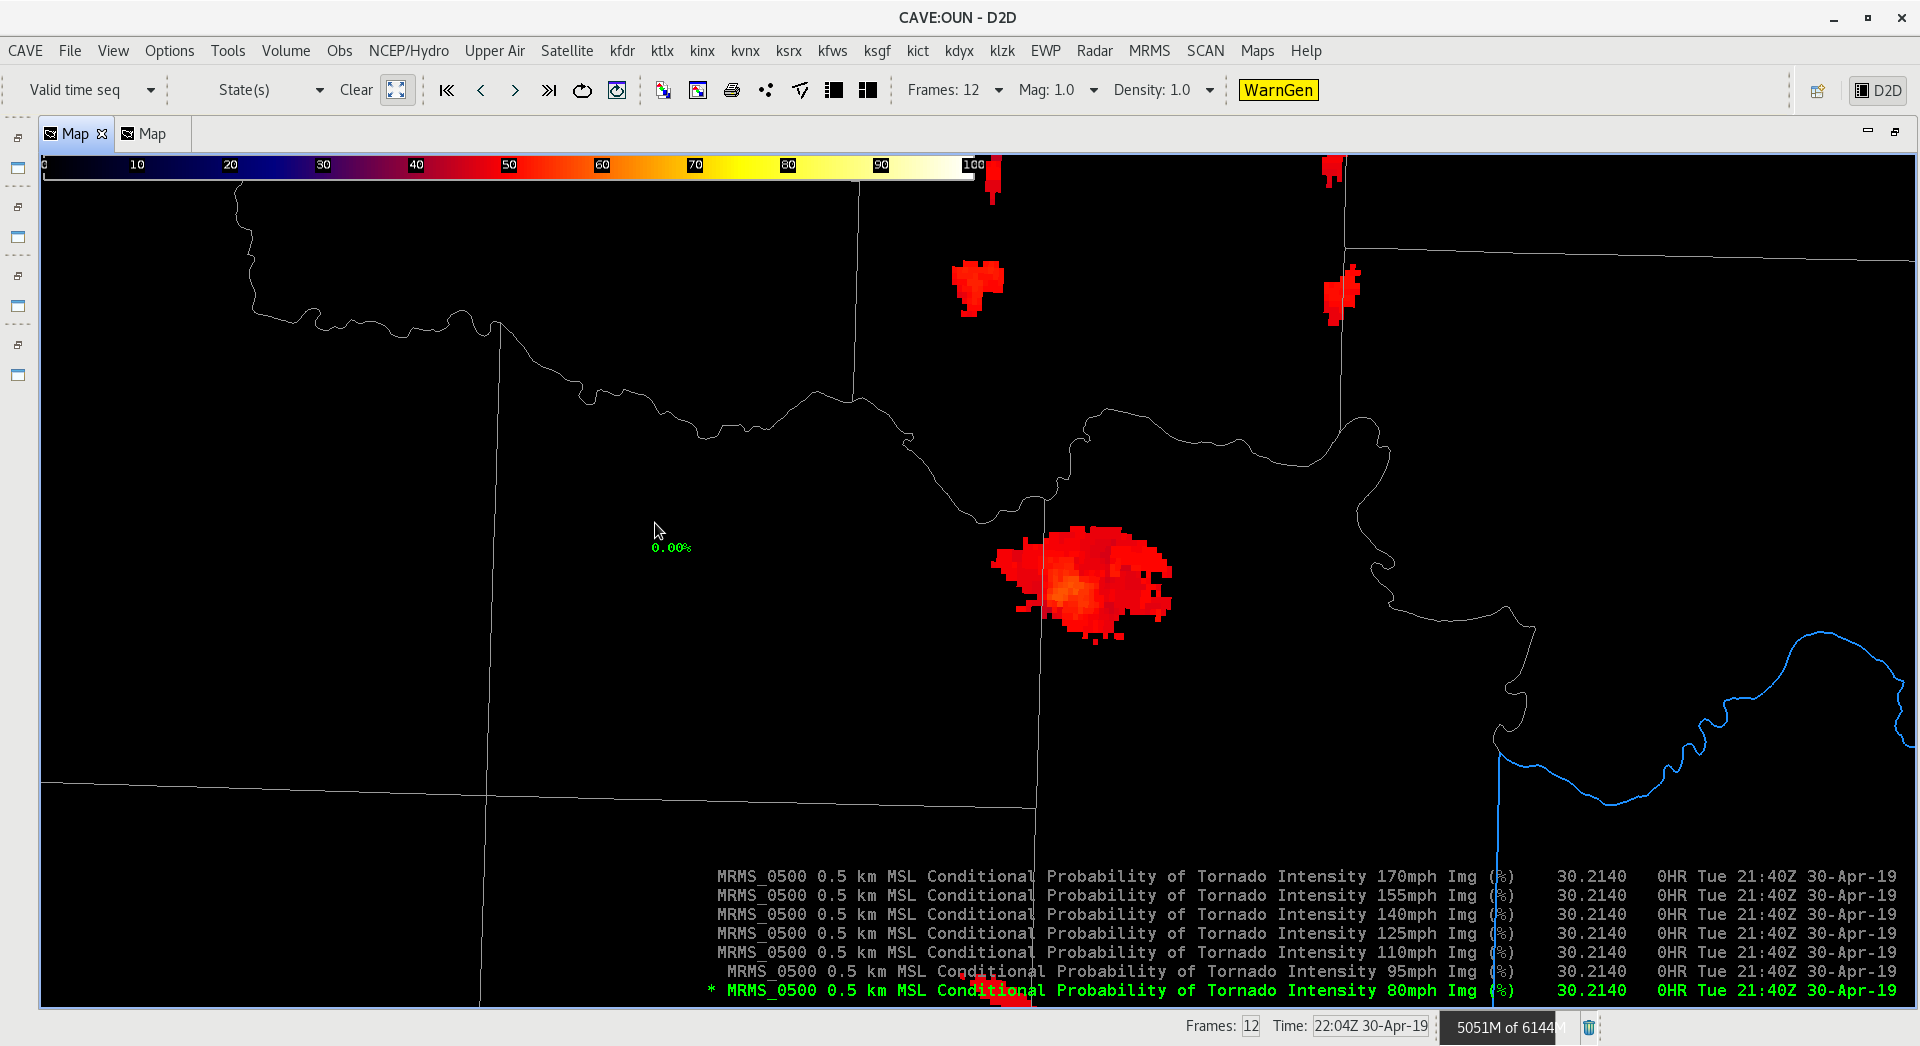
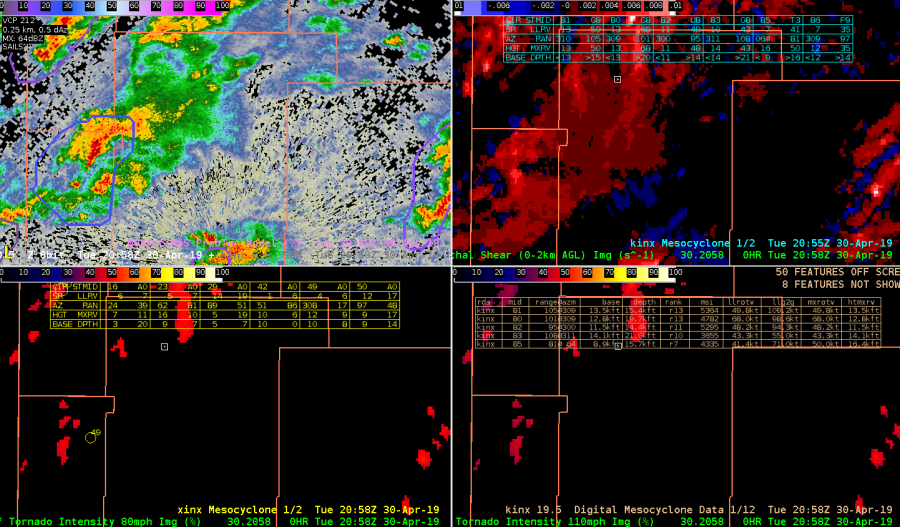
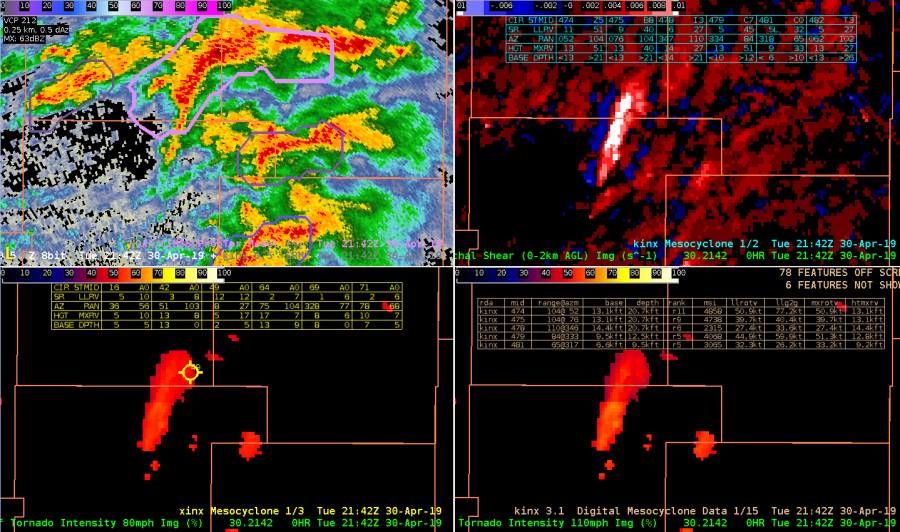
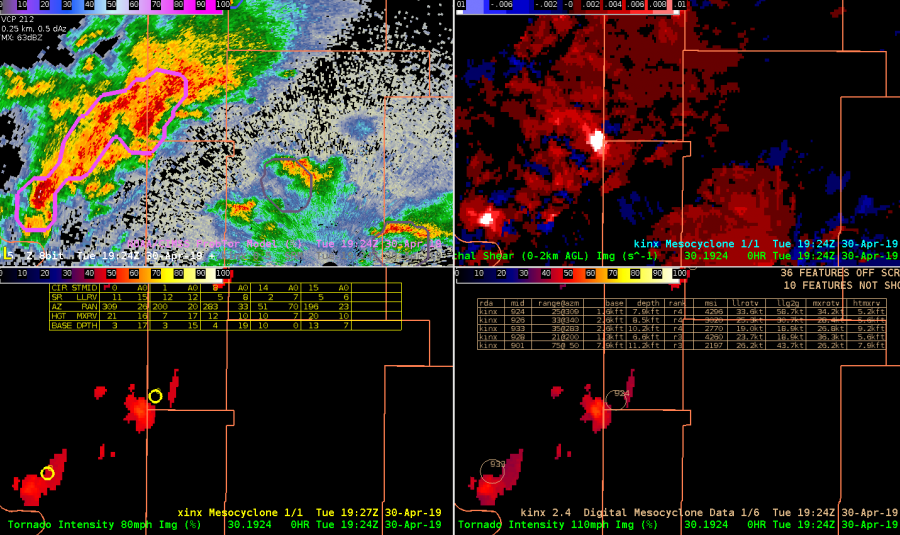
Tracking this northern most SC @ 1926 UTC prior to tornadogenesis.  Azshear 0-2 km product did a nice job highlighting shear with developing storm very early on in storm evolution and was very persistent in highlighting area of shear throughout.  Temporal continuity was very good.  Lower two panels are 80 and 110 mph intensity probabilities.  Used this 4-panel to monitor evolution.  Also displayed is legacy mesocyclone (upper-right), DMD (lower right) and XDMD l(lower left).  This SC also exhibited well-organized ZDR arc and KDP foot (not shown) that whose centroids were normal to storm motion suggesting MC intensification was likely.

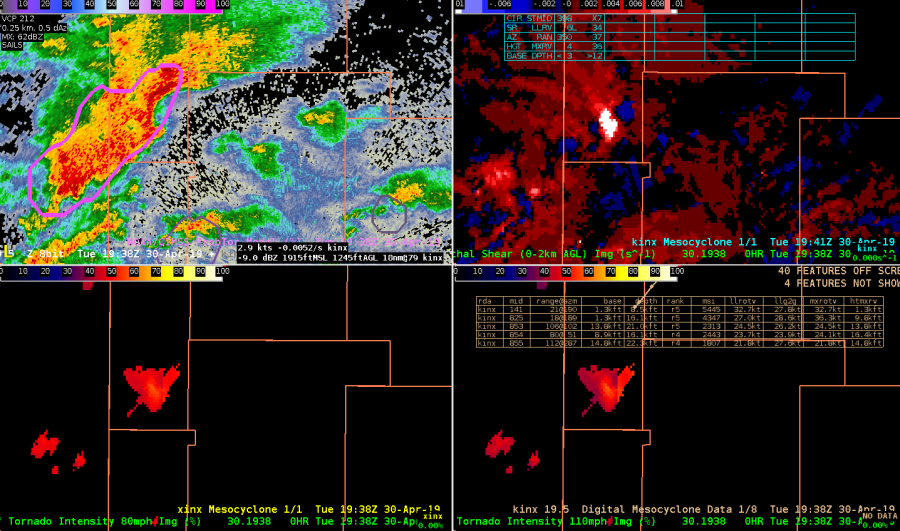
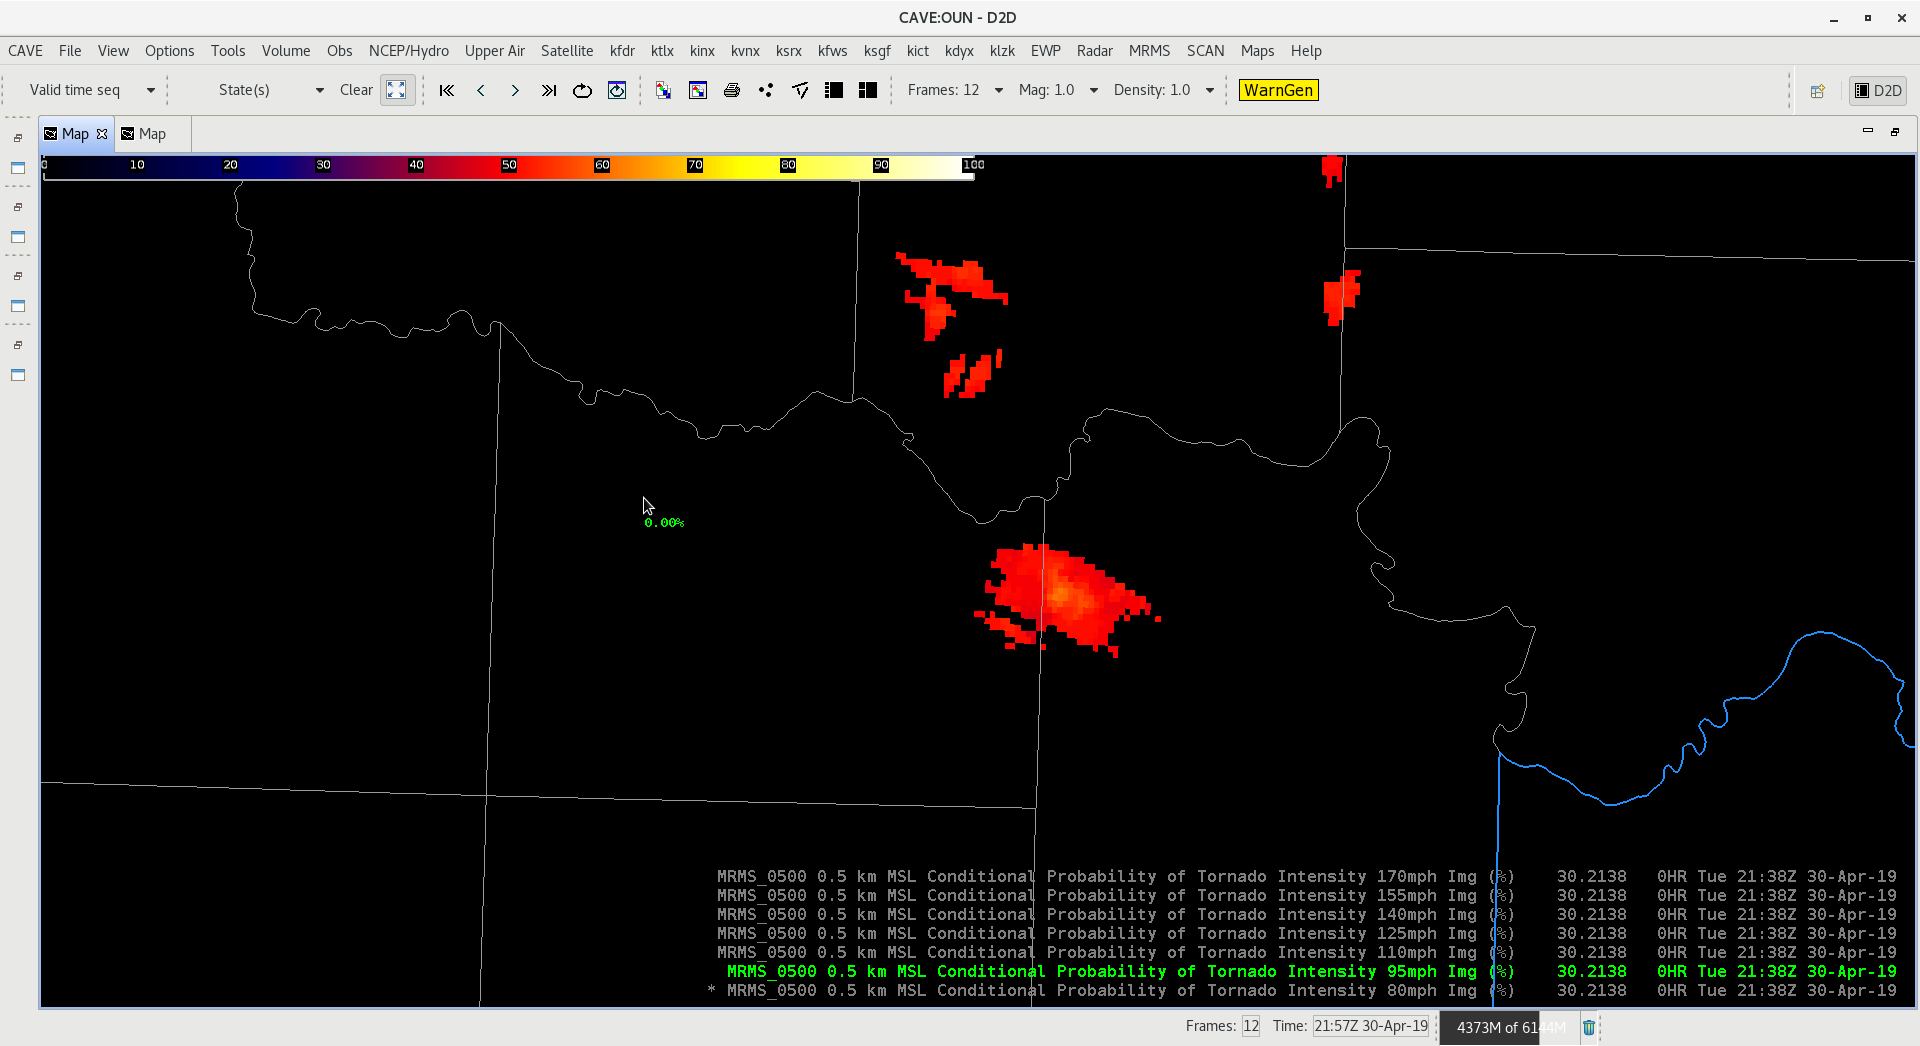
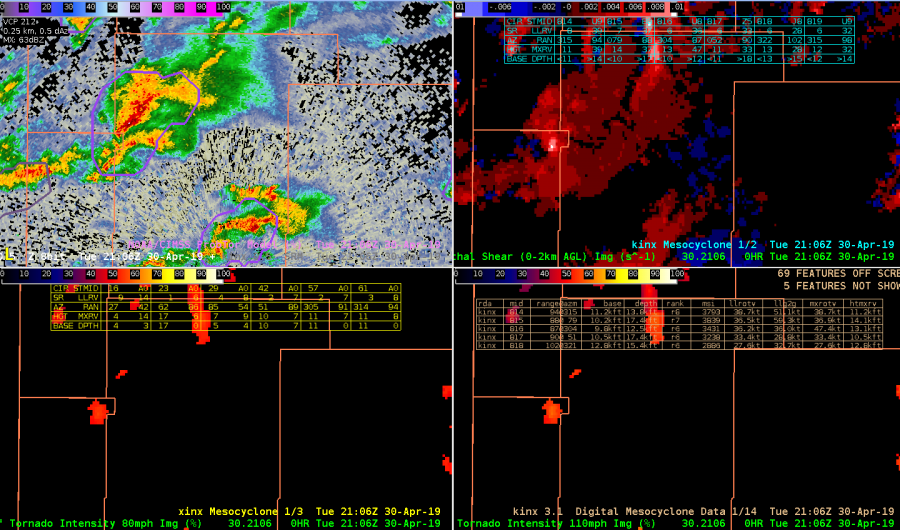
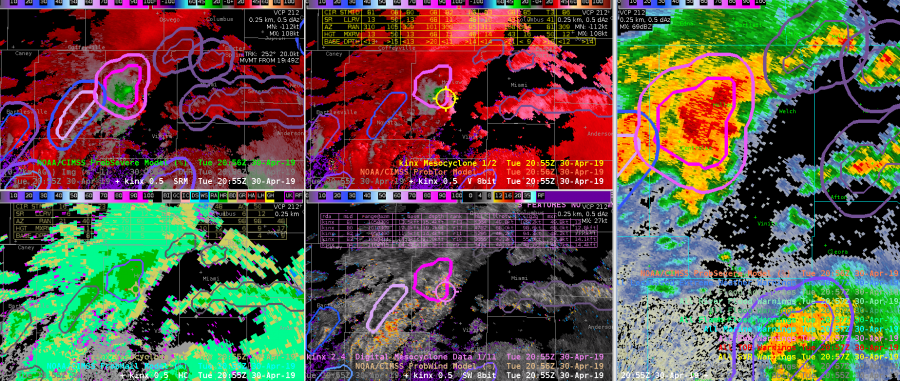
1938 utc Azshear still showing strong signal with CPTI gradually increasing to near 60%.  ProbTor increased to 78% as well.  DMD, XDMD and MD not showing much and did not seem to be very helpful.


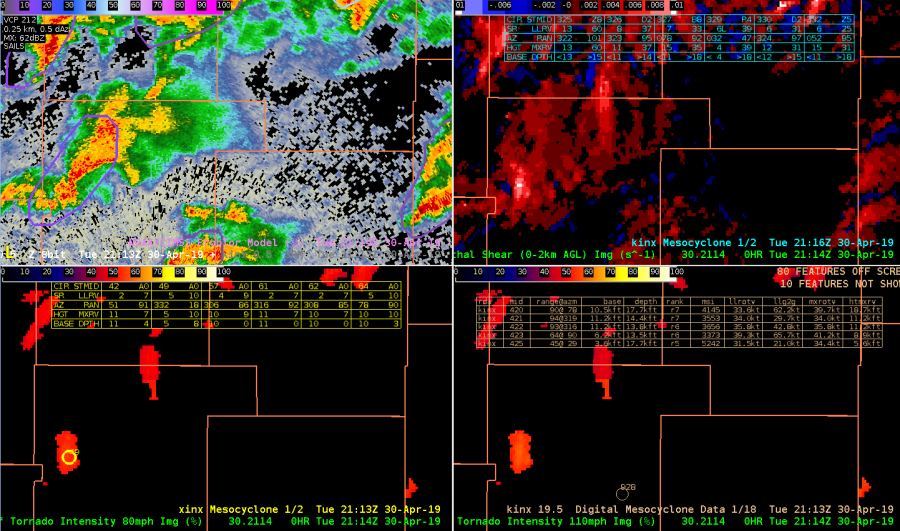
CPTI was insightful with increasing probabilities of tornado intensity probabilities at higher speeds (110 mph lower right).   Note that XDMD was also indicating MXRV of 26.


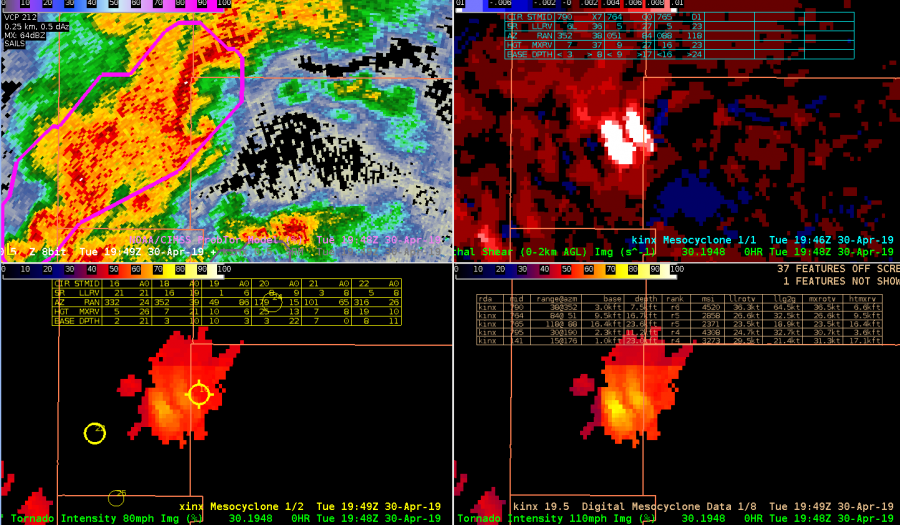
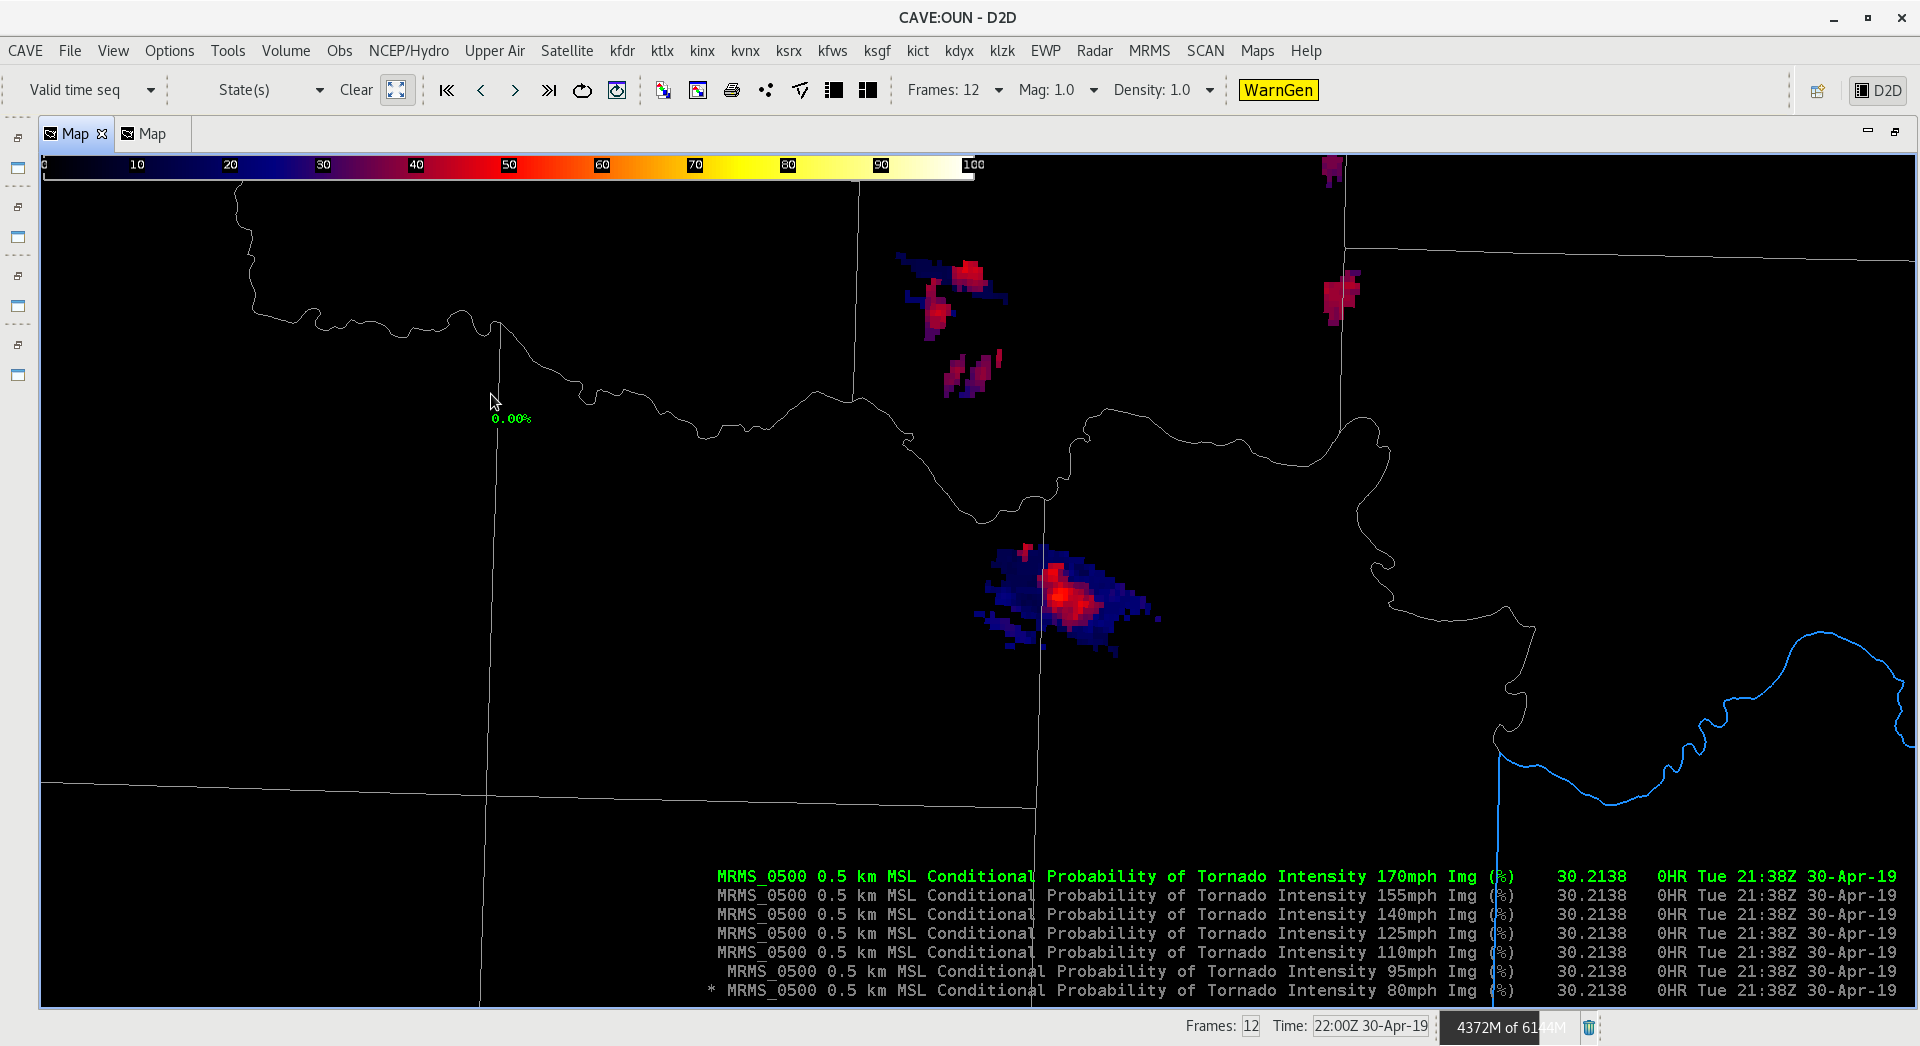
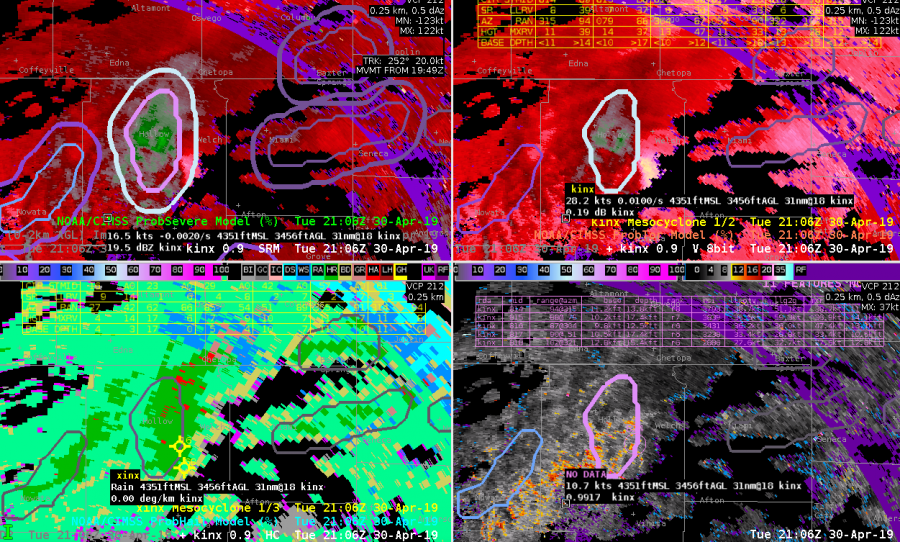
1448 UTC – would occasionally see dual maxes in AZShear and CPTI products that was a bit of an issue at times.

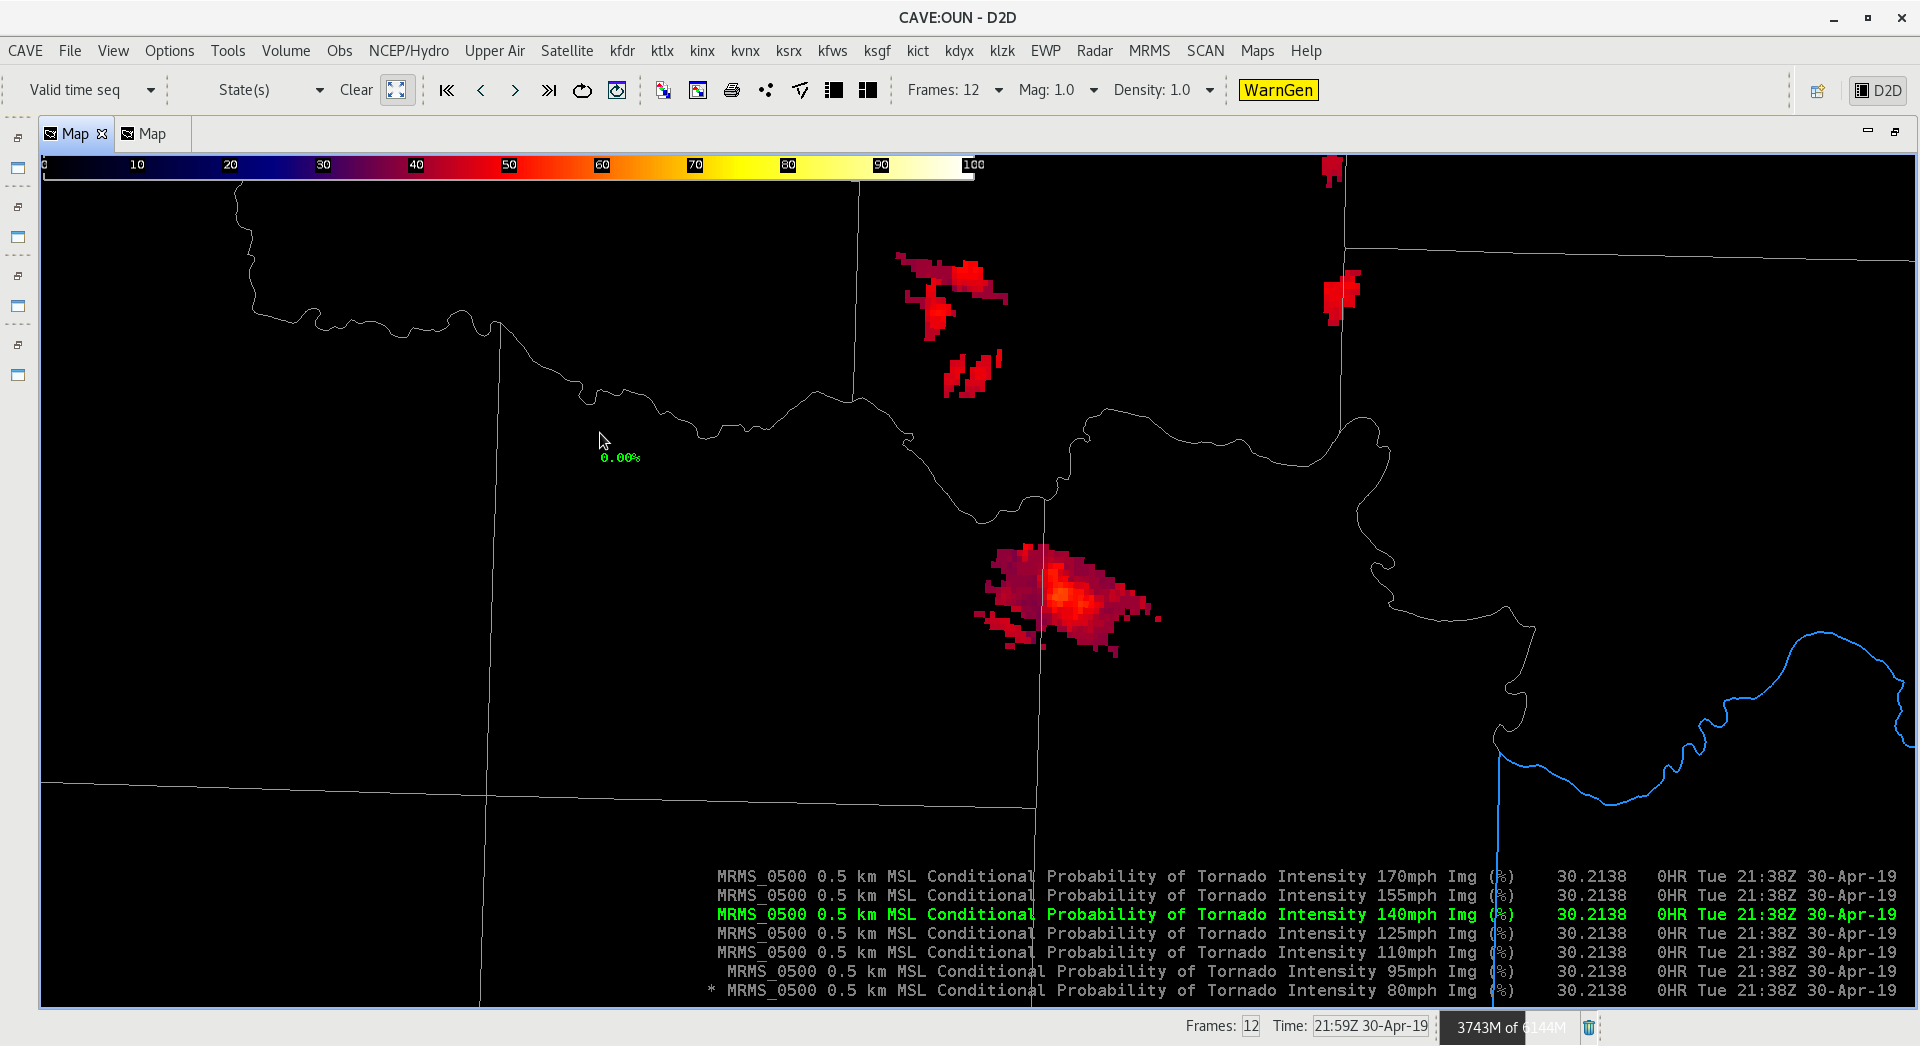
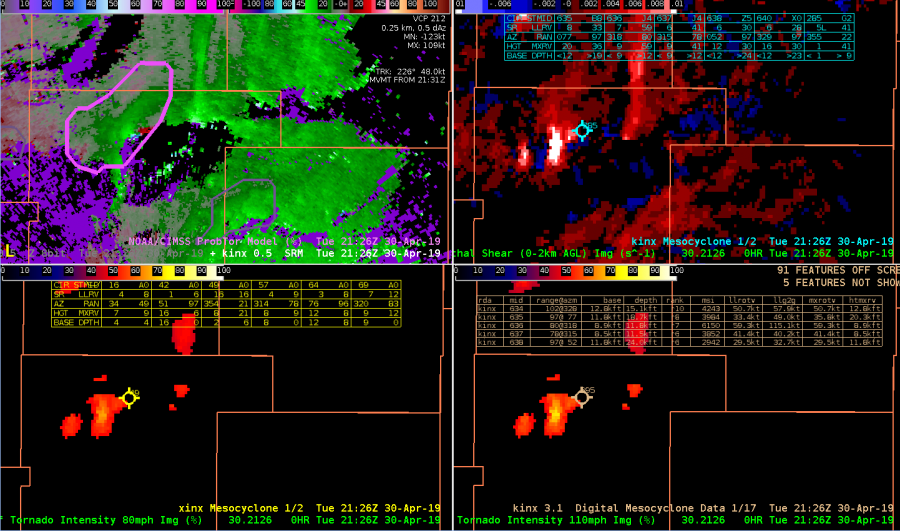
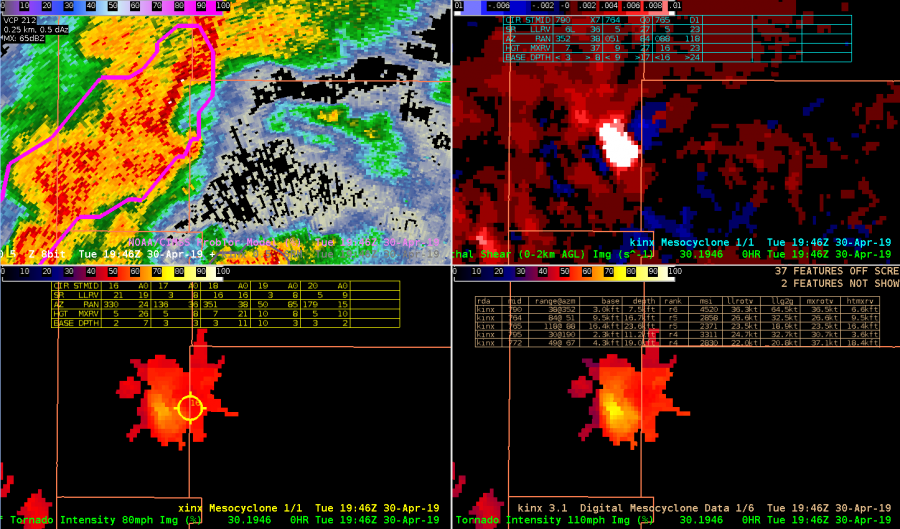
CPTI 110 probablities up to ~ 75 % at this time (lower right)

Overall…0-2 km Azshear was quite helpful in quickly grabbing attention to areas of concern.  0-2 km product was temporally very consistent.  Its location relative to developing Mesocyclone was typically off…but still very useful.    XDMD, did seem to perform better than legacy DMD products but not much at least with this storm.   Early in storm evolution, examining ZDR/KDP centroids relative to storm motion was also helpful as a reality check on MC intensification and increasing SRH with this particular storm.  Bottom line was generally pleased wiith  AzShear and CPTI performance for this storm. – Quik TWIP