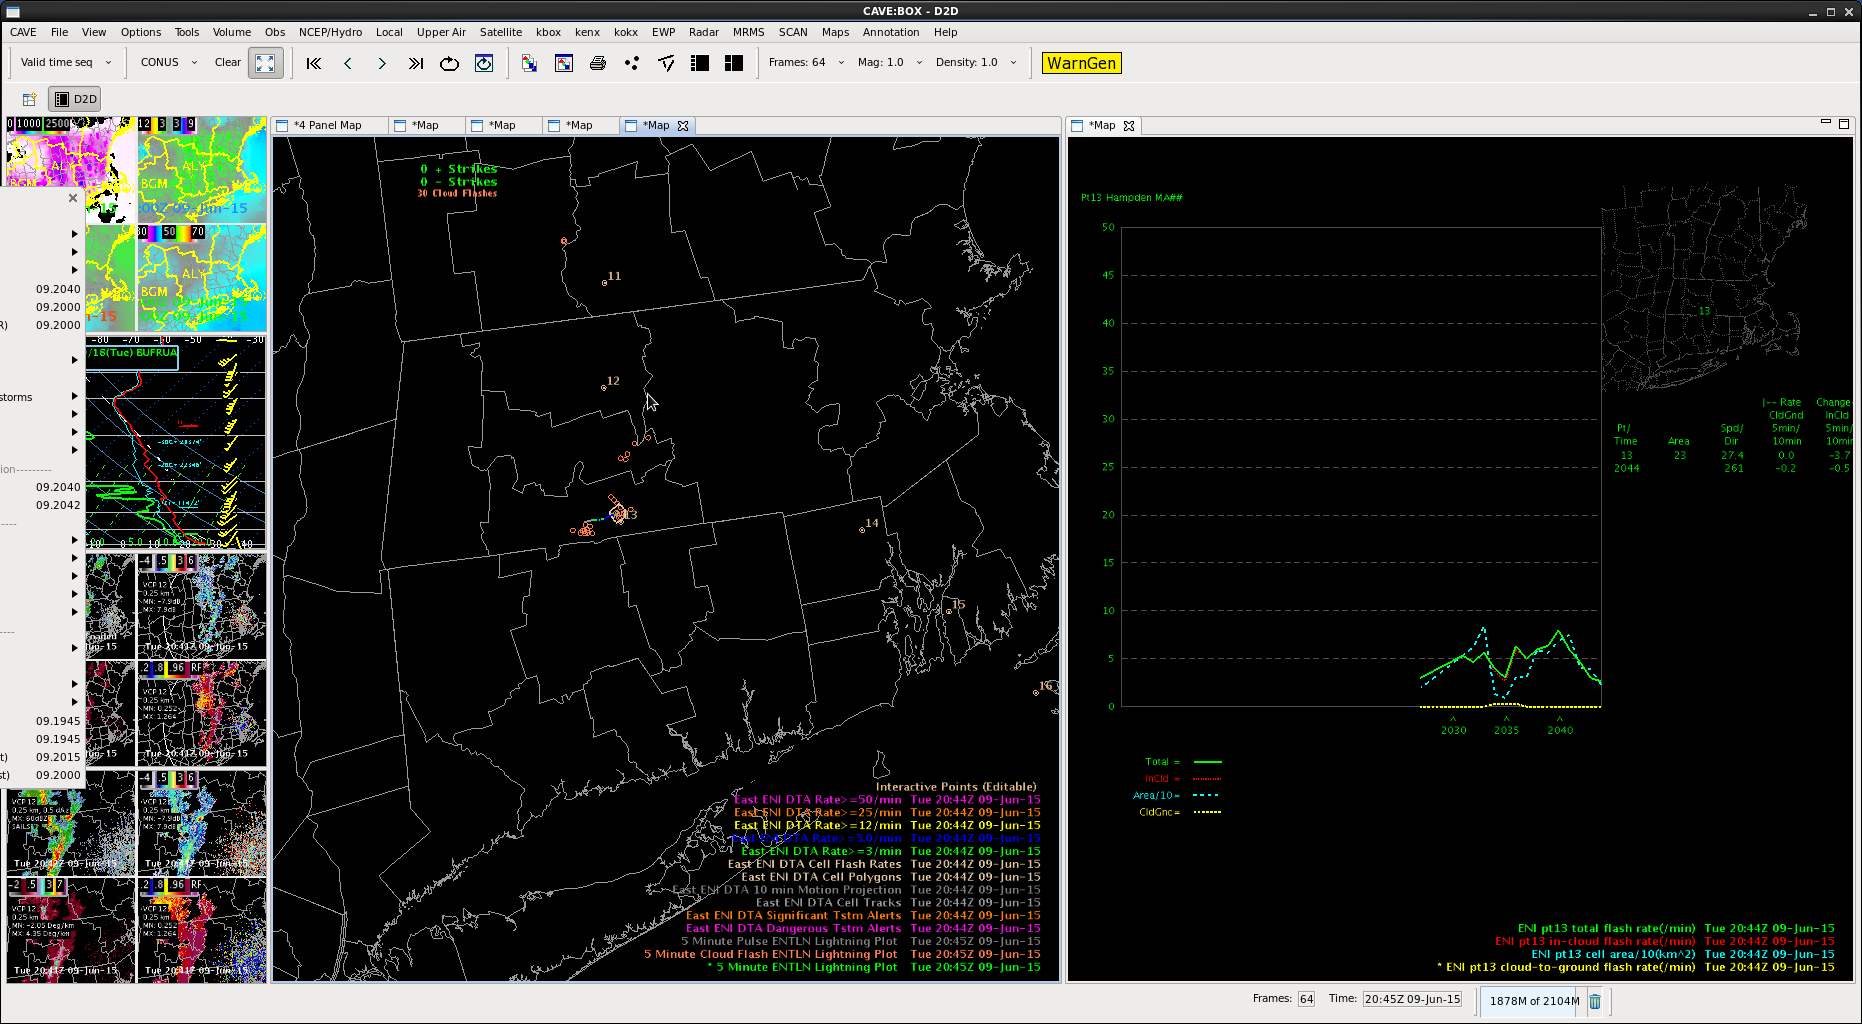
Here is a possible way to display the ENI total lightning data and points to select a time series in the panel to the left and then the resulting time series to the panel to the right, so both are visible. Here my selected point 13 and total lightning plot is what generated the times series for point 13. MrSnow