SVR 2247UTC in MAF

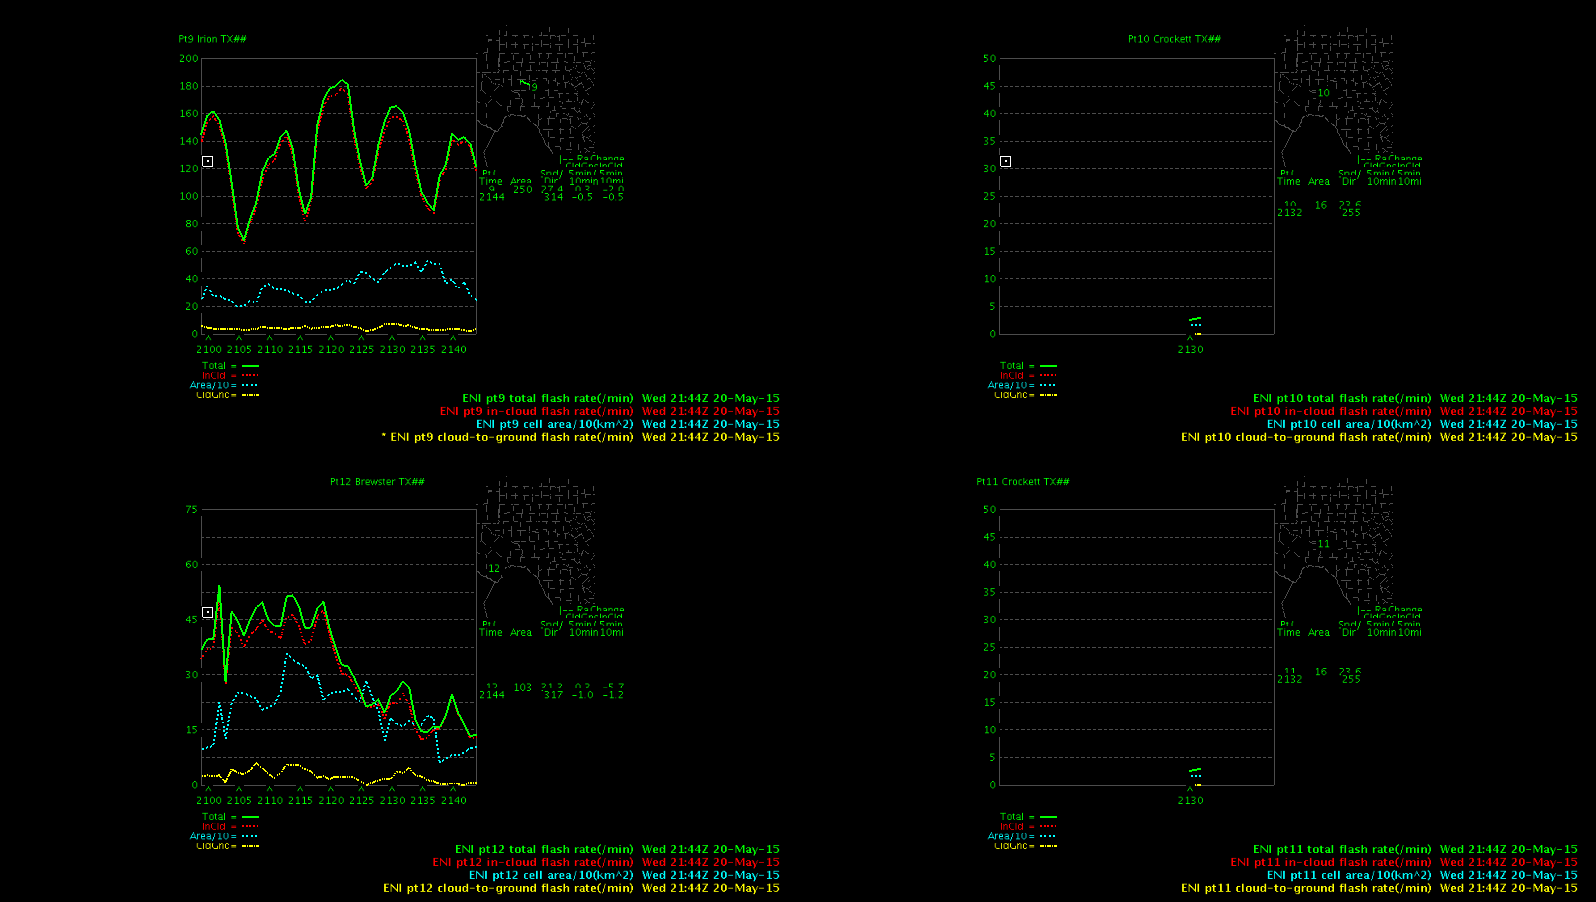
I was considering issuing a warning for a storm in Pecos County when an unconfirmed  report of 1″ hail came in at 2232UTC. The ProbSevere was climbing with a value of 80% at the time and 1.02″ MESH. ENI Alert indicated a Significant Thunderstorm. A look at the ENI total flash rate time series the report came in during the lightning jump. This was borderline  at the time based on totality of data, so may have decided to wait. The storm did continue to intensify after I issues the warning.

-snowstrm

ProbSevere2236

ENI2251

Tags: None

Pulse Storms: The Wheat from the Chaff w/ProbSevere and ENI Ltg Data

Dear Diary,

Today we had many showers and storms across the area for hours. The storms never reached severe criteria and were pulse in mode.  However, one cluster did quickly grow and was the strongest of the afternoon thus far at ~2215Z.

Prob Severe Model ramped up from 14-57-91% over 8 minutes, while lightning jumped from 16 to 50/min in that same time frame. It drew my attention for further evaluation (see the loop and the storm to the northeast of the RDA). Radar evaluation said WARN for the first scan, but quickly the reflectivity values lowered in the next, owing to the pulse mode we had seen all afternoon.No warning was issued.

SA: Both the ENI ltg flash rates plan view data and time series, and the Prob Severe led to great SA to evaluate that storm further.

Rocky.

2225Z_PulseStorms 2231Z_ENI

Tags: None

MAF NUCAPS example

0520 MAF NUCAPS

Indicates near-surface conditions 32/10, the most exaggerated instance seen so far of being too warm at that level.
This NUCAPS sounding is very near KE38 observation of 26/14, which is fairly representative for the southern part of the CWA at that time

When sounding adjusted to KE38 current conditions, it looks very reasonable and yields CAPE of 2800.

-Holaday

Tags: None

4-Panel ENI Time Series

I appreciate the option to track four different cells in the ENI Time Series. If you ware watching multiple cells you don’t need to call each one up separately. In busier situations where you may be switching the cells being monitored it seems like it would be confusing to keep track of which cell is in which window. The cell tracking is plotted on a map in each of the four windows, but it is not easy to see.

-snowstrm

4PanelTimeSeries

Tags: None

A2 Lightning Training Ideas

Because lightning data in A2 has taken a larger step forward in recent builds, a more thorough training is needed for NWS forecasters. Some ideas on what that package could contain (~2 hours):

1) Foundation: Networks, Pulse v Flash v Strike, Gridded
2) Scientific Research Review: Data Signals and Sensible Storm Outcomes
– Severe Storms (e.g., jump)
– Winter Season Uses?
3) A2 Data: Menus and Products, Definitions (ENI Polys & Tracks, Density), Latency, Display Tips
4) The future: GOES-R mapper, Future A2 data

Rocky

Tags: None

MAF CI and Cirrus

Watch southern Brewster County (south of mature storms in center of image) as cirrus spreads over CI objects.  Appears to be an example of the dropout.
Expecting that more, thicker cirrus spreading in from Mexico will limit utility of CI elsewhere in the CWA in the hours to come.
Click to animate0520 MAF CI

-Holaday

Tags: None

Utility of GOES Superscan to visualize vertical wind shear and individual cell development

The 1 minute temporal resolution allows for visual tracking of individual small convective cell development. (first image) This details in not as easily detected in the 15 min typical visible satellite imagery…because the vertical development gets disconnected from the low-level feature kin that time span.

It is also easier to visualize the shear. In the example below…you can see the se low-level flow advecting the 2500-3500 ft cu Nw…as depicted in the 18z ruc sounding. This flow then veers to the west as you go up to 600 mb (15000ft)…which is seen in the blow off of the towering cu to the east.

GOES R EWX 2045


18z ruc ewx

Pickles

Tags: None

SVR at 2006UTC and 2032UTC in MAF

In this case the ProbSevere (99%, 1.51 MESH, Strong vertical growth rate), ENI Dangerous Storm Alert, and ENI Lightning Time Series (with  jump from aprroximately 55 to 104 in 5 minutes) all pointed toward issuing a Warning. In retrospect, data in the 10 minutes leading up to this time all pointed toward cell becoming severe, so could have issued the warning earlier.

-snowstrm

Screenshot-CAVE:MAF - D2D -5  LightningJ

Lightning continued to increase (overall) as indicated in the latest chart below. ProbSevere at 2030UTC MESH was up to 2.93 inches. Storm took a right turn and ENI Motion Projection looked pretty good, so was helpful in constructing my warning polygon. Issued a new warning with larger hail and stronger winds.TimeSeries

Screenshot-CAVE:MAF - D2D

Verification: 1.75″ hail reported by a trained spotter at 2040UTC 6NE of Stiles in Reagan County.

Tags: None

CI utility in congested cu fields


CI utility in an environment with abundant Cu development appears to be more in deciphering general timing of convective intiation across the entire area. The algorithm has trouble latching onto individual cloud elements and therefore groups together many individual cu features together…washing out the signal on development of individual pulse convective cells. This overall result in a very pulsey and blotchy CI pattern from scan to scan…which is hard to utilize for targetting individual cell development. Once the cu begins to tower and glaciation takes place the algorithm drops tracking the feature all together…adding to the pulsey nature of the CI algorithm imagery.CI EWX 1945z

Pickles

Tags: None

Trackable Boundaries Better Seen in GOES 1min Imagery

Two boundaries were evident over southern TX that had direct effects on the cumulus field, suppressing it, as it passed through. No evidence of a wind shift occurred with these boundaries.

The north-south boundary began in west TX earlier in the day and continued to move east. The W-E boundary is believed to be an old outflow boundary shifting south.

Rocky

1minGoesVis 1minGoesVis

Tags: None