I issued my first warnings today on storms that I have been watching. I watched the Prob Severe product for awhile and saw the storms grown from10% to above 50% and had MESH growing from .08″ to 1″ and above. That is when I issued the warnings. I created the polygons based on watching the radar loop and so far the western polygon warned area verifed with 1″ hail in Urbana. Hopefully the other one does too! ~Vollmar
Month: May 2014
EWP Operations Update – Tuesday 5/20 – 4:40pm
Both CYS and DVN domains are contained within Severe Thunderstorm Watches and have warned storms ongoing. Right now large hail is the main threat with these storms and our student volunteers are hard at work forwarding reports to our forecasters. We’ll be moving the LAPS domain into the DVN region shortly.


-Darrel Kingfield
EWP Week 3 Coordinator
NearCast Supports Weakening
The gradient of theta-e difference remains in eastern WY. Storms have developed and moved east across this convective instability gradient producing marginally severe hail. Throughout the day the NearCast model indicated the convective instability weakens across the NEb panhandle. Below is an email with two supercell moving across the convective instability axis. The lead supercell is currently weakening and also moving out of the instability axis.
First impressions with the new tracking tool.
First impressions with the new tracking features. graphs next to the tracking bar in the meteogram may need to be more editable. In this case were were able to zoom out of the Y axis allowing dBZ to show up as a more usable function. However it still is lacking some standardization of axis that is more common from other programs functions like Excel and Powerpoint graphs. Perhaps finding a way to automatically load a standardized graph when certain meteorological fields show up. (dBZ, VIL, CC, etc..)
Also of note. Shortly after zooming out on the axis…. other panes that were on screen where not accessible for a very long time . Probably 5 to 10 minutes while writing this blog.
Grant H.
LAPS Theta-e vs. NearCast Theta-e Difference
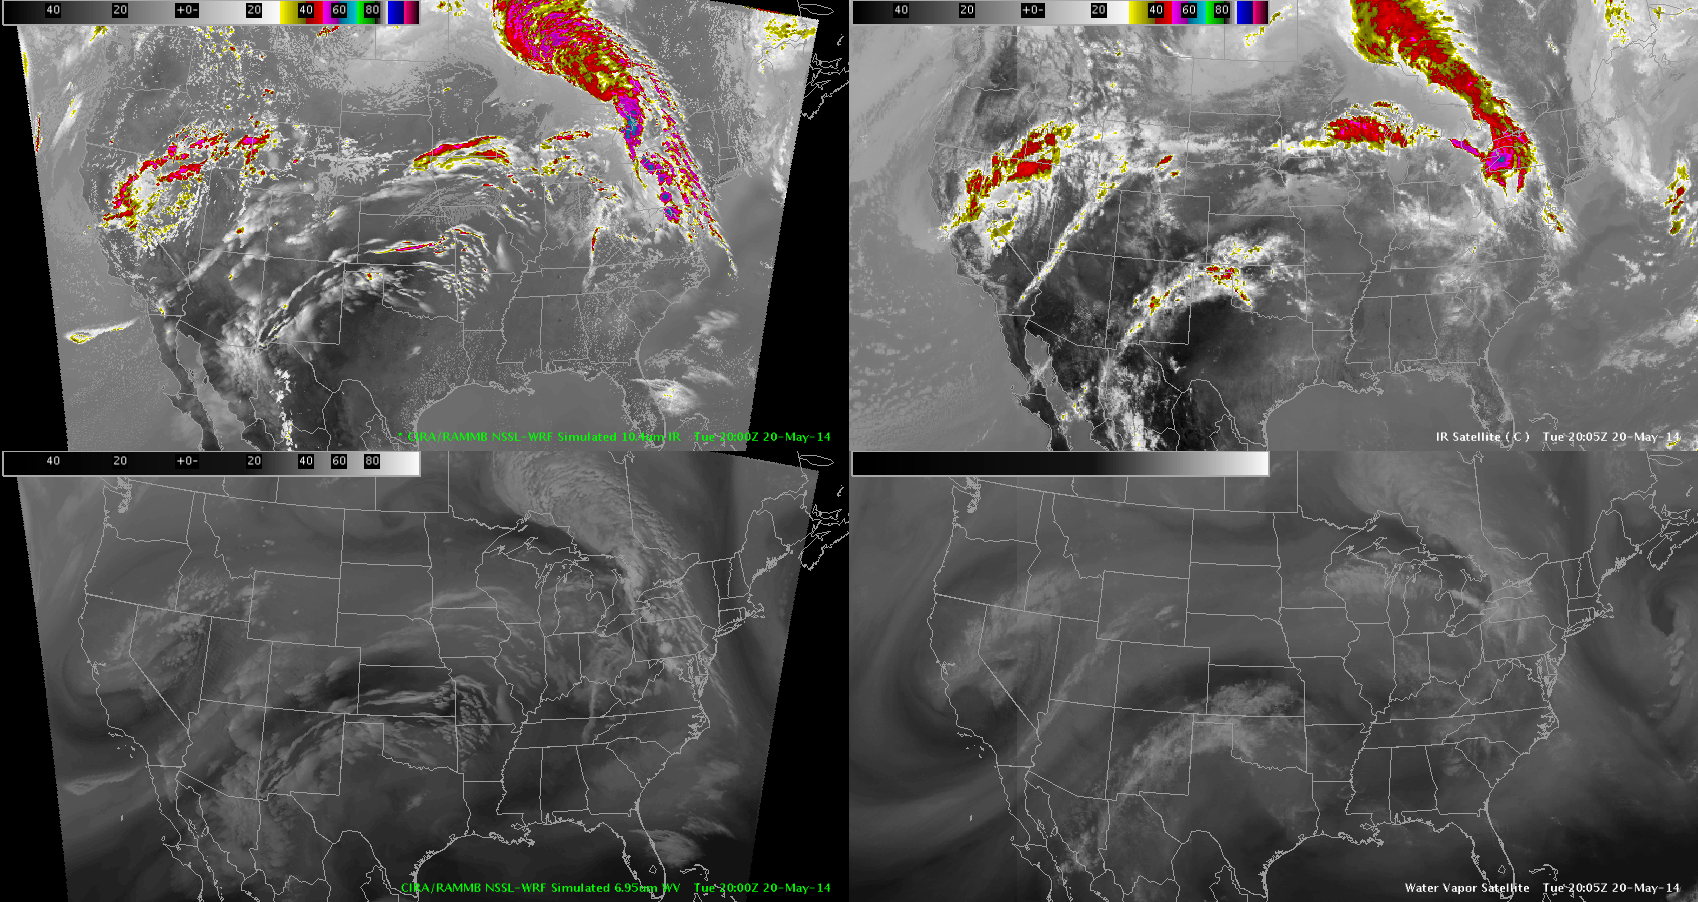
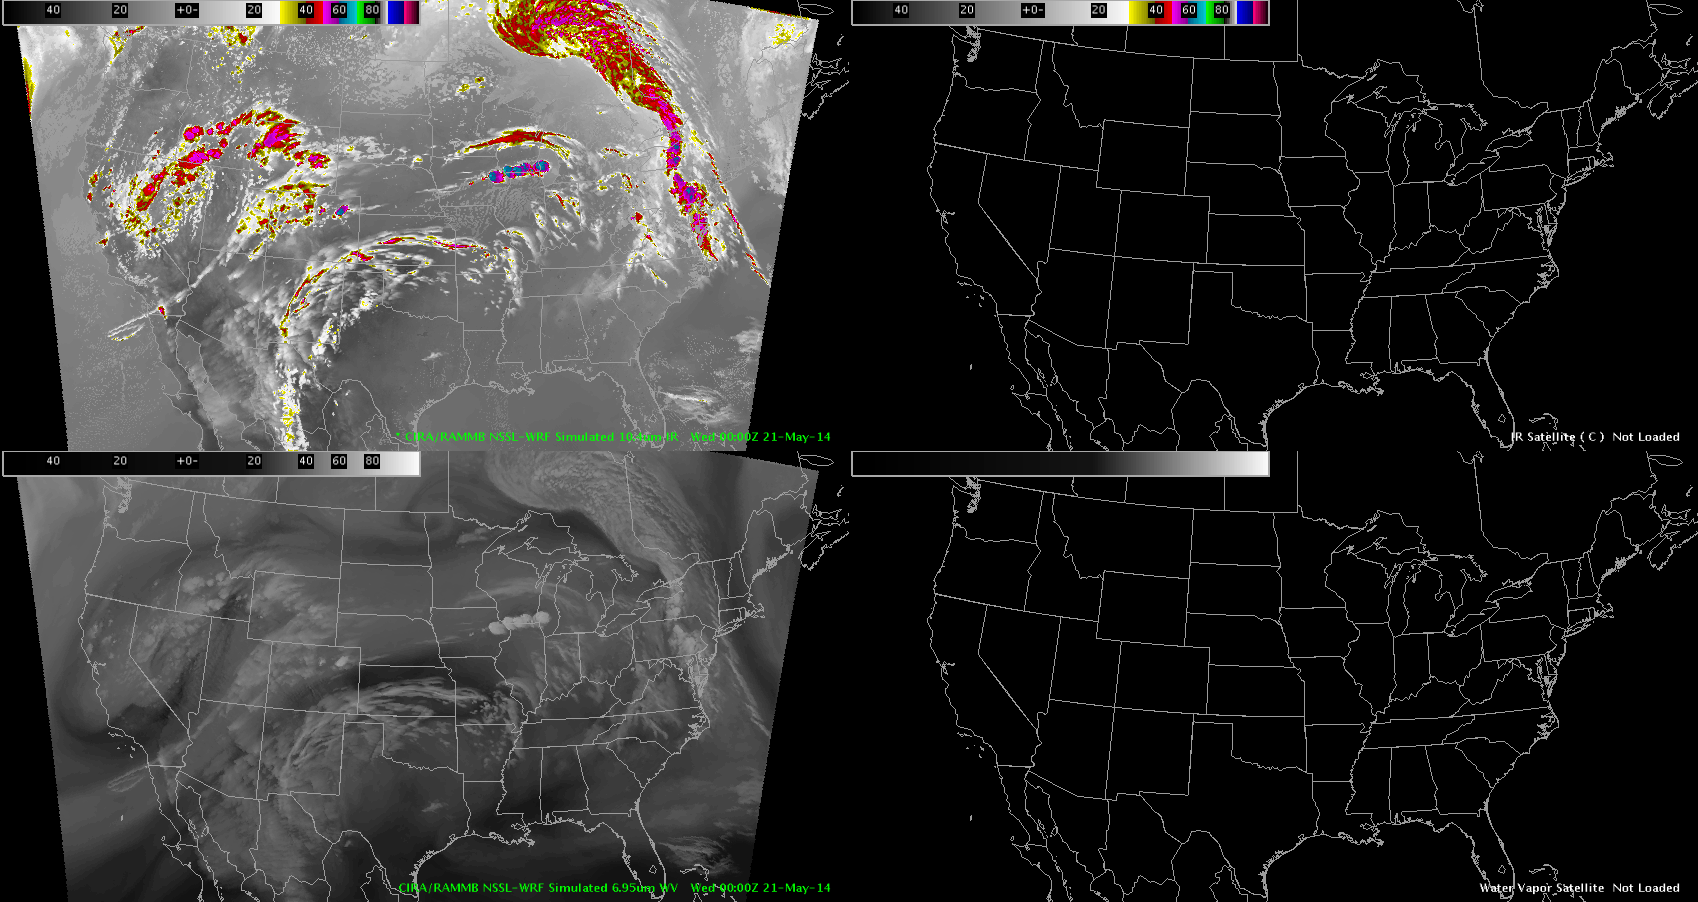
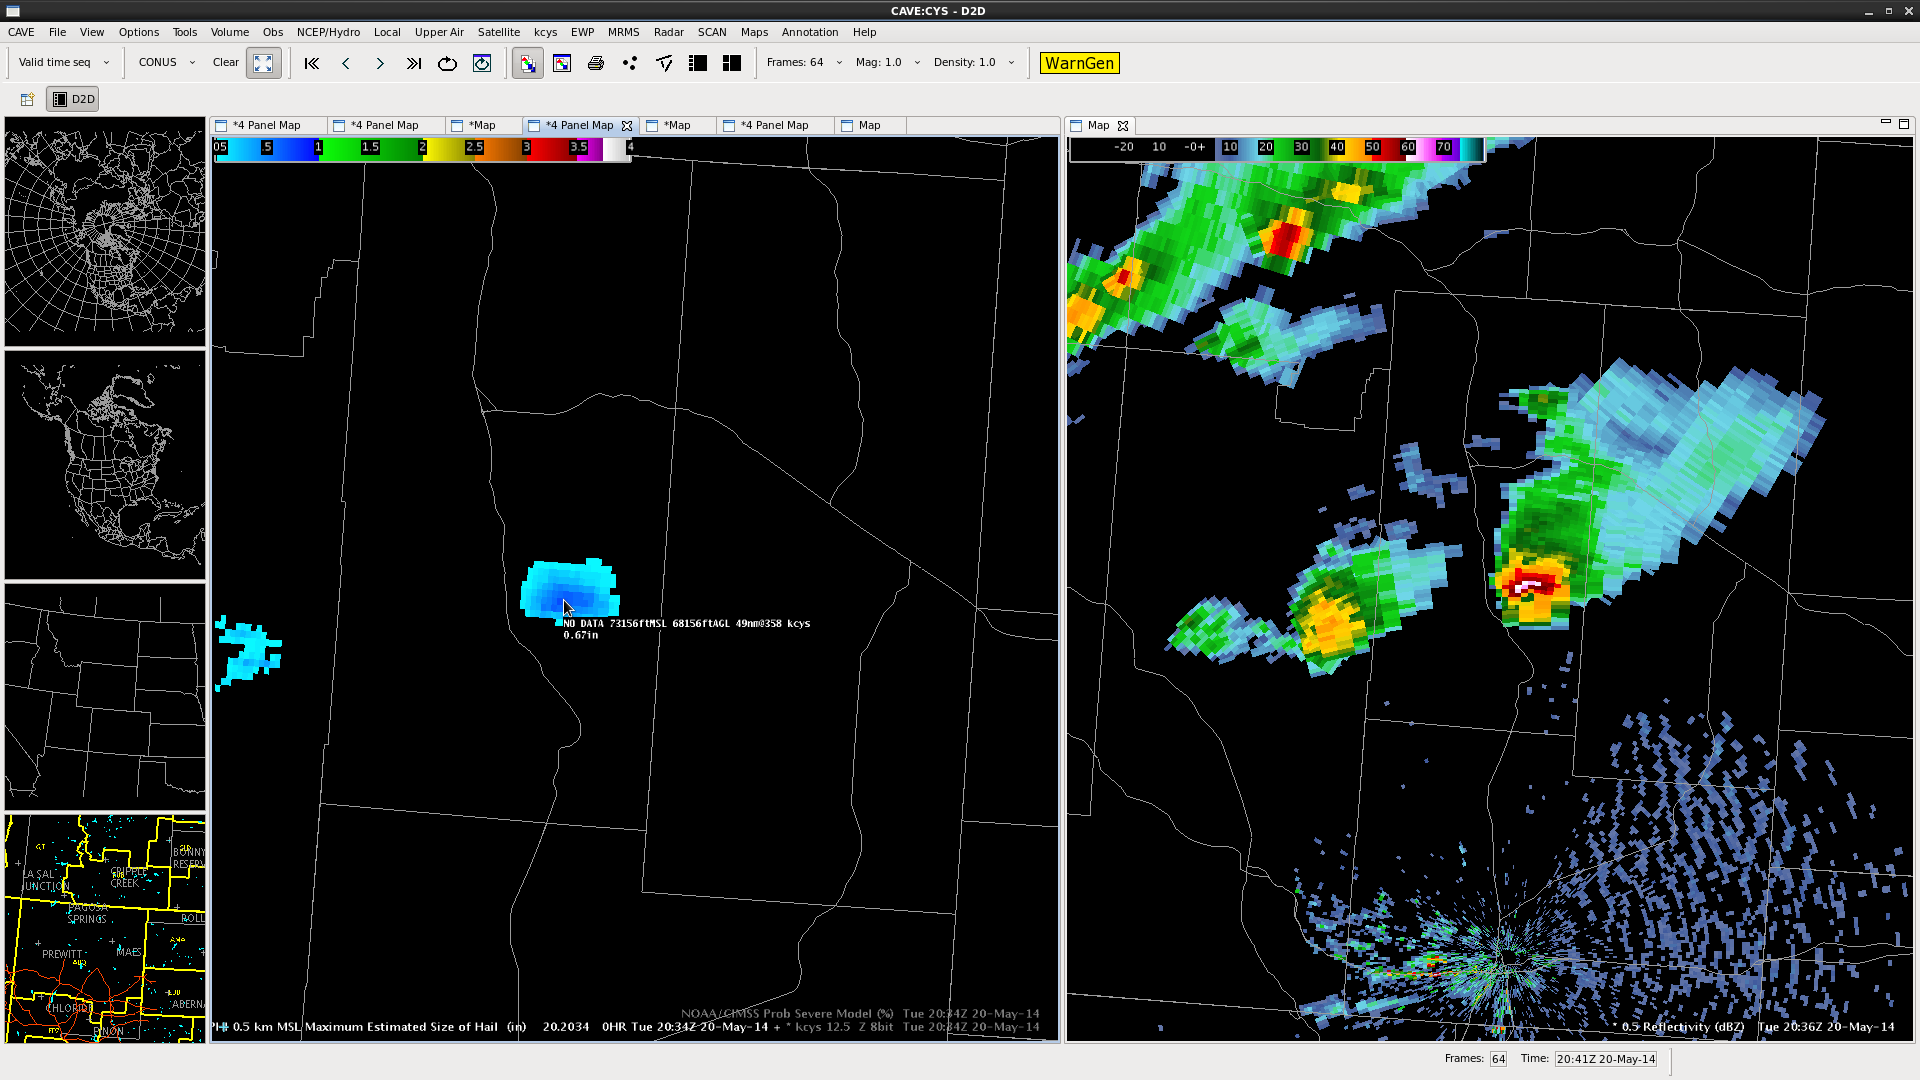
For today, my area of focus is in the DVN CWA. I began by looking at some of the satellite imagery and associated products, such as CI and OT detection. It’s still a bit too early for the OT product to be useful and the CI product is just now beginning to hone in on the developing CU field across the region. In the first image below, I’ve scalloped the region where the CU field has been evidently increasing in coverage and vertical growth. The CI product doesn’t show anything above the 40% range just yet but it still is a good way to bring attention to this area for possible initiation as conditions become increasingly favorable for development. There is a location just south of the area I’ve outlined that shows a 70% chance for CI so that’ll be something to watch as well.
In the next image (below), I loaded the CONUS LAPS theta-e analysis (image) along with wind and METARs/station plots (the 800×800 domain is not available for this region today). Again, the area of interest is across the northern border of the DVN CWA. Except for the bulls eyes that appear where there are seemingly bad obs being ingested (when toggling over to the dewpoint analysis, these locations are evident), this has been a good situational awareness tool as well as a good product to put together a mesoscale analysis.

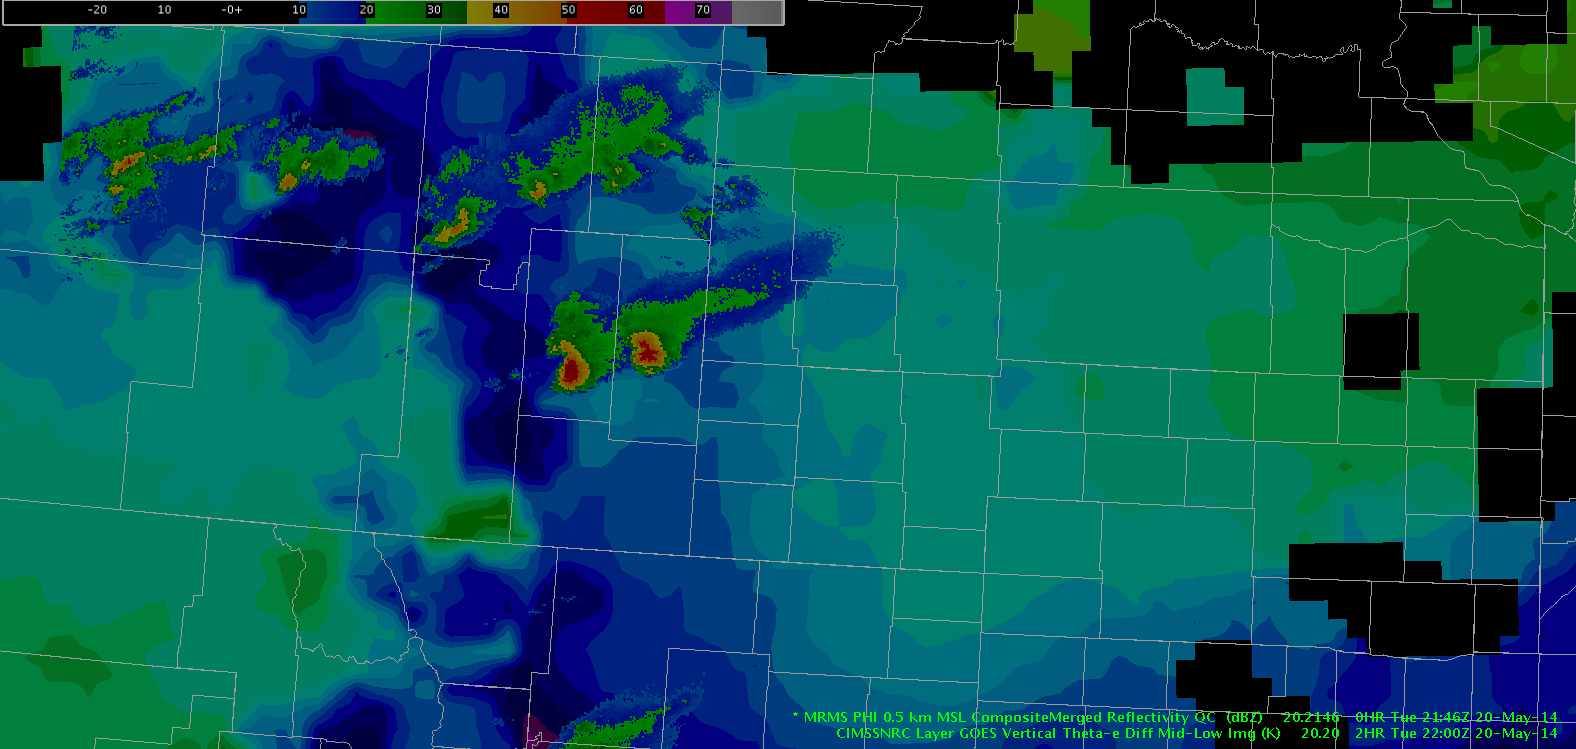
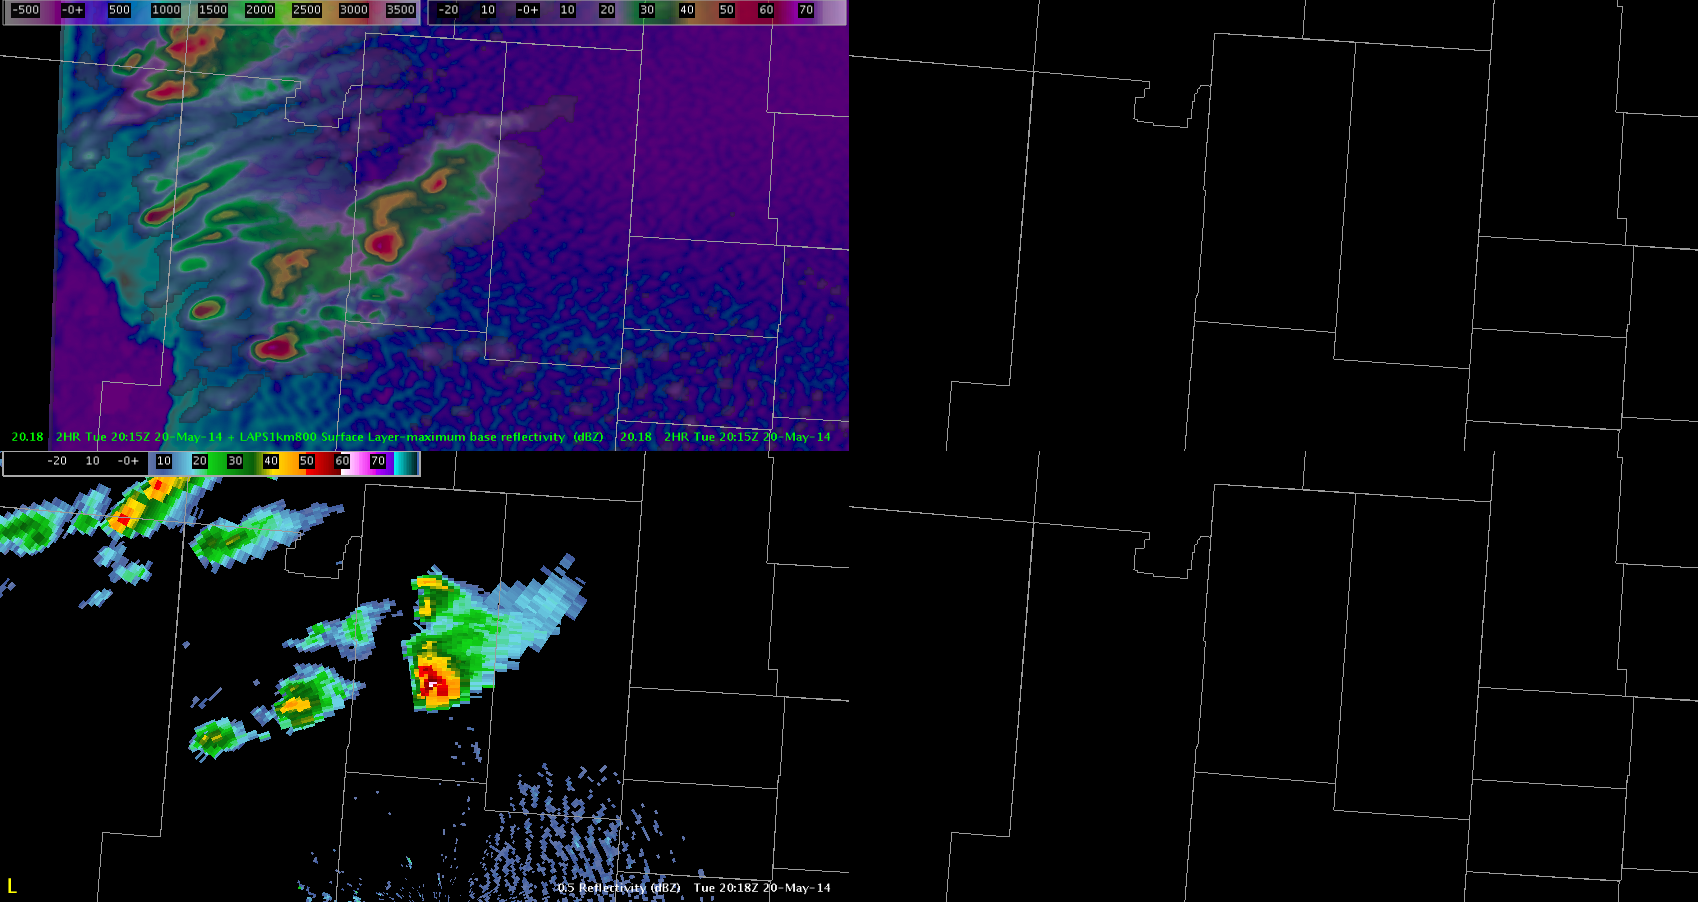
Comparing the analysis above with the theta-e difference product below, much of the DVN CWA is under an area of convective instability. Unfortunately, the aforementioned scalloped area of interest in the northern half of the CWA is blacked out so I’ve had to infer and fill in where a lack of data exists. It would appear that a gradient exists right through this area, which lines up with all previously analyzed parameters and products hinting that this is the area to watch over the next 0-2 hours.
~Linda
Short Term Afternoon Update CYS
Currently convection across the northern sections of the CWA is anticipated to slowly trend down as it chews through surface instability showing up in CAPE fields of the LAPS. In addition Near Cast models is showing best mid to low level instability is moving north out of the CYS CWA and into the RIW CWA over the next few hours. This should further lend to a downward trend. for convection across the area. Remaining storms of significance are anticipated to chew towards the east into Nebraska along a narrow and subtle boundary on visible satellite and showing up in 19Z LAPs run on CAPE fields as an enhanced area.
Grant H.
A Very Basic Mesoscale Analysis
So if I go with this model you can see below convection would initiate between 22-23Z over Central Iowa and S. Wisconsin bordering N. Illinois and then move East-Southeast.
This actually would be supported since the environment looks unstable that it is moving into. You can see on the Nearcast GOES Vertical Theta E Diff Mid Low that the high instability is from Central Iowa to N. Illinois and it looks like a boundary is there as well.
So now we shall wait and see if this actually occurs. My watered down mesoscale discussion – Vollmar
MESH vs Past Hail Algorythms.
For the storm observed in the earlier blog the MESH algorithm is kicking out between a half inch and an inch. The reports that came back almost immediately following this storm were very similar at around 7/8 inch. In the past for a high plains environment hail algorithms would kick out hail of about double what occurred in reality. This newer algorithm seems to negate the old “factor of” methodology or at least will force the forecaster to re-acclimate to a new “factor of” or a new rule of thumb.
Grant H.
vLAPs versus reality. CYS
It appears that on some runs of the LAPs that it can certainly nail the dominate storms to a very specific area. This is different from yesterday where cells were very displaced from reality. What is standing out here about these storms in particular is that a cold pool is spreading out in CAPE field on the background. This storm is reported as having half inch hail which is very close to warning criteria. Knowing that the cold pool is spreading out helps to form a feeling that the support for this cell is disappearing and it will probably weaken very soon, which can help to decide not to warn and keep FAR down. I’d also like to not that the CIMSS Prob of Severe model was close but not quite exceeding 50% percent which is one extra indicator for this storm before this moment. little battles one by one.
EWP Operations Update – Tuesday 5/20
Our forecasters this afternoon are only four feet from each other in the HWT, but they are operating four CWAs apart in Cheyenne, WY (CYS) and Quad Cities, IA/IL (DVN).
Our CYS team is leveraging Super-Rapid Scan, LAPS domain placement from yesterday, and the potential for lightning detection from the few active Northern Colorado LMA sites in their diagnosis of convective potential and current analysis of developing convection in Albany and Platte Counties.

Our DVN team is performing a mesoscale analysis of the region around IA/IL/WI where the highest potential for severe weather and its associated hazards are expected. As destabilization is forecast to occur in the next hour or so, hopefully we will see some cells in this area by 22z.

-Darrel Kingfield
EWP Week 3 Coordinator


