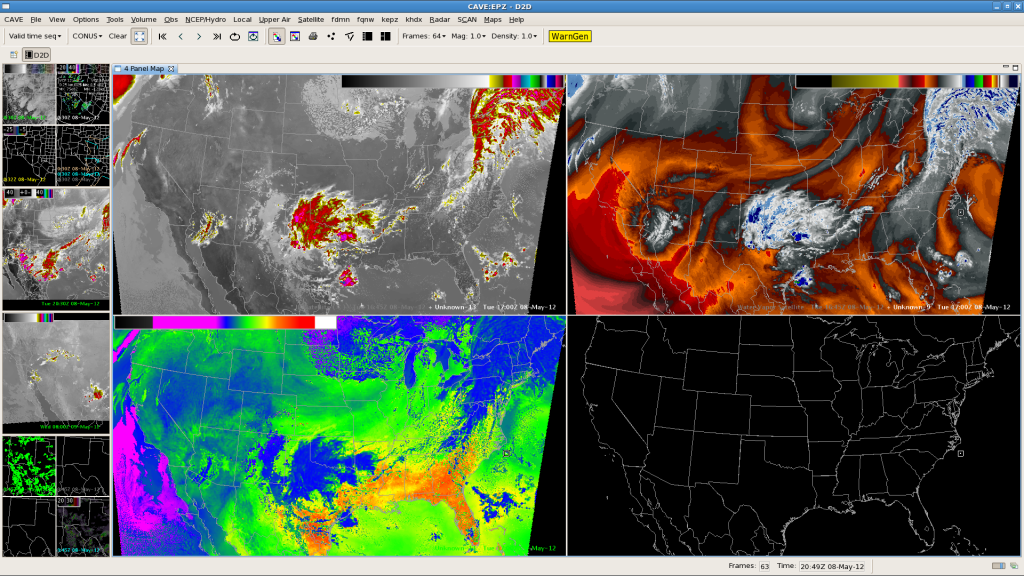
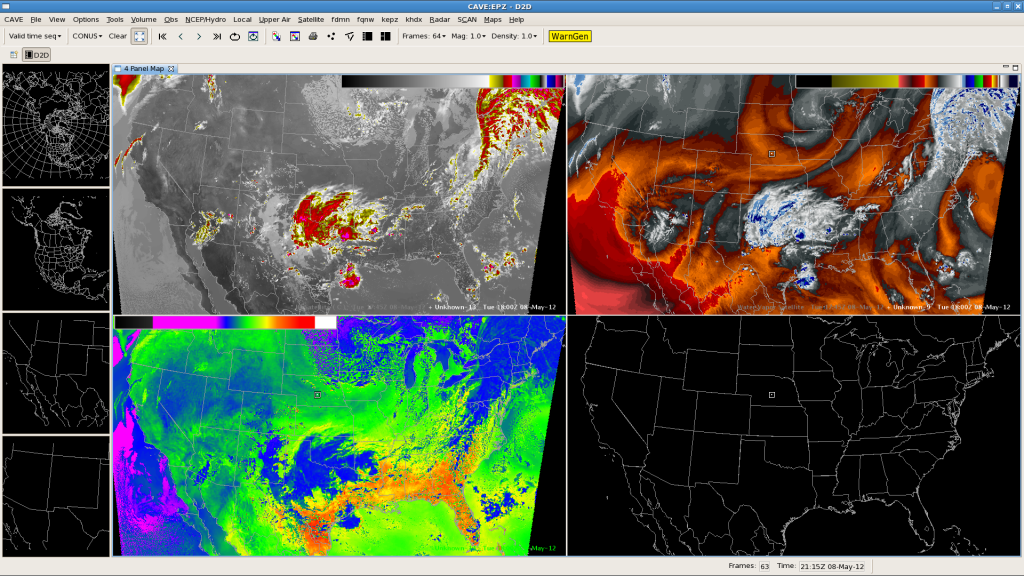
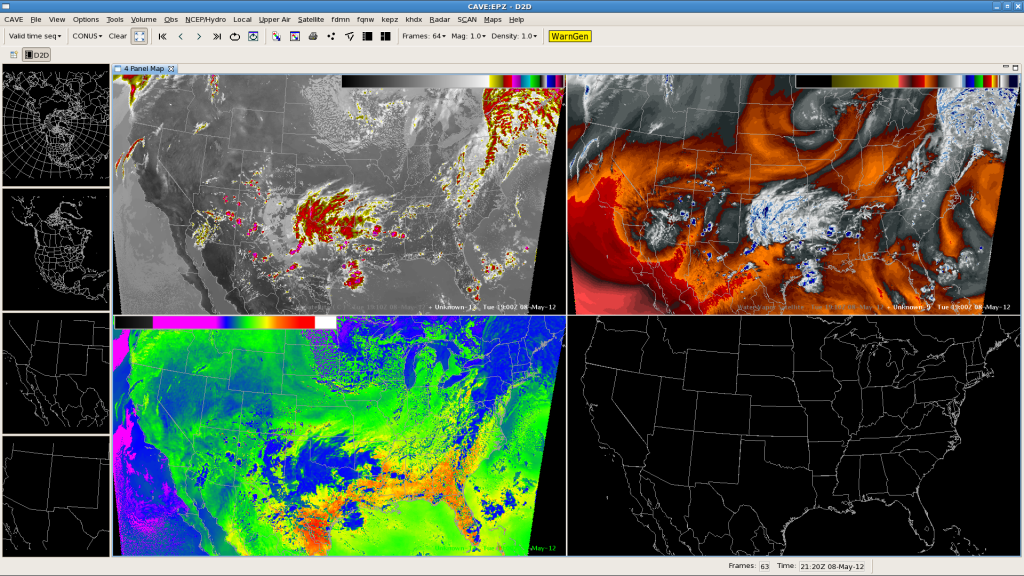
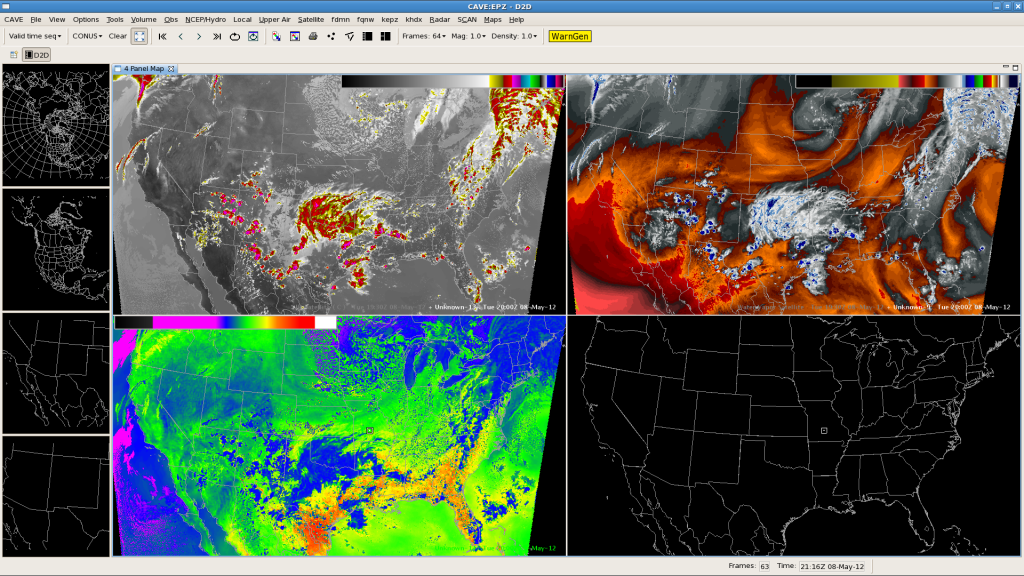
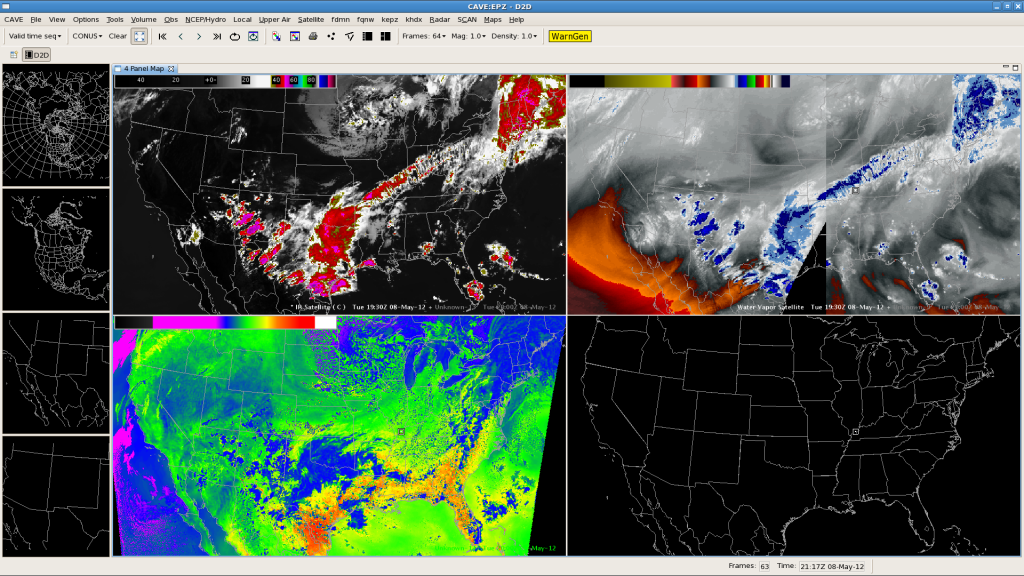
The synthetic WRF run at 05082012 at 0Z correctly predicted several upper level features and mesoscales features correctly for the afternoon of 05082012. The following 4 images show synthetic WRF images of IR (upper left), WV (upper right), and 10.35u-12.3u IR Band Difference (lower left). Looking at the WV imagery you can see an upper low over the U.S. Southwest as well as an upper trough over the upper Midwest. In the IR and WV imagery you can see convection occurring from AZ to NM to TX to CO to Old Mexico. In the brighter white areas of IR, you can see low level cloud cover. In the Band Difference image, you can see the area of best moisture and “hot spot” for convective initiation in the southern tip of TX and into Mexico. The 5th image below is the true observed IR (upper left) and WV (upper right) which verifies the synthetic WRF.
This imagery would be very helpful to forecasters in the field because it seems to do a decent job of predicting upper level features, low level clouds, and convection 12-20 hrs in advance.
17Z Synthetic:
18Z Synthetic:
19Z Synthetic:
20Z Synthetic:
20Z Observed IR and WV:
AMS

