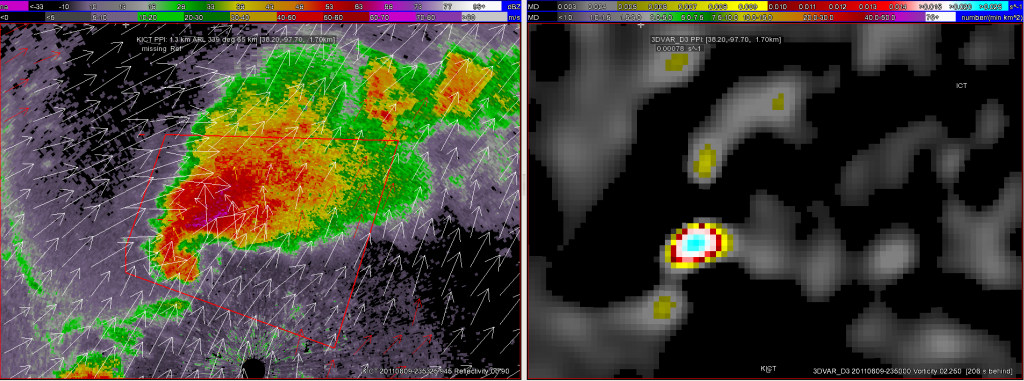
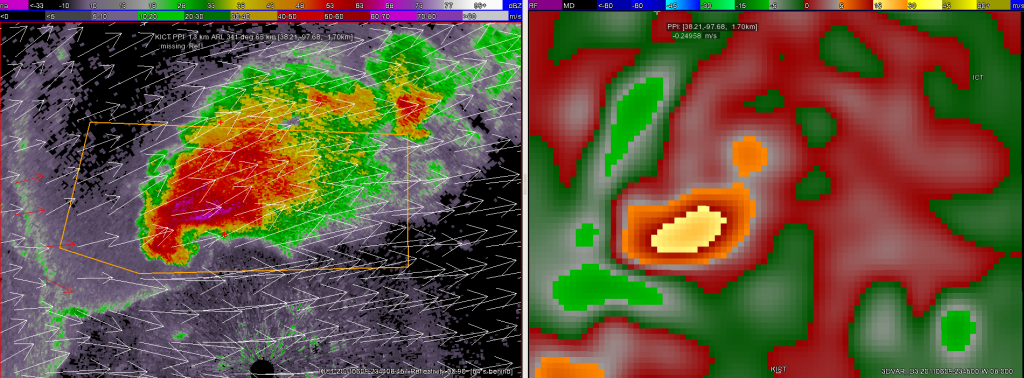
As one might expect the output from the 3DVAR data assimilation is only as good as the radar data that goes into it. This was seen clearly with tonight’s storms near the Wichita radar (KICT).
Below are displays of both the vorticity (at 2.25km) and vertical velocity (at 8km) at 2345 UTC. At this time, the storm was just to the north of KICT and was well-sampled by the radar including good data from the inflow region as well.


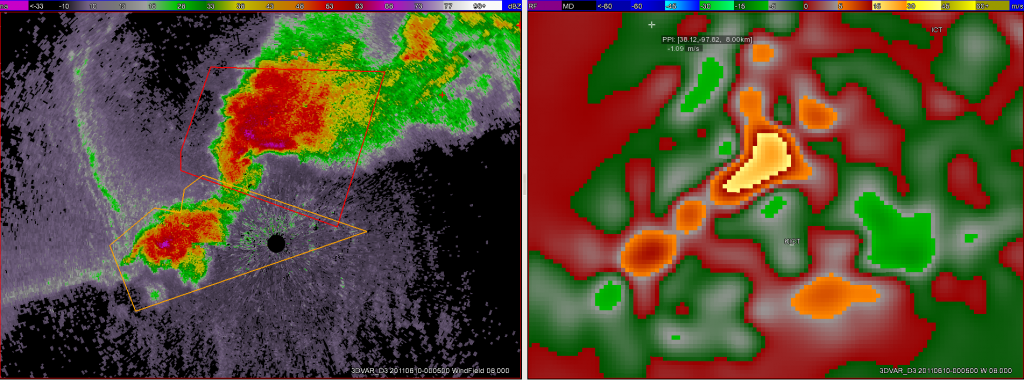
However, just 20 min later at 0005 UTC, the 3DVAR vertical velocity field developed a suspicious updraft southeast of the radar and the storm cluster:

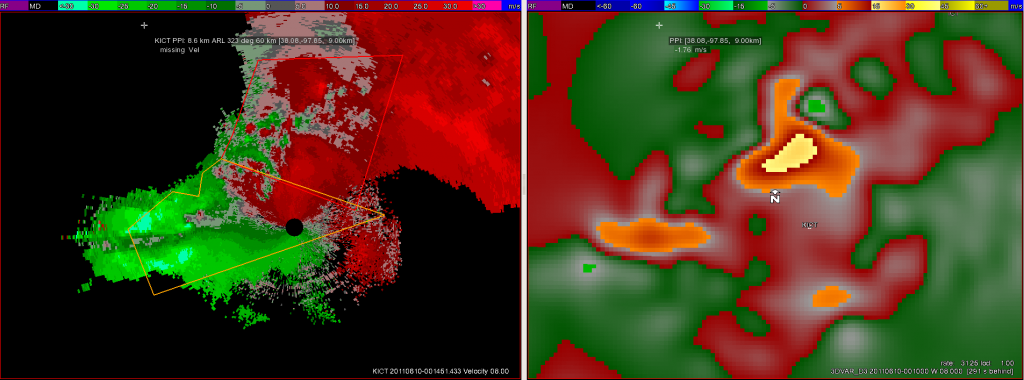
The reason for this updraft may actually have been side-lobe contamination due to anvil spread SE over the radar. Velocity data from KICT shows this area of suspect data — the signal was continuous in both height (through almost all tilts) and time (for about 15 min). The below image is just one example from this time:

The solution for the velocity data lead to convergence in the area and a false updraft.
Unfortunately, the output from data assimilation is only as good as the radar data brought in and this specific type error is extremely hard for even the best quality control algorithms to remove…
-Kristin Kuhlman (3DVAR scientist week 4)
