Some of the costliest and deadliest weather events in the United States are flash floods. On average, more fatalities are attributed to flash flooding than other short-fused severe weather hazards, like tornadoes, hurricanes, and lightning.
Flash flooding — the rapid rise of water in a normally dry area — is mostly related to excessive rainfall resulting in significant groundwater runoff and quick rises in waterways. NOAA National Weather Service (NWS) forecasters rely on accurate quantitative precipitation estimations (QPEs). QPE are input into diagnostic tools and models to help NWS forecasters predict and warn on the potential for flash flooding, like flash floods that occurred in Tennessee on Aug. 21, 2021.
Areas west of Nashville, particularly in Humphreys County, received over 1 foot of rain in a matter of hours. This included a period where 3-4 inches of rain fell per hour over multiple consecutive hours. Approximately 17.02 inches of rain was recorded in McEwen located in Humphreys County. This preliminary total eclipses the state record for rainfall in a 24-hour period, which was 13.60 inches in 1982. Twenty people perished in this Tennessee flood event.
NWS forecasters can use a series of products to diagnose an ongoing weather event to determine what might be happening. Researchers at the NOAA National Severe Storms Laboratory (NSSL) and the Cooperative Institute for Severe and High-Impact Weather Research and Operations (CIWRO, formerly CIMMS) hosted at the University of Oklahoma developed two systems to help with forecaster analysis and warning decision making — the Multi-Radar Multi-Sensor (MRMS) system and the Flooded Locations and Simulated Hydrographs (FLASH) system.
The Systems
The MRMS system is a platform that combines various weather observations and model data to create a suite of products, including various QPE fields.
A key to the MRMS system is the quality control of radar data. Quality control algorithms remove radar artifacts from blockages, wind farms, biological scatter (like birds and bugs), and other data contaminations. The MRMS system then applies the latest scientific advancements in precipitation estimation using dual-polarization radar technology to provide accurate precipitation data in real-time every two minutes.
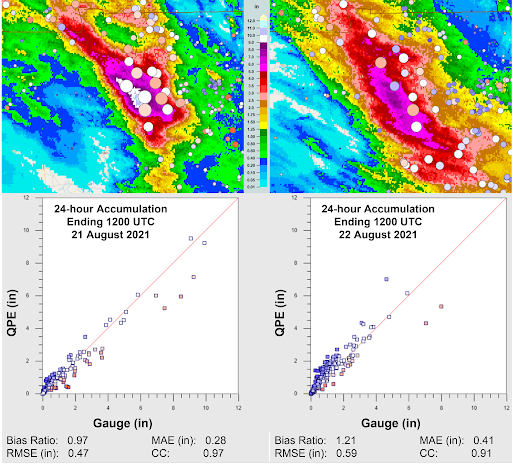
NSSL and CIMMS researchers regularly analyze MRMS QPE performance, including historic events like the Tennessee flash flooding. Product evaluations are conducted through internal web pages that allow for statistical comparisons of MRMS QPEs to independent gauge observations.
Using 24-hour analysis centered around 1200 UTC (7:00 AM local time) to collect both daily CoCoRaHS rain gauges along with hourly automated gauge observations, a few notable trends appear in the data. The overall analysis showed well correlated and clustered comparisons between the MRMS radar-based QPE and the gauge observations with rather small errors. The MRMS dual-polarization radar QPE had some overestimations with totals less than two inches, while some slight underestimation was observed with totals exceeding four inches. Yet, the nearly equivalent values between the gauges and MRMS in the area of greatest rainfall shows how well the system handled the event.
The second application developed by NSSL and CIMMS researchers to help with flash flood prediction is the Flooded Locations and Simulated Hydrographs (FLASH) system. The FLASH system is the first system to generate hydrologic modeling products specific to flash flooding at the flash flood time scale — new model runs are generated every ten minutes — in real-time for the entire country.
The FLASH system also provides products that compare QPE values to flash flood guidance — a measure of how much rainfall is needed to flood small waterways — in addition to the average recurrence intervals — a measure to determine the rarity of the precipitation totals based on how frequently they occur. All products within the FLASH system use the MRMS dual-polarization radar QPE as their input.
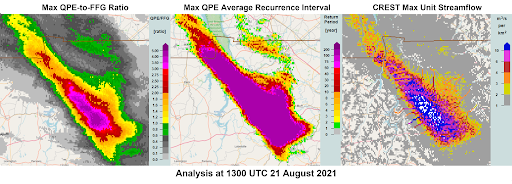
At the peak of the rainfall over Humphreys County, Tennessee, the QPE comparison products were at the upper end of the plotted scales. The accumulated rainfall was at least four times that of the NWS flash flood guidance for the area, and the average recurrence interval of the rain was beyond the plotted scale in the system (at least 200 years — approximately 0.5% chance of occurring per year).
The product that best conveys the flash flood potential and its possible severity is the maximum unit streamflow product from the Coupled Routing and Excess Storage (CREST) hydrologic model. The maximum unit streamflow values — the amount of water runoff normalized by its basin area — have been shown to capture the spatial coverage of flash flooding and provide context to its potential severity.
The projected unit streamflow values based on MRMS precipitation rates during the Tennessee flash flood event on Aug. 21, 2021, showed three key features:
- How quickly the flash flood threat escalated.
- How the extreme values pointed to a potentially catastrophic event.
- How the model routed the water to show the impacts on local rivers even after the rainfall ended.
Researchers at NSSL and CIMMS continuously work to enhance the performance of the MRMS and FLASH systems to improve precipitation estimations and flash flood predictions. Efforts with machine learning and artificial intelligence are paving the way for increased performance in areas where radars struggle to accurately capture precipitation. Probabilistic hydrologic modeling with the use of forecast precipitation with the FLASH system looks toward the future of warning for flash floods within the FACETs (Forecasting a Continuum of Environmental Threats) paradigm.


")