Learn more!
Read a case study of how NSSL’s Warn-on-Forecast System successfully predicted the evolution of Hurricane Ida after landfall.
When Hurricane Ida moved inland along the Gulf Coast of Louisiana in late August 2021, a team of researchers set out to study winds associated with the damaging storm. The group, including scientists from the NOAA National Severe Storms Laboratory, captured unique datasets, marking Hurricane Ida as possibly one of the best-observed hurricanes at landfall.
Here’s a brief overview of the ways scientists were able to gain a better understanding of Hurricane Ida:
Continuous weather balloon launches provide more data
NOAA is leading efforts to launch as many weather balloons with instruments attached as possible into hurricanes and tropical storms. Researchers are particularly interested in launching balloons into the eye and innermost part of a hurricane to measure several atmospheric conditions, like temperature, humidity, and wind.
Instruments launched into the eye of Hurricane Ida identified a recording-breaking amount of moisture in the atmosphere. The data provided key context to the devastating flooding that impacted New York days later.
Multiple data sources help scientists understand the storm’s extreme winds
NOAA NSSL researchers collaborated with the University of Oklahoma and Cooperative Institute for Mesoscale Meteorological Studies to deploy a variety of surface observation units. The goal was to capture a variety of data on extreme winds to improve building codes to mitigate damage to homes and other structures.
Researchers deployed the Portable In Situ Precipitation Station (PIPS), NSSL’s Mobile Mesonet, weather balloons, and OU’s Shared Mobile Atmospheric Research and Teaching Radar (SMART) mobile weather radars. The teams strategized, gathered critical information about Hurricane Ida, and safely deployed their instrumentation. The teams successfully gathered wind data as Hurricane Ida came ashore and moved inland.

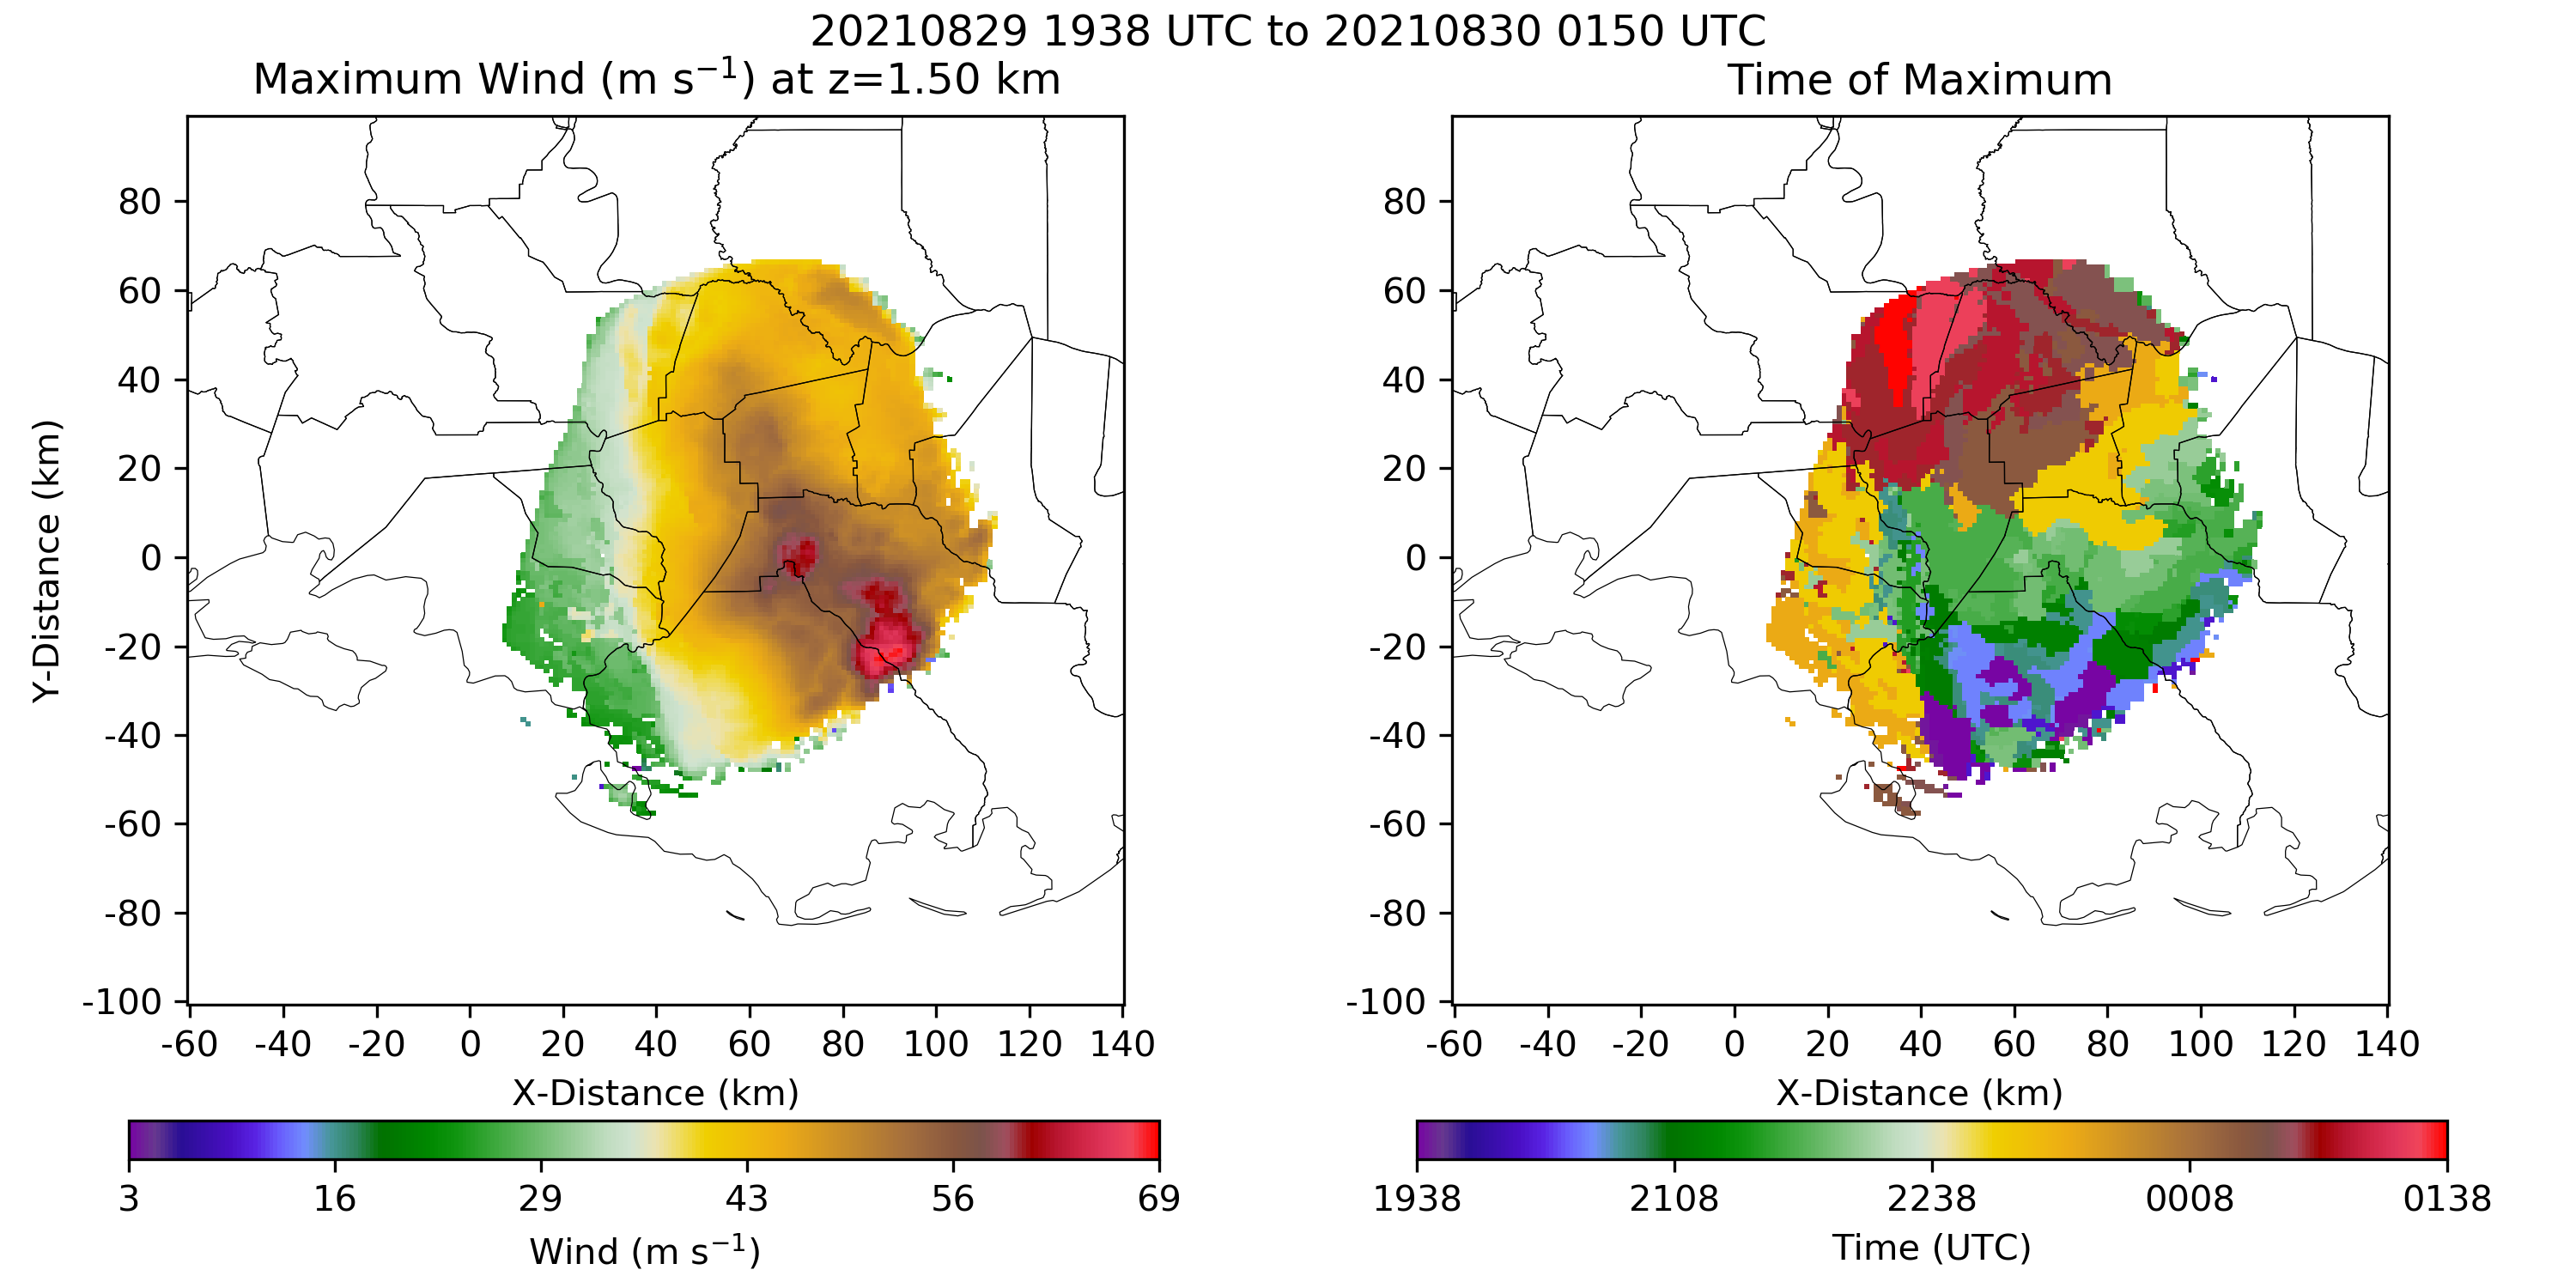
Researchers captured the evolution of Hurricane Ida
Researchers safely recorded the complete evolution of Hurricane Ida. Dual-Doppler radar from the SMART radars shows the system making landfall, with maximum wind gusts of 172 mph. Data collected by the teams will allow an opportunity to examine a variety of weather processes essential to understanding the evolution of Ida’s wind field and rainfall distributions. Currently, Hurricane Ida is one of the best well-sampled landfalling hurricanes by NOAA and university researchers. NOAA NSSL researchers will continue to gather hurricane observations in the future in an attempt to gain a better understanding of hazards associated with such storms.