An official website of the United States government
Here’s how you know
Official websites use .gov A
.gov website belongs to an official government
organization in the United States.
Secure .gov websites use HTTPS A
lock (
) or https:// means you’ve safely connected to
the .gov website. Share sensitive information only on official,
secure websites.
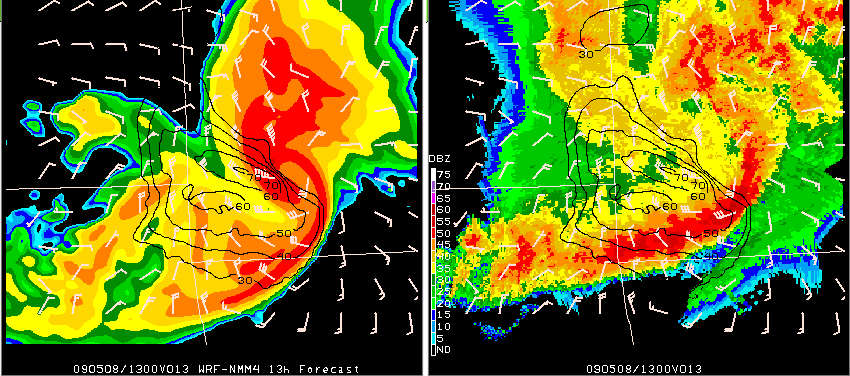
Above is an example of one of the forecasts from the Spring Experiment models from Friday. This bow echo moved across southwest Missouri early Friday morning and these images are centered on Joplin, MO (JLN). On the left is the 13h forecast from the WRF-NMM 4km model initialized at 00Z 08-May-2009 and valid at 13Z. On the right is the verifying 1km base reflectivity image with the model fields for winds overlaid on the radar. The barbs in each of the images are the model’s instantaneous 10m winds in knots (with the grid skipped to lessen the clutter). The isotachs are plotted from the WRF “history variables” for maximum U,V 10m winds (no grid skip). These are the maximum 10m wind speeds in the model over the past hour ending at 13Z.
Instantaneous 10m winds in the model at 13z, near the rotating bow head, are at least 50 knots. The maximum model 10m winds over the past hour range from 60-70 knots near and north of the weak echo channel and around the comma-head of the bow.
This was only one of several exceptional forecasts of this feature from the models being evaluated in this year’s Spring Experiment. To see more output on this case and more, check out the Spring Program website here:
Plots of WRF/CAPS 1km AGL simulated reflectivity are now available using “V2” as the centerpoint in the URL. The following V2 domain image combinations should work as of today’s 00z and 12z model runs:
Mix and match the models to build the loop you need based on the URLs, above. You can also add &date=YYYYmmdd to review another date.
The 00Z NCAR run goes out to forecast hour 48 while the other 00Z runs go to forecast hour 36. The loop URLs, above have a start hour of 12z go out 24h. This can be adjusted by using the &starthr and &frames variables in the URL.
The 12Z NMM goes to forecast hour 36 while the NCAR and AFWA versions of the WRF only go out 24h. These loops also start at 12Z and go out 24h. Note, some imagery will drop out when looping beyond the available forecasts from that model. Imagery may also be uavailable if model data fails to arrive prior to the execution of the cron job for the image generation script. These loop pages should not to be considered operational and will not always be available.
Thanks to Ryan for building such an adaptable web-based interface that allows us to build these thumbnail image loops!
It looks like we have full 18-06z loops from all available data from 00Z, May 6, 2009!
This is a first for the 2009 SE.
With the center point change to CLT today we are outside the domain of the 00Z CAPS CNA and C0A models.
GEMPAK just plots a blank image with a title for those frames. Everyone else appears to exist for the
18z-06z period. This includes the following 00Z runs:
WRF-AFWA
WRF-NCAR
WRF-NMM
WRF-NSSL
WRF-CAPS1
CAPS-SSEF-ALL (18 members)
CAPS-CNA – no grids in selected domain and not shown in the loop links, below.
CAPS-C0A – no grids in selected domain and not shown in the loop links, below.
Here are the links to the loops for this 00Z run of the models (the verifying base/composite reflectivity will fill-in tonight):
Looks like the WRF3-HRRR (high-rez rapid refresh) has been coming in. I had to update datatype.tbl for the $MODEL/wrf3hrrr/ grid file name. Also, there does not appear to be a 1km REFL parameter in the GEMPAK output. There is REFC (composite reflectivity) and also the history parameters that allow the generation of the SSVR plots.
So, as of the 12Z run May 3, 2009 the following thumbnail image names are available:
Composite reflectivity (compare to crefr):
date_runtime/WRF-HRRR3_CREF_YYYYmmdd12_f000.gif through f012.gif
and…
Hourly synthetic severe (compare to lsr/tlsr):
WRF-HRRR3_SSVR_YYYYmmdd_f000-012.gif
For May 4th: the severe potential across much of the US looks marginal (it figures). However, there is some possibility for high-based or elevated convective initiation across parts of southeast CO into KS/OK/TX areas later in the day and perhaps again overnight. There is also the chance for an isolated LP storm with heating across TX but the chance is low. With that in mind, I decided to set the center point at CDS for Monday.
The weekend saw some remarkable storms! I tried to capture as much as possible. LIT was a good pick for Saturday’s actvity and I picked TCL for the long-track bowing MCS/Derecho event on Sunday. The WRFs from NSSL and NMM both showed some amazinglt accurate simulations and were integral to forecast decisions made at SPC. The convective evolution/mode on both days was relatively well handled. This was especially true on Saturday afternoon/evening across the Arklatex:
The 18-24h forecasts form the NSSL and NMM WRFs valid for Sunday afternoon were also really interesting to review. I think the NMM takes the prize in this comparison with its incredibly accurate depcition of the two linear systems over the MS/AL area Sunday morning. However, the forecast was about 3h too slow.
The 12Z NMM run on Friday and Saturday was poor guidance and seemed to suffer from the cold start. I would shy away from the 12Z NMM for making decisions about storm initiation based on what I saw Friday and again Saturday. There was no 12Z NMM run on Sunday morning. Not sure what happened there.
That’s it. One more forecast shift on Monday and then back to some hacking on Spring Experiment graphics!
Initial success on the accumulating 40+ dBZ 1KM REFL from the models tonight. At left is an image from the WRF-NSSL4 that accumulates 40+ simulated reflectivity from 18z (f018) through 06z (f030). I still have to clean up the labeling and add logic to do the 12z runs.
While the observed base reflectivity data for this plot is running, don’t expect these model plots to be up and running for at least another a day. -GregC


