

Well, this wrap-up blog is a bit later than usual, probably due to the amount of communicating we’ve been doing with regards to the Spring Forecasting Experiment at other venues! Multiple talks on different aspects of the SFE took place during the American Meteorological Society’s 29th Conference on Weather and Forecasting/25th Conference on Numerical Weather Prediction Conference in Denver, CO, from 4 June–8 June. Considering that the experiment concluded the Friday before the meeting began, data doesn’t get much fresher than that! The talks included an overview of the experiment, discussion of the new web capabilities in the 2018 SFE, HREF configurations, subjective and objective evaluation of FV3 configurations contributed by different agencies, new experimental verification methods, scorecard development, and examination of the CAPS FV3 Ensemble performance. The official summary report is forthcoming, but those talks provide a great sampling of preliminary results from the experiment.
More analysis is underway, but objective results available on the SFE homepage summarize a small subsample of CAMs according to a preliminary set of performance metrics, including reflectivity at selected thresholds and surrogate severe fields generated from the updraft helicity (UH) fields. These surrogate severe fields will be updated, since the initial tests used a threshold of UH rather than a percentile of UH. As the climatology of UH can vary greatly between models (one model can consistently produce higher UH values) and is grid-spacing-dependent, utilizing a percentile rather than a specific value is better able to capture differences between guidance that otherwise might be masked by different climatologies.
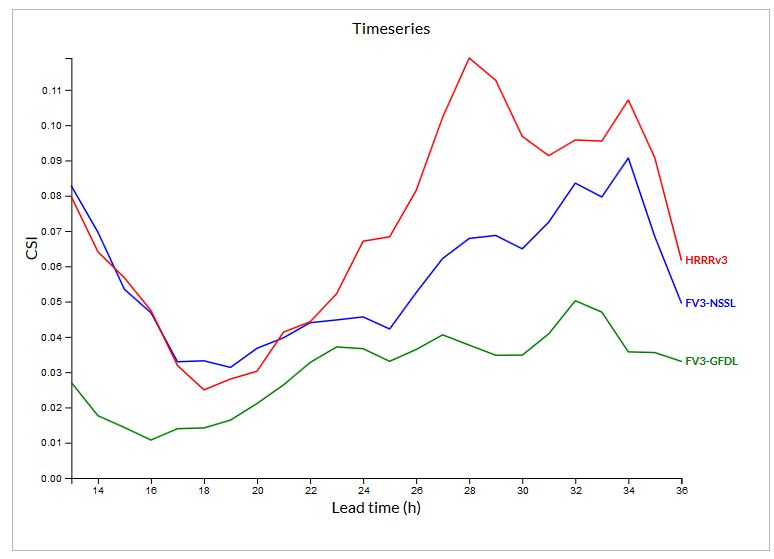
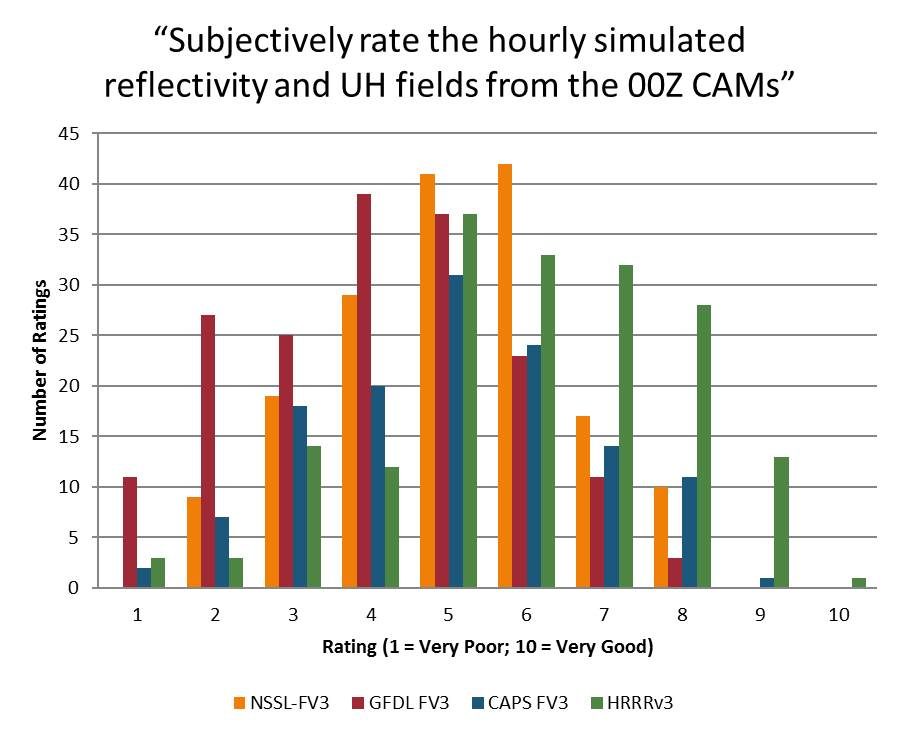
Overall, the HRRRv3 reflectivity fields performed better than either of the FV3 models examined in this comparison, with the most drastic difference starting during the afternoon convective period. This difference is also reflected in the subjective evaluation of the reflectivity and UH fields, with the HRRRv3 receiving more ratings of 7-9 (out of 10) than the other models.
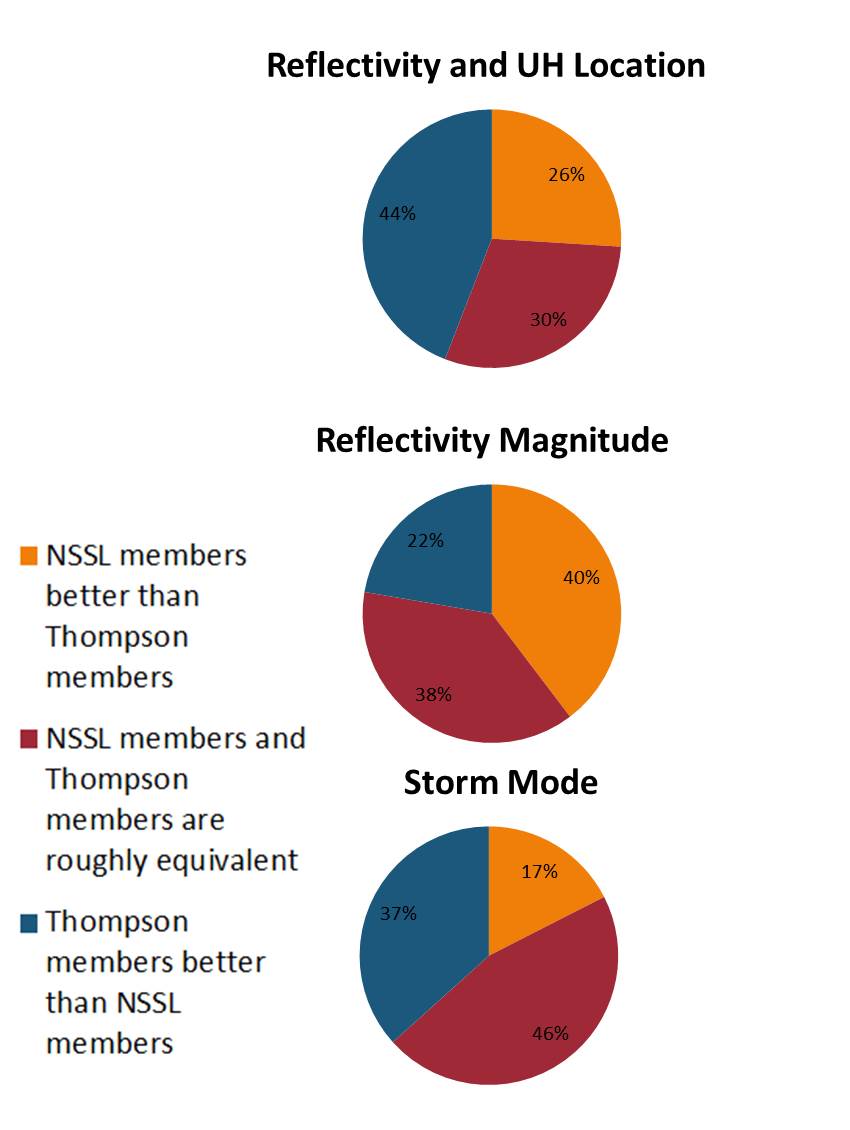
Looking at the varieties of FV3 produced by CAPS with two different microphysics schemes (where participants compared two of the ensemble members which used each microphysics scheme), differences between the reflectivity and UH location were noted most often when compared to reflectivity magnitude and storm mode.
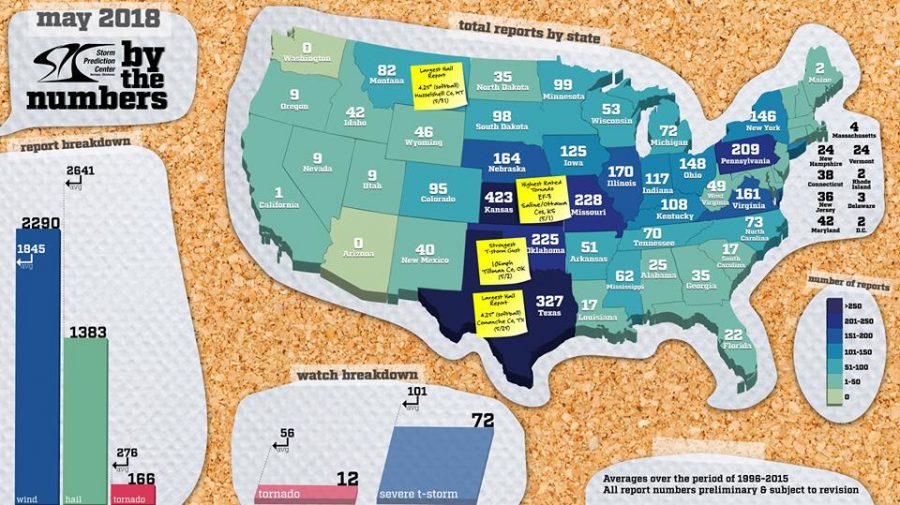
And how was the weather during the 2018 SFE? Well, the SPC put out a great graphic (below) showing some of the severe weather highlights during the season, and overall, the number of severe thunderstorm and tornado watches were well below average, as were the number of wind and tornado reports. The first and last week of the experiment had the most exciting weather, including a tornado that passed through north Norman (participants were especially attentive on this day, for some reason!). While the weather may not have been fully cooperative, the dataset created from the different NWP models over the 5 weeks of the experiment will surely generate some fruitful results. After all, determining how the NWP is performing over weakly forced cases is critical, as good guidance could help decision-makers to make the right call on days with high uncertainty.
The experimental hourly probabilities of severe weather based on guidance from the NEWS-e are also currently being analyzed, pulling together information about how participants used the NEWS-e guidance and which tools they used most frequently alongside the forecast performance and participant opinions about their forecasts and the guidance. The experimental timing forecasts (Potential Severe Timing areas, or PSTs for short) are also currently being analyzed, but proved much more understandable to participants than prior timing products we have tested in the SFE.
Wrapping up, I and the entire SFE team would like to express our appreciation to everyone who helped coordinate and contributed to the experiment. Although it only takes place for five weeks every year, months of planning and development happen beforehand both at the National Weather Center and with our partner agencies throughout the country. We would also like to thank the participants, who share their knowledge, time, advice, and enthusiasm for severe convective weather forecasting during their time in the experiment. As we delve into the results from SFE 2018, let the anticipation for SFE 2019 begin!