During the Thursday CI forecast we decided to forecast for a late show down in western Texas where the models were indicating storms would develop. The models had a complex evolution of the dryline and moisture return from SW OK all the way down past Midland, TX. There was a dryline that would be slowly moving southeast and what we thought could be either a moisture return surge or bore of some kind moving northwest. CI was being indicated by most models with large spatial spread (from Childress down to Midland) and some timing spread (from 03 to 07 UTC) depending on the model. More on this later.
Mind you, none of these models had correctly predicted the evolution of convection earlier in the day along the TX panhandle-western OK border. In fact the dryline in the model was well into OK and snaked back southwest and remained there until after 23 UTC. The dryline actually made it to the border area, but then retreated after the storms formed southwest of SW OK in TX. This was probably because of the outflow from these storms propagating westward. This signal was not at all apparent in the models, maybe because of the dryline position. The storms that did form had some very distinct behavior with storms that formed to the north side of the 1st initiation episode moving North, not east like in the models. The southern storms were big HP supercells, slowly moving east northeast, and continually developing in SW OK and points further SW into TX (though only really the first few storms were big; the others were small in close proximity to the big storms – a scale enigma). We had highlighted the areas to the south in our morning forecast, along with an area in KS to the North but left a sight risk of CI in between. So while our distinct moderate risk areas would sort of verify in principle (being two counties further to the east than observed) we still did not have the overall scenario correct.
That scenario being, storms developing in our region and moving away, with the possibility for secondary development along the dryline a bit later. Furthermore we expected the storms to the north to develop in our moderate risk area and move east. When in fact the OK storms moved into our KS region just prior to our northern KS moderate area verifying well with an unanticipated arcing line of convection. This was a sequence of events that we simply could not have anticipated. We have discussed many times having the need to “draw what the radar will look like in 3 hours”. This was one of those days where we could not have had any skill whatsoever in accomplishing that task.
Drawing the radar in 1 or 2 or 3 hours is exactly what we have avoided doing given our 3 hour forecast product. We and the models, simply do not have that kind of skill at the scales where it will be required to have added value. This is not so much a model failure or even human failure. It is an operational reality that we simply don’t have enough time to efficiently and quickly mine the model data to extract enough information to make a forecast product. More on this later.
Back to the overnight convection. So once these SW OK supercells had been established we sought other model guidance, notably the HRRR from 16 or 17 UTC. By then it had picked upon the current signal and was showing a similar enough to observations evolution. This forecast would end up being the closest solution, but to be honest was still not that different way down in TX to the ensemble which was a 24-30 hour forecast. They all said the same thing: dryline boundary and moisture surge would collide, CI would ensue within 2 hours into a big line of convective storms that would last all night and make Fridays forecast very difficult.
Sure enough these boundary collisions did happen. From the surface stations point of view, winds in the dry air had been blowing SW all day with temps in the upper 80’s low 90s. After 02 UTC, the winds to the NW had backed and were now blowing W with some blowing W-NW. While at the dryline, winds were still SW but weakening. Ahead of the dryline, they were SE and weak. By 0400 UTC, the moisture surge intensified from weak SE winds to strong SE winds, with the dew point at CDS increasing from 34 to 63 in that hour. On radar the boundaries could be seen down in Midland, as very distinct with a clear separation:
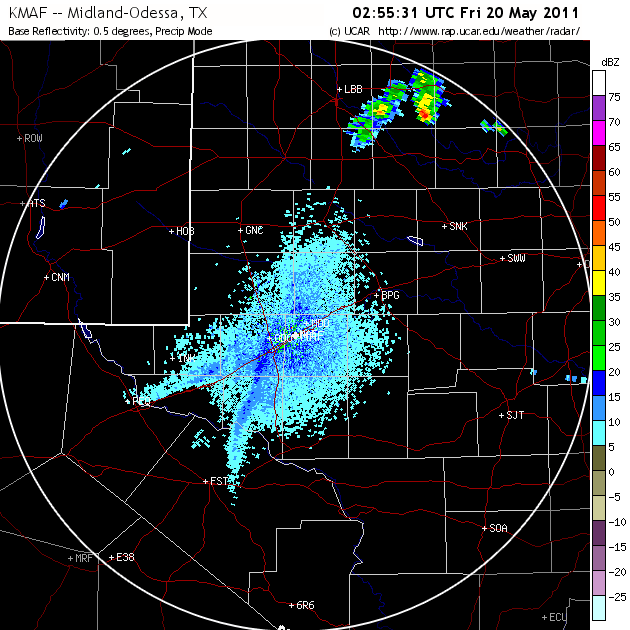
You can see CI already ongoing to the north where the boundaries have already collided and the zipper effect was in progress further southwest but it took nearly 2 more hours.
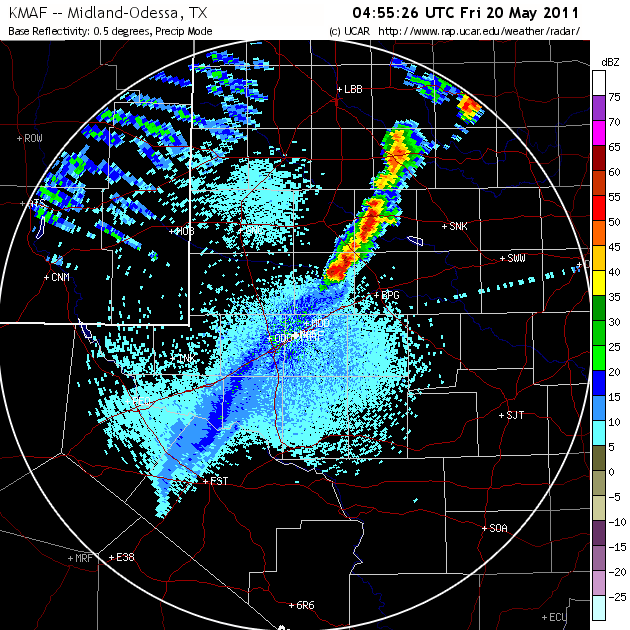
Also note the “gravity waves” that formed in the upper level frontal zone within a region of 100 knots of vertical shear back in NM. Quite a spectacular event. Let me also note that the 00 UTC ensemble and other models DID NOT pick up this event, until 3 hours later than shown by the last radar image. Spin up may have played a significant role in this part of the forecast. As you can see, the issues we face are impressive on a number of levels, spatial, and temporal scales. We verified our forecast of this event with the help of the ensemble and the HRRR and the NSSL WRF. To reiterate the point of the previous post: It is difficult to know when to trust the models. But in this case we put our faith in the models and it worked out, whereas in the previous forecast, we put our faith in the models and we had some relative skill, but not enough to add value.