Exploring Conditional Intensity Forecasts

One of the things that we’re looking at this year in the SFE is forecasting the coverage and the intensity of individual severe hazards – tornadoes, hail, and wind. Ongoing work at SPC has shown that there is some intensity information within the coverage probabilities, and the aim of this aspect of the experiment is to determine how best to unlock that information.

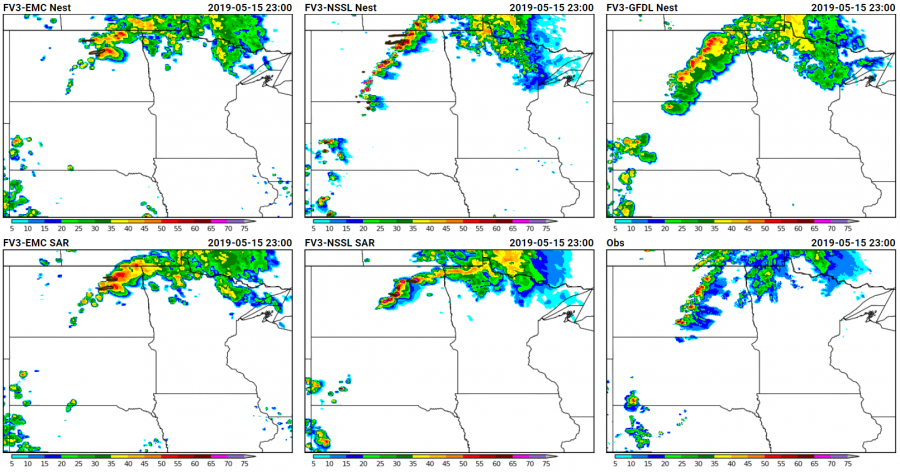
Yesterday, 16 May, provided an interesting case for the conditional intensity forecasts. CAM guidance yesterday was indicating the possibility of rotating, discrete storms across parts of North Dakota, but the location of where CAPE, shear, and the cold front would intersect left questions about the mode of convection and whether or not significant hail would be possible with these given storms. CAM guidance showed the location and progression of the storms quite well, including several experimental FV3-based CAMs that we’re looking at in the experiment.

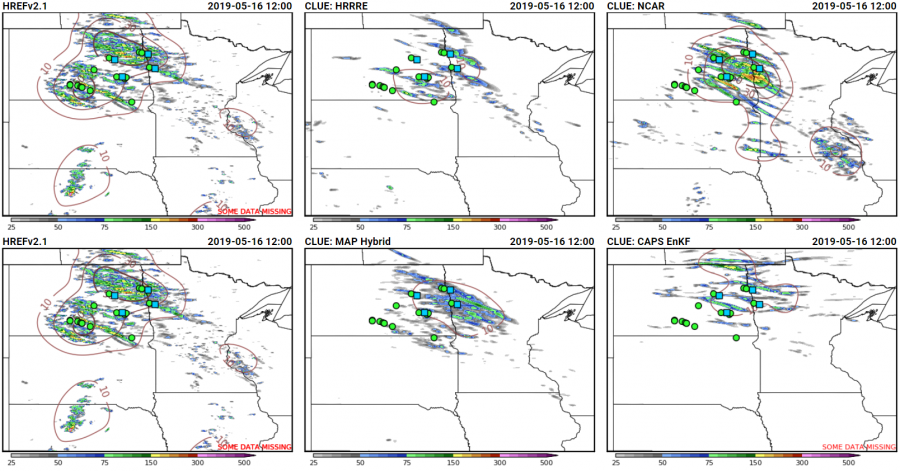
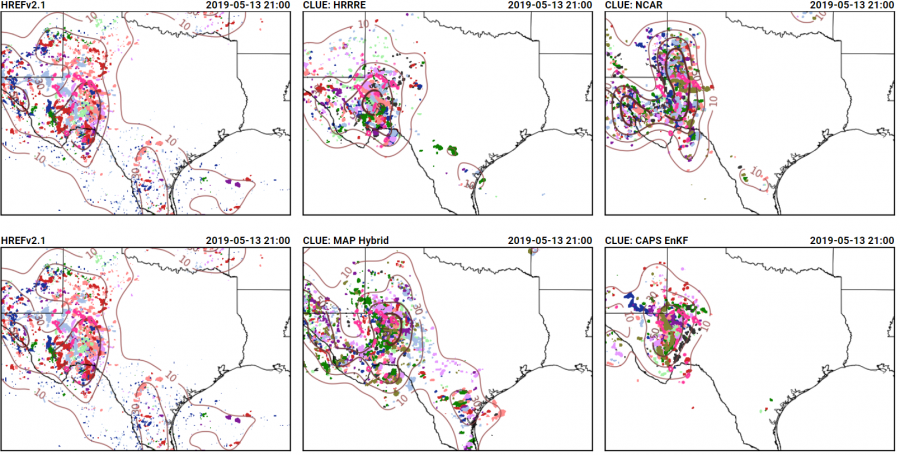
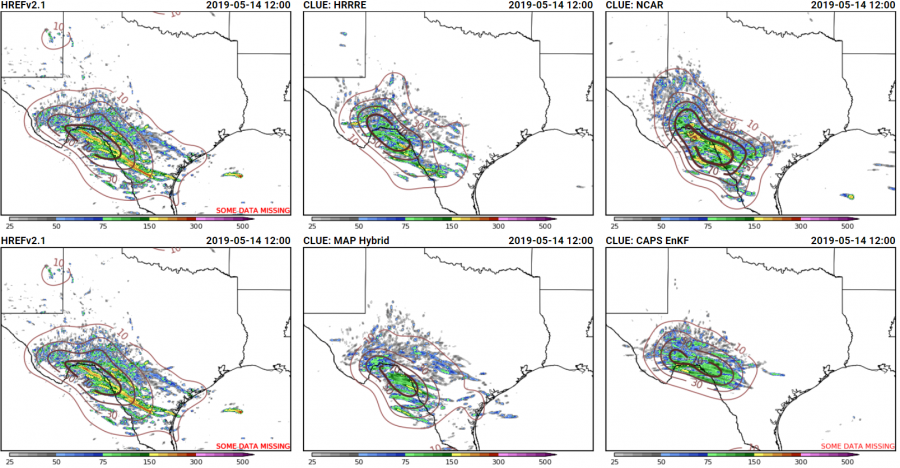
The intensity potential may have been covered better by the ensembles, and showed that a range of outcomes were possible. The 24-h maximum UH fields from several experimental ensembles showed very different depictions of the potential storm severity:

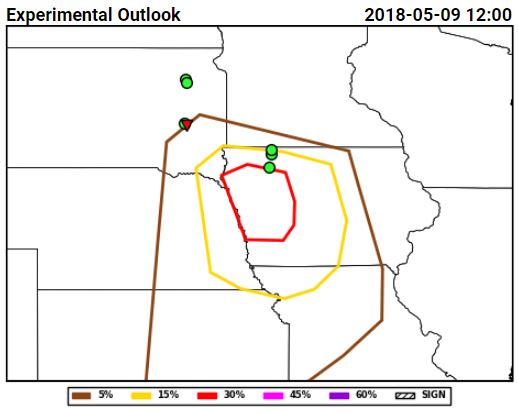
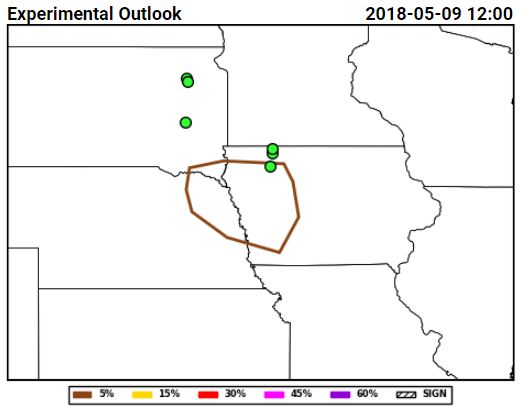
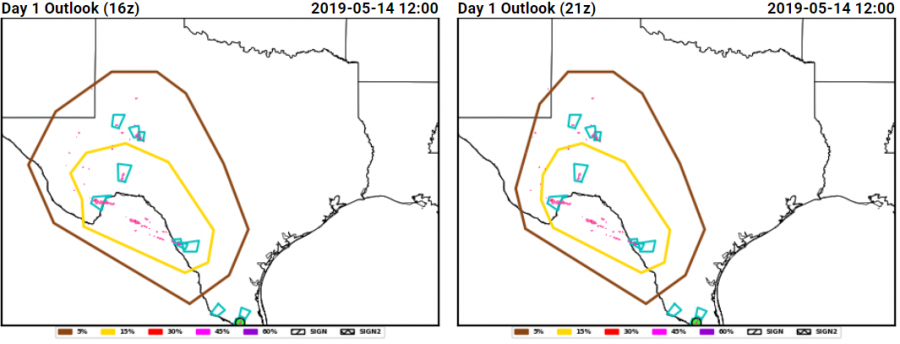
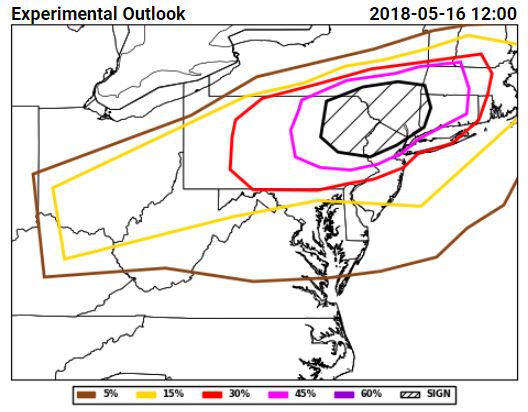
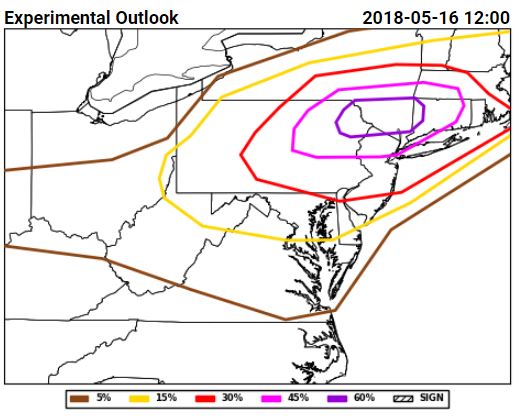
The hail forecasts from the severe hazards desk combined this guidance with environmental analysis information focusing on where the juxtaposition of shear and CAPE would be greatest, and produced probabilistic forecasts that highlighted the area where the largest density of hail forecasts occurred:

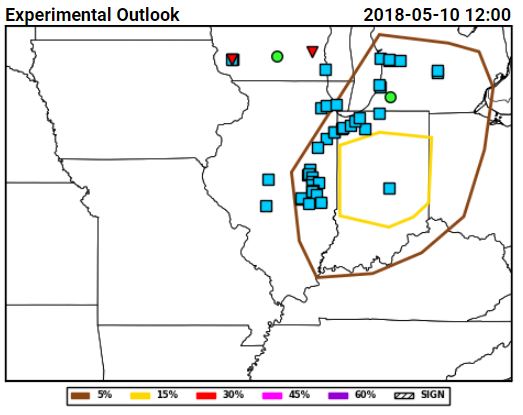
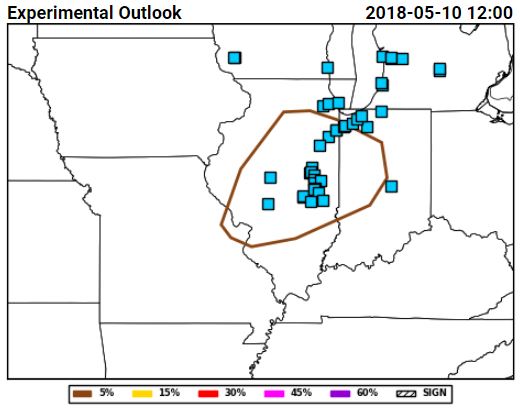
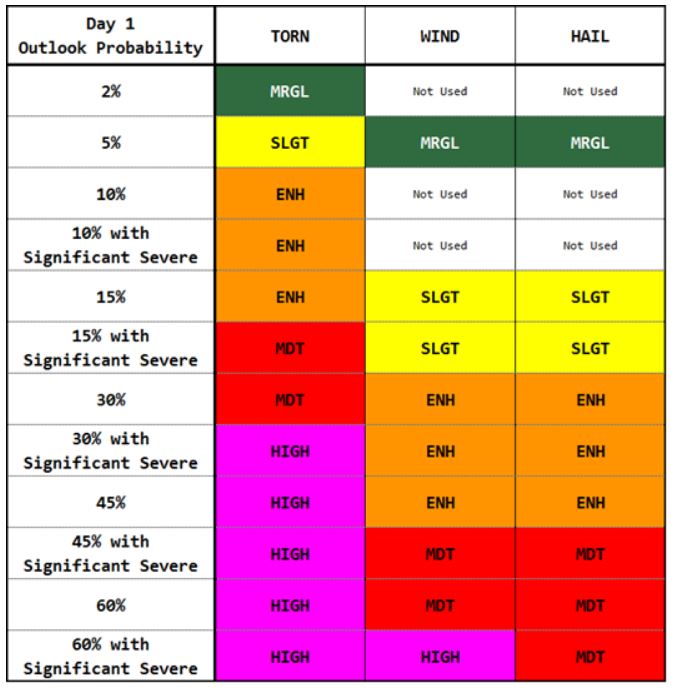
This series of forecasts was made (from left to right) the day before the event, the morning of the event, and the afternoon of the event, and shows how the severe hazards desk was able to hone in on the area at risk and reduce the false alarm area, both between Day 2 and the Day 1 outlook issued in the morning, and between the morning and afternoon Day 1 outlooks. Initially, the 15% contour was tailored the most between the Day 2 and Day 1, reducing false alarm across Minnesota. Then, between the initial forecast and the update, the western extent of the probabilities was trimmed as it became evident where the boundary forcing the convection would be.

Additionally, the forecast here not to indicate a threat of significant hail was far from straightforward. Thinking was that storms would remain discrete, especially on the southern end of the line, and could possess rotation. However, we were not confident that the environment could support the production of severe hail, and so decided to forego introducing areas of significant hail. Given the lack of significant hail reports and greater than or equal to 2″ hail in the MESH, this decision was a good one.

This week’s cases have thus far provided interesting challenges, showing differences between CAM behavior in weakly forced situations and with less-than-ideal environmental parameters. Cases like these are critical in understanding how we can best utilize the CAMs to increase forecaster capability in situations where the solutions are far from evident.

Tags: None

Convection Everywhere!

Well, the theme of the first two weeks of the experiment has been convection, convection, convection! True, this is the theme of all of the Spring Forecasting Experiments, but it has been rare in recent years to have such continuously busy weather throughout the first two weeks of the experiment. Most days thus far, convection is ongoing when we first enter the HWT at 8:00 AM. Multiple times during the first week and a half there have been watches or warnings from the NWS within the area that we’re forecasting for as we walk in the door.

Obviously, this produces a few challenges! First, we have to worry about the severity of the ongoing convection and whether it will strengthen, weaken, or continue on at its current intensity. Second, we have to concern ourselves with the potential for recovery behind an initial round of convection. Finally, we need to worry about storms will develop elsewhere in the domain, ensuring that the ongoing convection doesn’t take all of our attention. While we limit our area of responsibility to a regional domain within the CONUS, we have still faced this problem multiple times within the SFE thus far and occasionally have had issues keeping track of all of the areas of storms within our regions. Even the lower-end severe days, like yesterday, have existing precipitation that we need to determine the evolution of.

Luckily, we have expert forecasters and experimental guidance to help us determine how the convection will evolve. Several ensembles of the experimental convection-allowing models (CAMs) gave useful guidance yesterday, helping us determine the convective mode, timing, and intensity of convection.

One type of plot we examine is the paintball plot, which shows areas of high reflectivity from each ensemble member. It gives us clues to the convective mode, which can help determine what sort of severe hazard we can expect. Here’s an example of the paintballs from yesterday from five different ensemble subsets, with the observed reflectivity overlaid in the hot pink contours:

Though they may look like Jackson Pollock paintings, if you focus on one color you can start to pick out areas of discrete storms as well as areas that look like small line segments. Going through the hours, the linear structures in most ensembles progressed to the east or southeast, while cellular modes remained to the south. While these plots demonstrate what the radar may look like, it doesn’t always give insight to the severity of the storms. The updraft helicity (or UH) has been determined to be a good proxy for severe weather, so we also consider the 4-h maximum UH and the probability of UH exceeding a threshold. Yesterday, we didn’t see much in the reflectivity paintball plots that would indicate severe weather, but the UH told somewhat of a different story!

Those continuous swaths of high UH coming out of Mexico into Texas definitely caught our attention, and our forecasts reflect that there was a chance of a supercell moving across the border into Texas after initiating off of the high terrain. The UH prompted us to take a second look at the mode in the reflectivity plots, confirming that discrete supercells were a possibility.

Sure enough, a discrete supercell moved into Texas, and produced large radar-indicated Maximum Estimated Size of Hail (MESH). When we are in areas with low population, we use MESH to provide a secondary verification source in addition to Local Storm Reports (LSRs), and also look at warnings issued by the local NWS Weather Forecast Offices. Warnings indicate that an expert forecaster saw enough of a threat to warn the public of impending severe weather.

While the only hail LSR occurred across the southern part of Texas, the presence of several warnings and MESH tracks indicating hail greater than 1″ led to these forecasts being rated pretty well by the participants.

With so much convection to examine, even on the more marginal days, we have had a lot of activity in the SFE so far this year. And more looks to be on the horizon! The CAMs will likely provide plenty of convective scenarios in the coming weeks to test their capabilities.

Tags: None

SFE Eve 2019

Ahhh, the evening before the first day of the 2019 SFE….the models are humming, the surveys are waiting in their Chromebooks, and it’s shaping up to be an active week of weather ahead of us! Indeed, the large-scale pattern looks much more favorable for severe weather during the first week of the experiment than it has in years past, when issues with moisture return prevented severe weather from forming for much of the early parts of the experiment.

We have many new and exciting activities for our participants this year, including experimental forecast products such as conditional intensity forecasts and targeted outlooks created using the Warn-On-Forecast System (WoFS), formerly known as the NEWS-e. Yes, you are allowed to yell “WOFS!” at we facilitators if we say “NEWS-e” throughout the experiment…but I can’t guarantee the response you’ll get! Speaking of WoFS, we have 4 hours of evening activities for two participants charged specifically with looking at the WoFS throughout the evening. However, any participants who like will be able to stay and take part in looking at the WoFS throughout the evening. As long as they’re back to evaluate forecasts at 8 AM the next day, we don’t mind at all!

We’re also looking at many new model comparisons. Community Leveraged Unified Ensemble (CLUE) subsets this year include contributions by the Center for the Analysis and Prediction of Storms (CAPS) with the Finite-Volume Cubed (FV3) dynamical core, as well as two ensembles with a Unified Model dynamical core provided by our friends across the pond, the UK Met Office! Altogether, we have at least eight groups contributing models to the CLUE. We’re very excited to see forecasts from these experimental configurations, getting closer to our ultimate goal of determining the best way to configure a CAM ensemble.

Those are just a few of the examples of exciting things in the works for SFE 2019. Watch this space in the coming weeks for more details about specific comparisons, case studies, and musings on the experiment as a whole. Welcome to the most wonderful time of the year!

Tags: None

SFE 2018 Wrap-Up Blog

Well, this wrap-up blog is a bit later than usual, probably due to the amount of communicating we’ve been doing with regards to the Spring Forecasting Experiment at other venues! Multiple talks on different aspects of the SFE took place during the American Meteorological Society’s 29th Conference on Weather and Forecasting/25th Conference on Numerical Weather Prediction Conference in Denver, CO, from 4 June–8 June. Considering that the experiment concluded the Friday before the meeting began, data doesn’t get much fresher than that! The talks included an overview of the experimentdiscussion of the new web capabilities in the 2018 SFEHREF configurations, subjective and objective evaluation of FV3 configurations contributed by different agencies, new experimental verification methods, scorecard development, and examination of the CAPS FV3 Ensemble performance. The official summary report is forthcoming, but those talks provide a great sampling of preliminary results from the experiment.

More analysis is underway, but objective results available on the SFE homepage summarize a small subsample of CAMs according to a preliminary set of performance metrics, including reflectivity at selected thresholds and surrogate severe fields generated from the updraft helicity (UH) fields. These surrogate severe fields will be updated, since the initial tests used a threshold of UH rather than a percentile of UH. As the climatology of UH can vary greatly between models (one model can consistently produce higher UH values) and is grid-spacing-dependent, utilizing a percentile rather than a specific value is better able to capture differences between guidance that otherwise might be masked by different climatologies.

Reflectivity > 35 dBZ CSI scores aggregated over the five weeks of the 2018 SFE for different lead times.

Overall, the HRRRv3 reflectivity fields performed better than either of the FV3 models examined in this comparison, with the most drastic difference starting during the afternoon convective period. This difference is also reflected in the subjective evaluation of the reflectivity and UH fields, with the HRRRv3 receiving more ratings of 7-9 (out of 10) than the other models.

Subjective participant ratings of several convection-allowing models initialized at 0000 UTC

Looking at the varieties of FV3 produced by CAPS with two different microphysics schemes (where participants compared two of the ensemble members which used each microphysics scheme), differences between the reflectivity and UH location were noted most often when compared to reflectivity magnitude and storm mode.

Participant responses to the question, “How do the following variables compare between the FV3 members with the Thompson microphysics and the FV3 members with the NSSL microphysics?”

And how was the weather during the 2018 SFE? Well, the SPC put out a great graphic (below) showing some of the severe weather highlights during the season, and overall, the number of severe thunderstorm and tornado watches were well below average, as were the number of wind and tornado reports. The first and last week of the experiment had the most exciting weather, including a tornado that passed through north Norman (participants were especially attentive on this day, for some reason!). While the weather may not have been fully cooperative, the dataset created from the different NWP models over the 5 weeks of the experiment will surely generate some fruitful results. After all, determining how the NWP is performing over weakly forced cases is critical, as good guidance could help decision-makers to make the right call on days with high uncertainty.

Summary graphic of May 2018 Severe Convective Weather produced by the SPC

The experimental hourly probabilities of severe weather based on guidance from the NEWS-e are also currently being analyzed, pulling together information about how participants used the NEWS-e guidance and which tools they used most frequently alongside the forecast performance and participant opinions about their forecasts and the guidance. The experimental timing forecasts (Potential Severe Timing areas, or PSTs for short) are also currently being analyzed, but proved much more understandable to participants than prior timing products we have tested in the SFE.

Wrapping up, I and the entire SFE team would like to express our appreciation to everyone who helped coordinate and contributed to the experiment. Although it only takes place for five weeks every year, months of planning and development happen beforehand both at the National Weather Center and with our partner agencies throughout the country. We would also like to thank the participants, who share their knowledge, time, advice, and enthusiasm for severe convective weather forecasting during their time in the experiment. As we delve into the results from SFE 2018, let the anticipation for SFE 2019 begin!

Tags: None

FV3 Configurations

Though we do lots of forecasting in the Spring Forecasting Experiment, we also evaluate cutting-edge numerical weather prediction. This year, we’re looking at many iterations of the Finite Volume Cubed model, or FV3, which is slated to eventually replace the GFS as the next generation global prediction system. This year, we have versions of FV3 provided by the Geophysical Fluid Dynamics Laboratory (GFDL; this is where FV3 was developed), the National Severe Storms Laboratory (NSSL), and the Center for the Analysis and Prediction of Storms (CAPS). GFDL and NSSL are each providing one member, while CAPS is providing an ensemble of eleven members that use different microphysics schemes and different planetary boundary layer (PBL) schemes. These different configurations can help illuminate the behavior of this new model core with multiple sets of physical parameterizations, grid spacings and convolutions, and FV3 versions. For more details, see the Operations Plan.

Last Wednesday, May  23rd, provided one of our most interesting case studies for the different versions of CAPS FV3, with differences in the storm structure, location of precipitation, and thermodynamic environment between the different microphysics and the different PBL schemes. The below panels show the reflectivity fields for CAPS FV3 members with four different PBL schemes, all of which use the Thompson microphysics.

Read more »

Tags: None

Domain Decisions

When severe weather is imminent across the country, forecasters at the SPC must consider all of the possible areas. However, here at the SFE where we are considering multiple experimental NWP ensembles, we have to select our domain of interest. When the severe weather is spread across an area larger than a single domain, we must choose which region we want to focus on. To do this, the facilitators consult not only our experimental numerical weather prediction models, but also the upper-air data collected by radiosondes. Typically, the domains have quite a bit of overlap, but on days like last Thursday (17 May), a decision must be made between two very different areas.

After evaluating the previous day’s forecasts, the first forecasting activity for the current day that participants do is the hand-analysis of upper air maps at six different levels: 250 mb, 500 mb, 700 mb, 850 mb, 925 mb, and the surface. This activity ensures that participants get their hands onto the observed data, and develop a thorough understanding where a convectively favorable environments will occur. A map discussion follows (pictures of which can be found on the NSSL Flickr account) where participants share what they’ve learned through their contours. On Thursday, the conversation was far-reaching, as we had to decide between two domains that had very little overlap:

The two potential areas of interest for 17 May 2018, with the eventual selected domain highlighted in green.

Read more »

Consider the Messaging

One of the advantages to having forecasters from the Storm Prediction Center (SPC) working on both the Innovation Desk and the Severe Hazards Desk is that they have experience with issuing outlooks, and how the public reacts to those outlooks. Thus, we can explore the nuance of forecast issuance better than if we were operating without the SPC forecasters. An example of this dynamic occurred on Tuesday this week, with the well-forecast line of storms that moved through the northeastern United States, bringing many reports of wind damage, injuries, and even fatalities. The experimental forecasts issued by both the Severe Hazards Desk and the Innovation Desks were the equivalent of a categorical Moderate Risk from the SPC, which can be triggered by either a 45% forecast of wind with significant wind gusts or a 60% forecast of wind without the significant wind gusts:

On the Innovation Desk side, there was a lot of debate about which type of moderate risk to issue. A categorical high risk was also considered, by debating whether or not to issue a 60% coverage contour with significant severe. Although we thought that there would be pretty high coverage of severe wind reports, the low-level shear and the strong low-level flow that would typically warrant a high-risk scenario were missing on Tuesday. High risk issuance for wind from the SPC is rare (as are high risks in general) and typically reserved for derecho-type events. The last wind-driven high risk was issued by the SPC on 3 June 2014 across Nebraska. Thus, an aggressive moderate was the message the Innovation Desk tried to pursue, with a 45% area and an area of significant severe (wind gusts in this case, although the Innovation Desk considers all types of severe convective weather in issuing its probabilities):

The Severe Hazards Desk issued a moderate that emphasized the high coverage potential of the event, going with a 60% contour with no significant wind highlighted:

Both of these outlooks indicated that the meteorological conditions were unusually favorable for a wind event, with strong mid-level flow and excellent lapse rates for the northeast. However, maintaining the equivalent of a moderate categorical risk communicated that this system, while dangerous and powerful, would not rise to the level of some of the most infamous derechos of years past. In meteorology, as in many things, communication is key.

Tags: None

Forecasting During Quieter Days

Although May is the heart of severe convective season across most of the United States, some days still have relatively little severe convective weather. This has been the case for most of this week, with yesterday having the most severe convective reports of the week (48) according to the Storm Prediction Center’s (SPC’s) storm report page. However, just because there are fewer storms occurring doesn’t mean that operations halt during the Spring Forecasting Experiment – quite the opposite! While we may have fewer probabilistic contours to draw if we don’t have as high of probability on a given day, the placement and magnitude of these forecast contours are still a significant challenge.

These types of days challenge the models in a different way, showing how they perform on days that are less strongly-forced on the synoptic scale or may not have as much available moisture than the days with more storm coverage. Considering that only about twelve days per year reach the level of a moderate risk according to the SPC, lower end days are far more common and thus require thorough testing as well.

This week has so far exemplified a number of different lower risk days, mainly associated with a slow-moving trough progressing across the contiguous United States. On Monday, a smattering of wind and hail reports affected western South Dakota and eastern Wyoming. Absent of strong upper-level flow, terrain was a large consideration in our forecasts. Tuesday saw a handful of hail reports and a tornado report in eastern South Dakota and across Iowa. Ongoing elevated convection in the morning complicated this forecast, as the main area of convective concern was not starting with a clean environment. Yesterday a morning mesoscale convective vortex (which were originally known as “Neddy Eddies” after retired SPC forecaster Ned Johnston) led to questions about when convection would initiate and how well the models captured the relatively small-scale vortex.

Even when our forecasts are challenging and don’t perform as well as we’d like, we still perform subjective verification the following day. Below are the full-period forecasts for Monday for total severe from the Innovation Desk (left) and for wind from the Severe Hazards Desk (right):

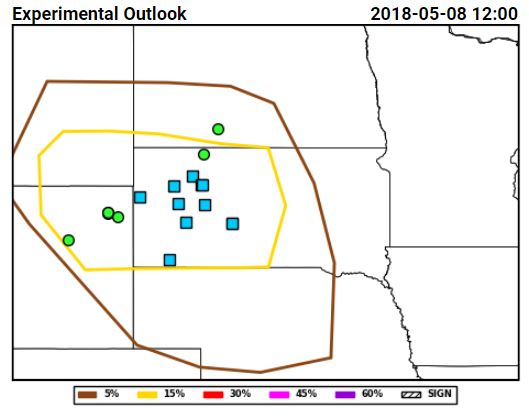
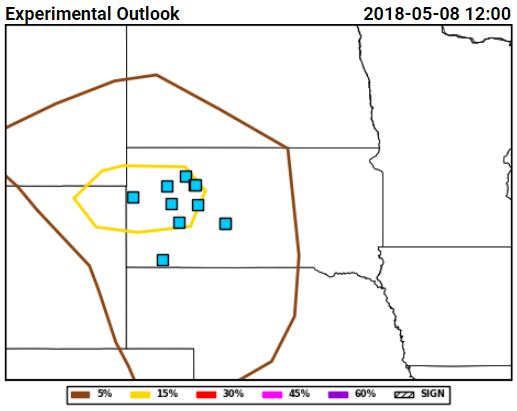
Tuesday for total severe from the Innovation Desk (left) and for hail from the Severe Hazards Desk (right):

and Wednesday for total severe from the Innovation Desk (left) and again for wind from the Severe Hazards Desk (right): 

While these forecasts were far from perfect, we don’t update these full-period forecasts later during the day and issue them by ~10AM CDT. Therefore, these represent our initial impression of the weather for that day after only an hour or two of consideration – and we are getting additional observations and numerical guidance as the day goes on. Particularly on Wednesday, this updated guidance caused us to shift our short time period forecasts (which we do update) as the afternoon wore on. Clearly, more marginal forecasts still present challenges, just different ones than the high-end days. We always have something to consider here during the SFE!

Tags: None