Comparing Experimental QPF Outlooks with Hi-res model/radar data

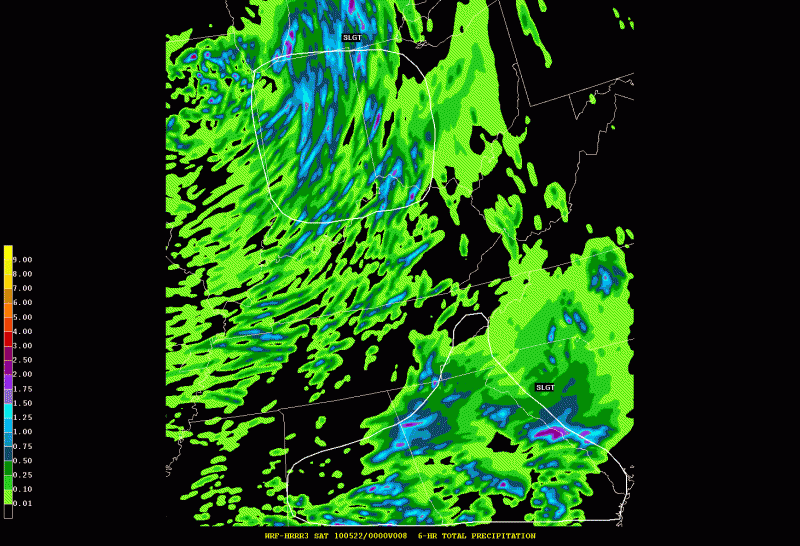
As part of the 2010 HWT Spring Experiment (EFP), two new forecast components were added; Aviation and QPF. After analyzing various high-resolution (hi-res) models, outlooks were created for QPF expected to exceed 0.50 and 1 inch for two time periods (18-00 UTC and 00-06 UTC) for the Day 1 period. In the image below, you will see an example of one of these hi-res (WRF-HRRR) models 6-hour total precipitation overlayed with a “SLIGHT RISK” threat area for QPF exceeding 0.50 inch in the same 6-hour period. Each day during the Experiment, the morning forecast (threat area) was completed by 1530 UTC.

qpf1

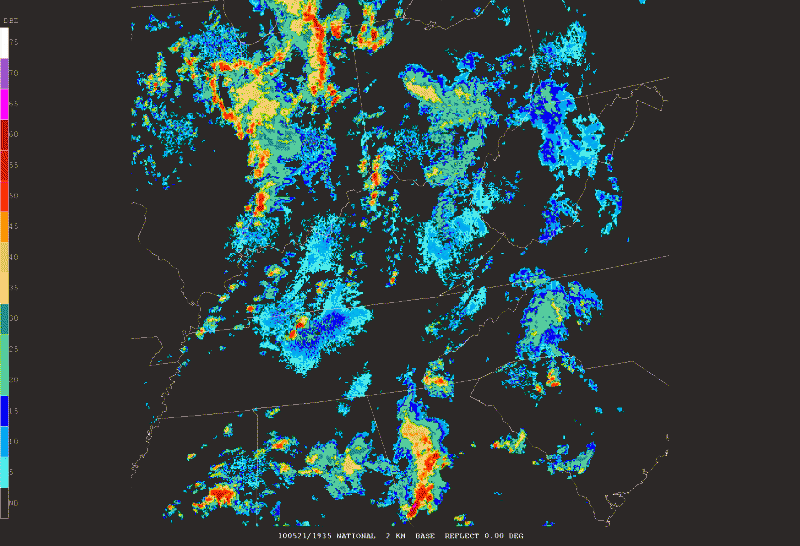
A screen capture of the latest composite reflectivity data is attached to show how the forecast is verifying to this point.

radar_1935z

A “SLIGHT RISK” threat area is defined by 25 percent of the threat area expected to reach or exceed a specific amount (i.e. 0.50 inch).

David Nadler
Warning Coordination Meteorologist
NWS Huntsville AL

Another review from the week of May 18-24

First, as others have mentioned, special thanks to Steve and Jack for hosting the 2009 Spring Experiment. It’s of tremendous benefit to be able to focus on meteorology and consideration of many factors without the distractions of email/phones. Here is a reproduction of portions of a summary I prepared for my forecast staff:

There are considerable issues regarding mesoscale (and potentially stormscale) models being able to reproduce observed convective initiation, morphology, and evolution. Whether it be near-term assistance in high impact decision support services, or long term initiatives such as Warn on Forecast, the future success of improving services beyond detection systems (radar/satellite) depends on the ability of models to portray reality. Current challenges for models include: 1. ability to resolve features, even at high (1 km) resolution; 2. computational limitations; 3. initial conditions and data assimilation; 4. remaining poor understanding of physics and representation of physics in models; and 5. verification of non-linear, object-like features. Identifying where focus should be placed in improving the models is one main goal I found with the EFP. For example, given some set amount of computational resources, should one very high resolution model be run, or an ensemble of lower resolution models? What observations/assimilation/initial conditions seem most critical? Is a spatially correct forecast of a squall line, but with a timing error of 3 hours a “good” forecast? Is it a better forecast than a poor spatial representation of the squall line (e.g., a blob) with spot-on timing?

The main challenge we faced was literally a once in 30-year event of poor convective conditions across the CONUS during the week – the first time SPC did not issue a watch for that corresponding week since 1979, the previous low being 10 watches for the same week in 1984! We did have pulse convection and a few isolated supercells in eastern Montana, eastern Wyoming, and western Nebraska, but it was a challenge for the models to even develop (or in some cases overdevelop) convection. After reflecting on our outlooks, verification, and evaluation/discussion of the models, some general conclusions can be drawn:

1. Mesoscale models are a long way from consistently depicting convective initiation, morphology, and evolution. Lou Wicker and Morris Weisman estimate it might be 10-15 years before models are at the level where confidence in their projections would be enough to warn for storms before they develop, presuming the inherent chaos of convection or lack of initial conditions/data assimilation even allows predictability. Progress will surely be made in computational power, better initial conditions (e.g., radar/satellite/land surface), and to some extent model physics, but there will remain a significant role for forecasters in the foreseeable future.

2. Defining forecast quality is extremely difficult when considering individual supercells, MCSs, and other convective features. What may be an excellent 12 hour outlook forecast of severe convection for a County Warning Area could be nearly useless for a hub airport TAF forecast. Timing and location are just as critical as meteorologically correct morphology of convection. Ensembles may be able to distinguish the most likely convective mode, but offer only modest assistance in timing and location.

3. The best verifying models through a 36-hour forecast seem to be those with 3-4 km grid spacing, “lukewarm” started with radar data physically balanced through the assimilation process. The initialization/assimilation scheme seems to have more of an influence than differences in the model physics. Ensemble methods (portraying “paintball splats” of a particular radar echo or other variable threshold), seem to offer some additional guidance beyond single deterministic runs, although it’s very hard to assess the viability/quality of the solutions envelope when making an outlook or forecast. The Method for Object-based Diagnostic Evaluation (MODE) is a developing program for meaningful forecast verification, based on the notion of objects (i.e., a supercell, an MCS) rather than a grid point based scheme.

Overall, the EFP experience was personally rewarding – an opportunity to get away from typical WFO operations and into applied research. The HWT facility and SPC/NSSL staff were fantastic and made for a high-level scientific, yet relaxed, environment. I strongly encourage anyone interested in severe convection from a forecast/outlook/model perspective to consider the EFP in future years.

-Jon Zeitler
NWS Austin/San Antonio, TX

Tags: None

A Few Thoughts Regarding the HWT Spring Experiment – Mike Fowle

As others have mentioned, I want to thank the SPC and NSSL for coordinating the program once again this year. As a first year participant, I found the experience both challenging and rewarding. Although the overall magnitude/coverage of convective weather continued to be generally below normal – there were still plenty of forecast challenges to keep us busy throughout the week.

Now for some observations (mainly subjective) about a few of the issues we encountered:

1. Having completed a verification project on an early version of the MM5 (6KM horizontal grid spacing) back in the late 1990s, it was interesting to see the current evolution of mesoscale modeling.While there have been many changes/improvements (e.g. microphysics schemes, PBL schemes, radar assimilation, etc) it was evident to me that many of the same problems we encountered (sensitivity to initial conditions, sensitivity to model physics, parameterization of features, upscale growth, etc) still haunt this generation of mesoscale models.

2. With the increase in computer power, we are now able to run models with a horizontal grid resolution of 1km over a large domain in an operational setting!However, examining the 1km output did not seem to add much (if any) value over 4km models – especially considering the extra computational expense.

3. All of the high resolution models still appear to struggle when the synoptic scale forcing is weak.In other words, modeling convective evolution dominated by cold pool propagation remains extremely challenging.

4. The output from the high resolution models remains strongly correlated to that of the parent model used to initialize. Furthermore, if you don’t have the synoptic scale conditions reasonably well forecast, you have little hope in modeling the mesoscale with any accuracy.

5. Not surprising, each model cycle tended to produce a wide variety of solutions (especially during weak forcing regimes) – with seemingly little continuity amongst individual deterministic members (even with the same ICs), or from run to run. Sensitivity to ICs and the lack of spatial and temporal observations on the mesoscale remains a daunting issue!

Even with some of these issues, on most days the high resolution models still provided valuable guidance to forecasters – most notably regarding storm initiation, storm mode, and overall storm coverage.Although the location/timing of features may not be exactly correct, seeing the overall “character of the convection” can still be of great utility to forecasters especially considering they are not available in the current suite of operational models (i.e. NAM/GFS).

From a field office perspective – one of the big challenges I see in the future is how to best incorporate high resolution model guidance into the “forecast funnel.” Being that many forecasters already feel we are at (or even past!) the point of data overload, they need proof that these models can be of utility in the forecast process. Moreover, I believe that on an average day, most forecasters can/will devote at most 30-60 min to interrogate this guidance. Is this sufficient time? During the experiment we were devoting a few hours to evaluating the models – and I still felt we were only scratching the surface.

Next, what is the best method to view the data? A single deterministic run? Multiple deterministic runs? Probabalistic guidance from storm scale ensembles? Model post products (i.e. surrogate severe)? Some combination of the above? In addition, what fields give forecasters the most bang for the buck? Simulated reflectivity, divergence, winds, UH, updraft/downdraft strength? Obviously many of these questions have yet to be answered, however what is clear to me is that significant training is going to be required regarding both what to view, and how to view it.

In terms of verification, the object based methodology that DTC is developing is an interesting concept. Although still in its infancy, I like the idea and do see some definite utility. However, as we noted during the evaluation, it still appears as though this methodology may be best suited for a “case study” approach rather than an aggregate (i.e. seasonal) evaluation (at least at this point).

As echoed by others, it was a privilege to be a participant in this year’s program and I would jump at the opportunity to attend in future years. In my humble opinion, I think the mesoscale models have proved long ago that they do have utility in the forecast process – if used in the proper context. There are obvious challenges to embark upon in the years to come, and I look forward to seeing the continued evolution of techniques/technology in future years.

Tags: None

11-15 May 2009 Spring Experiment

I would like to thank SPC, NSSL, and others for the invitation to participate in the 2009 HWT. As most of you are aware (either through discussions with me or your experiences sitting at an airport for hours waiting for a delayed flight) the socioeconomic impacts of convective weather on the aviation industry are substantial. Attending the HWT is a way to grasp where the edge of the science is and establish a reality check for myself and to share with others as we work towards NextGen. It is an intriguing experience to learn from both operational forecaster feedback and our own forecasts we developed at HWT that the solution to increased accuracy does not correlate to higher model resolution as some might believe. Having an HWT week with an aviation focus is a good way for this research to get some exposure in a capacity that it may not have been designed for but illustrates potential utility and benefit.

I have pointed out things like Simulated Reflectivity from the HWT last year that has gained attention based on potential utility in using the data at a high level to get an understanding of what the National Airspace System scenario might look like for the day. Although it may never verify due its deterministic nature and is somewhat noisy it is good visual aid for an Air Traffic Flow Manager (non meteorologist) to get a quick frame of reference on potential systemic impacts.

Other forecasts like the Probability of >=40dbz intensity within 25 miles of point and the 18 member ensemble for 40dbz intensity could have enormous value for the aviation industry as 40dbz is also the level of intensity that aircraft no longer penetrate thus causing deviations and ultimately delays. Research on convective mode was another area I found myself intrigued with as convective mode from an aviation perspective provides a frame of reference to determine the permeability of the convective constraint. Discreet cells and linear convection can be equally disruptive but would be managed very differently if forecast with a high degree of skill so modal info for aviation is equally important as location and timing.

Thanks for a great week!
John

Tags: None

Reid Hawkins’ view of the June 1-5 HWT Spring Experiment

As I sit here at the Will Rogers Airport in Oklahoma City waiting on a plane that is 2 hours late, I wanted to reflect on my experiences with the 2009 HWT Spring Weather Experiment. This reflection will be in more in the style of stream of consciences so I hope someone out there can follow it.

1st a well deserved round of applause for Steve W, Jack, and Matt on steering us through the plethora of numerical models and the objective verification techniques of DTC. Our week started off with a rather well behaved and straight forward event over the northern Mississippi Valley into the northern plains. The second day was a highly frustrating forecast over Oklahoma, Kansas, and Northern Texas where overnight convection and gravity wave played havoc to the forecast and lack of convection over Oklahoma. The third day was even more frustrating with a weaker forced case south of an east-west stationary front from northern Virginia and back to Kentucky. The final case was a high plains case from Wyoming and Nebraska southward to the Texas Panhandle.

For our week of evaluating the models, my first impression was the number of models that provided a whole host of solutions. Through experience from the staff, they steered us to look at the reflectivity fields, outflows and updrafts instead of digging ourselves into a myriad of model fields that no one could have possibly looked at in the short time we had to prepare a forecast outlook. After shifting my paradigm to this style of forecasting which was somewhat uncomfortable, it was a comfortable feeling when we saw similar results from the models. This was not a common event as most of the cases were marginal or weakly forced.

One concern I have is that I did not see a huge bang for the money in the 1 km Caps model runs vs. the 4 km Caps models. There was a huge discussion about the assimilation of the data into the models and my thoughts are that until we sample the atmosphere with higher resolution, frequency and more accurately then I do not see where the higher scale models will provide better results for forecast operations. This is just an opinion and I hope the modelers can prove me wrong.

Another concern, I have is the way the data is displayed to the forecaster. With the wealth of data that is available and our current display techniques, I am afraid this has or will force many forecasters to find a comfort level of what data types to use. This means there may be valuable data sets to view but due to comfort level and time constraints these data sets may never be used.

Overall, the week was extremely enlightening on seeing the techniques that are being developed to help the forecaster. In time as the development envelop is pushed, I expect to see great information delivered to the operational desk. I am somewhat disheartened but not surprised on the lack of help we saw in weakly forced environments.

Tags: None

My impressions from the week May 11-15th

Finally got a chance to type some words (I hope not to many) after getting back to the UK.

First I would like to say thank you for a very enjoyable week in which I feel that I’ve come away learning a great deal about the particular difficulties of predicting severe convection in the United States and gained more insight into the challenges that new storm-permitting models are bringing. I was left with huge admiration for the skill of the SPC forecasters; particularly synthesising such a large volume of diverse information quickly (observational and model) to produce impressive forecasts, and to see how an understanding of the important (and sometimes subtle) atmosphereic processes and conceptual models are used in the decision-making process.
I was also struck by the wealth of storm-permitting numerical models that were available and how remarkably good some of the model forecasts were, and can appreciate the amount of effort that is required to get so many systems and products up, running and visible.

One interesting discussion we touched on briefly was how probabilistic forecasts should be interpreted and verified. The issue raised was whether it is sensible to verify a single probabilistic forecast.
So if the probability of a severe event is say 5% or 15% does that mean the forecast is poor if there were no events recorded inside those contours? It could be argued that if the probabilities are as low as that, then it is not a poor forecast if events are missed, because in a reliability sense we would expect to miss more than we get. But the probabilities given were meant to represent the chance of an event occurring within 25 miles of a location, so if the area is much larger than that it implies much larger probabilities of something occurring somewhere within that area. So it may be justifiable to assess the forecast of whether something occurred within the warning area as if it is almost deterministic, which may be why it seemed intuitively correct to do it like that in the forecast assessments. The problem then is that the verification approach does not really assess what the forecast was trying to convey.
An alternative is to predict the probability of something happening within the area enclosed by a contour (rather than within a radius around points inside the contour), which would then be less ambiguous for the forecast assessment. The problem then is that the probabilities will vary with the size of the area as well as the perceived risk (larger area = larger probability), which means that for contoured probabilities, any inner contours that are supposed to represent a higher risk (15% contour inside 5% contour), can’t really represent a higher risk at all if they cover a smaller area (which they invariably will!). So at the end of all this I’m still left pondering.

The practically perfect probability forecasts of updraft helicity were impressive for the forecast periods we looked at. Even the forecasts that weren’t so good seemed to appear better when the information was presented in that way and they seemed to enclose the main areas of risk very well.

The character of the 4km and 1km forecasts seemed to be similar to what we have seen in the UK (although we don’t get the same severity of storms of course). The 1km could produce a somewhat unrealistic speckling of showers before organising on to larger scales. Some of the speckling was precipitation produced from very shallow convection in the boundary layer below the lid and was spurious. (We’ve also seen in 1km forecasts what appear to be boundary-layer roles producing rainfall when they shouldn’t, but the cloud bands do verify against satellite imagery even though the rainfall in wrong).
The 4km models appeared to have a delay in initiation in weakly forced situations (e.g. 14th May) which wasn’t apparent in the strongly forced cases (e.g. 13th May). It appeared to me that the 1km forecasts were more likely to generate bow-echoes that propagate ahead (compared to 4km) and on balance this seemed overdone. There was also an occasion from the previous Friday when the 1km forecast generated a MCV correctly when the other models couldn’t, so perhaps it indicates that more organised behaviour is more likely at 1km than 4km – and sometimes this is beneficial and sometimes it is not. It implies that there may be general microphysics or turbulence issues across models that need to be addressed.

It was noticeable that the high-resolution models were not being interpreted literally by the participants – in the sense that it was understood that a particular storm would not occur exactly as predicted and it was the characteristics of the storms (linear or supercell etc) and the area of activity that was deemed most relevant. Having an ensemble helped to emphasise that any single realisation would not be exactly correct. This is reassuring as a danger might be that kilometre-scale models are taken too much a face value because the rainfall looks so realistic (i.e. just like radar).

It seemed to me that the spread of the CAPS 4km ensemble wasn’t particularly large for the few cases we looked at – the differences were mostly local variability, probably because there wasn’t much variation in the larger-scale forcing. The differences between different models seemed greater on the whole. The members that stood out as being most unlike the rest were the ones that developed a faster-propagating bow-echo. This was also a characteristic of the 1km model and was maybe a benefit of having the 1km model as it did give a different perspective, or added to the confusion, however you look at it! One of the main things that came up was the shear volume of information that was available and the difficulty of mentally assimilating all that information in a short space of time. The ensemble products were found to be useful I thought – particularly for guidance in where to draw the probability lines. However, it was thought too time-consuming to be able investigate the dynamical reasons why some members were doing something and another members something else (although forecaster intuition did go a long way) . Getting the balance between a relevant overview and sufficient detail is tricky I guess and won’t be solved overnight. Perhaps 20 members were too many.

The MODE verification system gave intuitively sensible results and definitely works better than traditional point-based measures. It would be very interesting to see how MODE statistics compared with the human assessment of some of the models over the whole experiment.

One of the things I came away with was that the larger-scale (mesoscale rather than local or storm scale) dynamical features appear to have played a dominant role whatever other processes may also be at work. The envelope of activity is mostly down to the location of the fronts and upper-level troughs. If they are wrong then the forecast will be poor whatever the resolution. An ensemble should capture that larger-scale uncertainty.

Thanks once again. Hope the rest of the experiment goes well.
Nigel Roberts

Wednesday

Wednesday morning we talked about severe reports. Is “practically perfect” the way to go? How do we deal with people-sparse regions? Can or should we add an uncertainty to the location and time and veracity of each report?

With our current capability, we can’t reliably forecast whether a storm will be a wind or hail producer. I think that is what John Hart suggested.

Yesterday, the 0-4Z forecast ensemble was too eager to produce high updraft helicity severe weather for the first 20-0Z forecast period, but the 0-4 Z period was forecast almost perfectly. Ryan said UH is usually better than surface wind and hail (graupel).

The MODE area ratio is not as useful as area “bias”. Ratio is small-over-big and doesn’t tell you if the forecast is biased high or low.

I summarized bias, GSS, and MODE results for yesterday. For CSI, Radar assimilation jumped out to an early lead, but joined the control run at near-zero after 3 hours. MODE had some spotty matches, but no clear winner.

Dave Ahijevych

Tags: None

Tuesday

We talked about Monday evening weather in Montana and how the forecasts went.

NMM had a high false alarm rate but was the only model to correctly predict the severe storm in ID. ARW missed the storm by 200km to the southeast. Another comparison we always make here at the HWT is the 0Z vs the 12Z runs of thhe NMM. For this day, I think the 12Z NMM was much better than the 0Z. Steve thought it was “somewhat” better. The 12Z run had less false alarms in central MT and captured the ID storm area better.

The probability matched mean is an interesting way of summarizing the ensemble of forecasts. It has the spread of the ensemble, but the sharpness of an individual run. I’m not sure but I was told to check out Ebert/McBride for a reference on this.

The Monday forecast was pretty insignificant, so we also talked about the high-end derecho on Friday May 8. There were some differences between the 1 and 4-km CAPS solutions of this event. (I forget what they were).

David Ahijevych