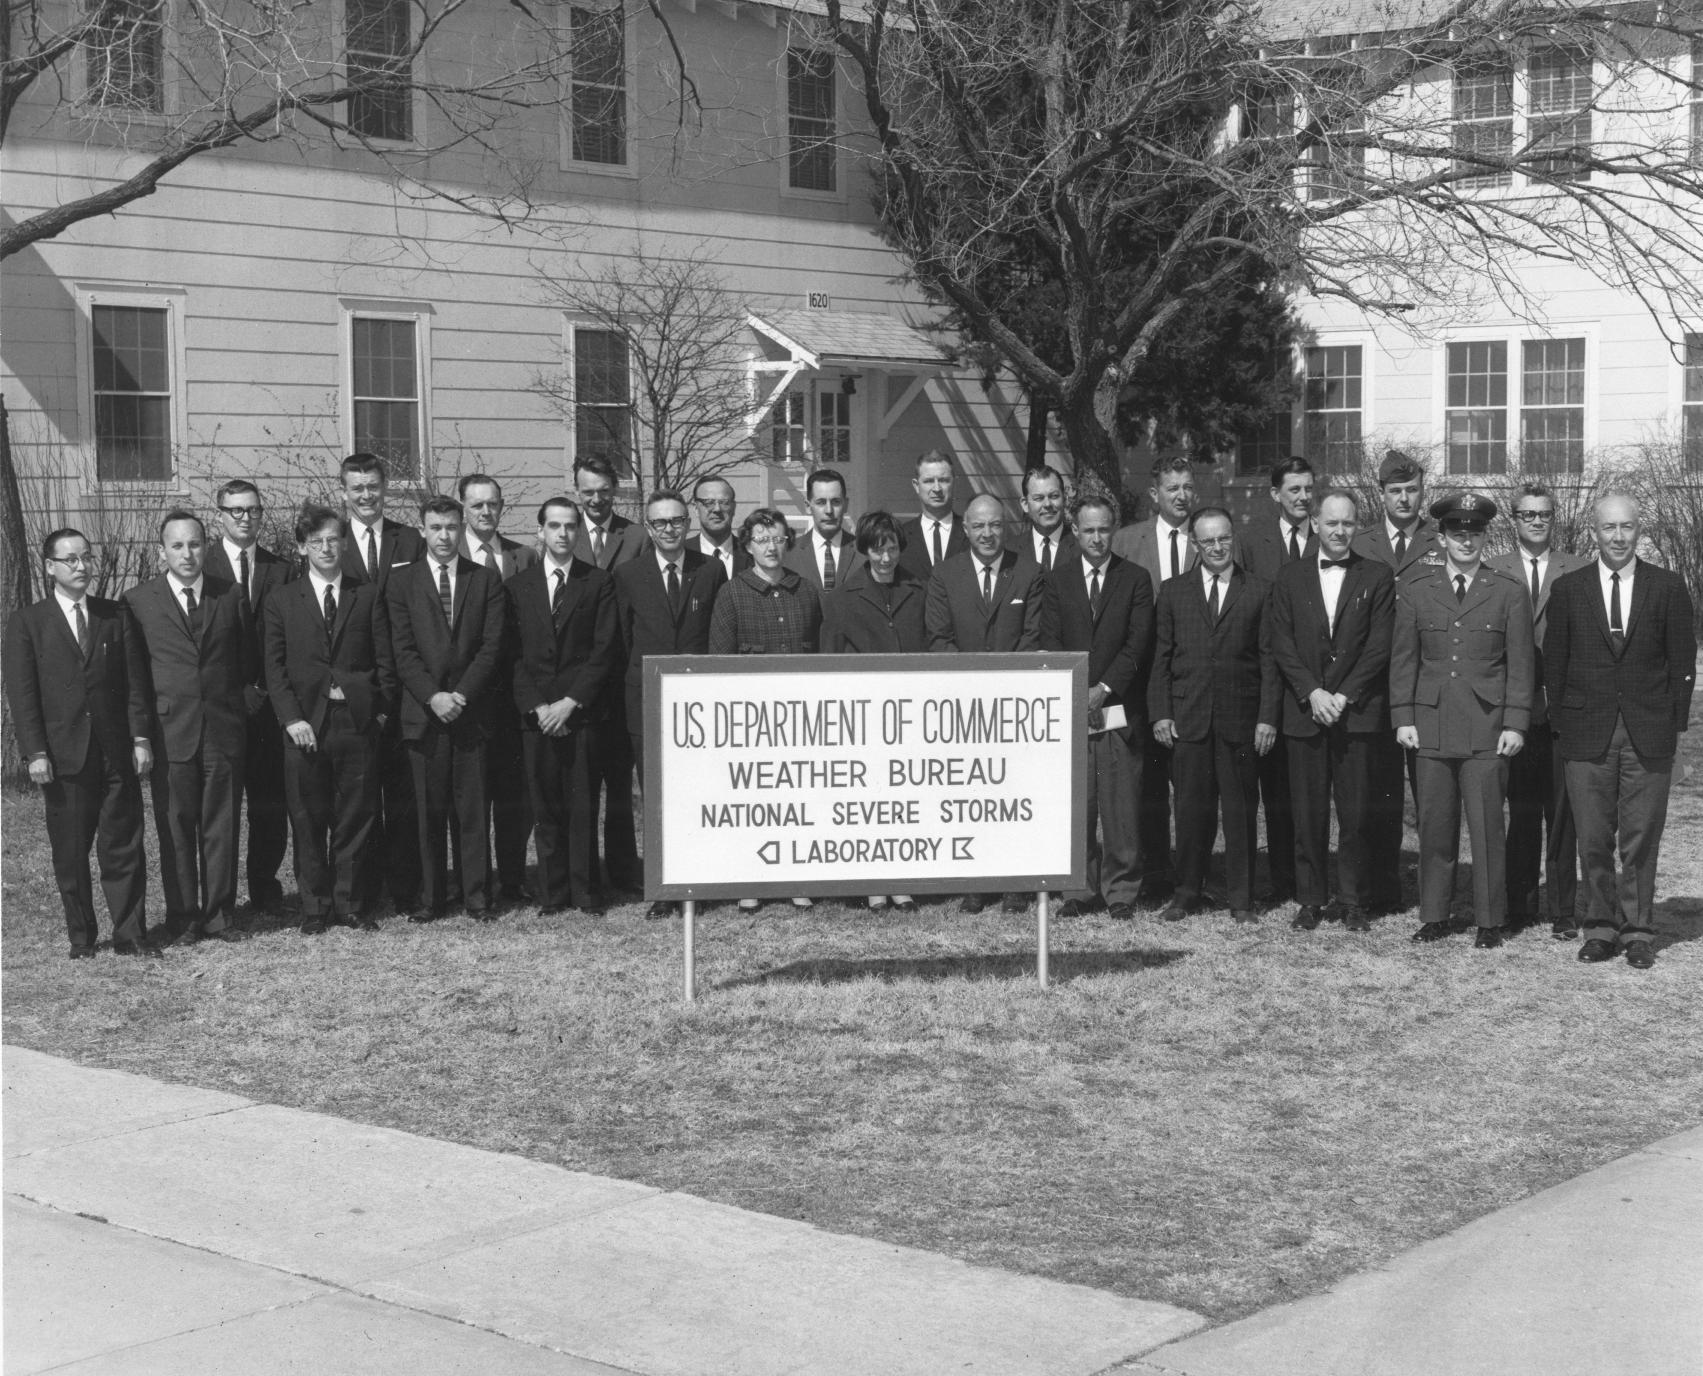
 NOAA’s National Severe Storms Laboratory is celebrating 51 years of history. We have a proud legacy of improving understanding of severe weather and developing tools that assist our partners in NOAA’s National Weather Service as well as various other federal, public, and private groups. We are committed to protecting lives and property through our continued and ever-expanding research. Take a look back at some of the milestones in our first two decades:
1964
The entire National Severe Storms Project operation moves from Kansas City to Norman and is reorganized as the National Severe Storms Laboratory with Edwin Kessler as the new director.

In 1956, Cornell Aeronautical Laboratory built a 3 cm continuous wave Doppler radar that used one antenna to transmit and another to receive. This radar, built for the U.S. Weather Bureau, was designed to detect very high wind speeds in tornadoes, but could not determine the distance to the tornadoes. In 1964, NSSL engineers modifed this radar to transmit in pulses. The pulsed Doppler radar could receive data in between each transmit pulse, eliminating the need for two antennas and solving the distance problem.
1965
Aircraft flew into thunderstorms to measure turbulence during Project Rough Rider in the 1960s, ’70s and early ’80s. This data was combined with measurements of the intensity of the rain from NSSL’s WSR-57 research radar to understand how thunderstorm echoes and turbulence are related. This research led to improved commercial airline safety guidelines in the vicinity of thunderstorms that are still in use today.
1967
Cornell Aeronautical Laboratory brought its 3 cm Doppler radar to Oklahoma to join NSSL’s 3 cm Doppler radar for the first dual-Doppler experiment in the United States. The two radar were placed so that each had a different view of the same storm.
1969
NSSL obtains a surplus 10 cm Doppler radar that had been used by the U.S. Air Force.
1971
The experimental NSSL 10 cm Doppler radar becomes operational.
1973
NSSL engineers create a contoured black and white display, a vast improvement from the grid of numbers currently in use.
On May 24, an NSSL team intercepts a storm being scanned by the NSSL Doppler radar. The team documents the entire life cycle of the tornado on film. Researchers are able to compare the film images with Doppler radar data and discover a pattern that meant the tornado was forming before it appeared on film. They name this pattern the Tornado Vortex Signature (TVS). This important discovery eventually led to NOAA to deploying a nationwide network of Doppler radars.
This same year, NSSL commissions a second Doppler radar 15 miles west of Oklahoma City and names it the Cimarron radar. This gives NSSL the ability to conduct dual-Doppler experiments by simultaneously scanning the same storm with both radars.
1975
NSSL’s legacy in organized field experiments begins with the Tornado Intercept Project in 1975 led by NSSL’s Bob Davies-Jones. NSSL’s Don Burgess provided storm intercept crews with live radar information via radio—and the term, “nowcaster,” was born.
NSSL engineers develop a color display for Doppler radar data.
1976-1978
NSSL conducts the Joint Doppler Operational Project (JDOP) to prove that Doppler radar could improve the nation’s ability to warn for severe thunderstorms and tornadoes. This led to the decision in 1979 by the National Weather Service (NWS), the U.S. Air Force’s Air Weather Service, and the Federal Aviation Administration (FAA) to include Doppler capability in their future operational radars.
View the complete NSSL timeline here.
For More:
NSSL: 1980-2000
NSSL: 2000-2010
NSSL: The Modern Era


