New NOAA awards to fund studies of weather warnings, social media, Internet tools and public response

New NOAA awards to fund studies of weather warnings, social media, Internet tools and public response

How do people sift important weather information out of the incessant buzz of 24/7 social media, text messages, smart phone app alerts, overflowing email inboxes, the blogosphere, and traditional print and broadcast media? Four new research awards funded by NOAA seek to answer this question and to improve the way potentially life-saving weather warnings reach those who need to act on them.

The awards, totaling about $879,000 for four, two-year projects, are being awarded by the Office of Weather and Air Quality in the NOAA Office of Oceanic and Atmospheric Research with funding from the U.S. Weather Research Program and the NOAA National Weather Service.

“These projects apply innovative social science research methods to the immense challenge of communicating crucial weather information in an increasingly complex world,” said Kathryn Sullivan, Ph.D., assistant secretary of commerce for environmental observation and prediction and NOAA deputy administrator. “The results are expected to improve communication within the weather community and motivate appropriate responses from the public when dangerous weather threatens.”

University and nonprofit social science and weather researchers will lead the projects, which support the NOAA Weather-Ready Nation initiative. NOAA experts from the Storm Prediction Center, National Severe Storms Laboratory, weather forecast offices, and river forecast centers will collaborate on them. Award recipients include the Cooperative Institute for Mesoscale Meteorological Studies, the University of Oklahoma, Arizona State University, East Carolina University, the University of North Carolina, and the Nurture Nature Center in Easton, Penn.

Tornadoes and Twitter: A two-year award of $250,000 will fund research on how Twitter messages could be tapped as a source of local weather observations and how Twitter could be used to share weather updates. Carol Silva, Ph.D., associate director of the Center for Applied Social Research at the University of Oklahoma in Norman, Okla., will lead this project. Part of the project will explore the promise and possible pitfalls of using Twitter in severe weather forecasting operations. Another phase of the research will study the nature and content of tweets about severe weather events. In the final phase, researchers will work with the NOAA National Severe Storms Laboratory and the NOAA Storm Prediction Center to assess possible use of Twitter data in detecting and tracking storms, issuing warnings, and assessing damage after a storm.

An inundation of flood data: A two-year award of $160,000 will fund research to develop strategies to improve online flood forecasting tools and to better motivate residents to prepare for floods and respond to flood warnings. Rachel Hogan Carr, director of the Nurture Nature Center of Easton, Penn., will lead the project. The Nurture Nature Center is a non-profit organization that has previously partnered with NOAA and NWS on flood education. The center will partner with the NWS Middle Atlantic River Forecast Center and NWS Weather Forecast Offices in Mt. Holly, N.J., and Binghamton, N.Y., to assess NWS flood forecast and warning tools. The aim is to help NWS understand how people living in the Delaware River Basin use NWS online tools to understand and prepare for flood risk

Deciding to seek shelter: A two-year award of $75,000 will fund research to explore factors that explain why some people rush for shelter when they receive a tornado warning and others do not. Renee McPherson, Ph.D., associate professor of geography and environmental sustainability at the University of Oklahoma (OU), will lead this project. She is a fellow of the Cooperative Institute for Mesoscale Meteorological Studies (CIMMS), a partnership between NOAA and OU. Researchers will identify the factors relevant to an individual’s response to a tornado warning, specifically the NWS polygon warning tool which defines a geographic danger zone. They will collaborate with the NWS Warning Decision Training Branch and the NOAA National Severe Storms Laboratory.

Managing a weather emergency: A two-year award of $394,000 will fund research on how NWS can improve its products and services to feed helpful information into the complex network of people who manage public emergency services. Kenneth Galluppi, director of the Arizona State University Decision Theater, will lead this multi-institution project with Arizona State University, East Carolina University, the University of North Carolina, and CIMMS at the University of Oklahoma. For several years this team has been studying how the emergency management network – managers of public services such as transportation, police and fire units, and utilities – processes weather information. This project will build on earlier studies and will produce recommendations for NWS forecasters.

Share this:

Super Rapid Scan Experiment combines satellite, radar and lightning observations

GOES-14 image from August 16, 2012

As storms moved across Oklahoma yesterday, the GOES-14 satellite, Multi-function Phased Array Radar (MPAR) and the Oklahoma Lightning Mapping Array (OK-LMA) coordinated data collection for the first time as part of the Super Rapid Scan Experiment.

The goal to of the project is evaluate the potential of these combined observations for forecasting and warning of severe storms.

The GOES-14 satellite has been taken out of storage (currently in orbit over the equator at 105 degrees west) to collect 1-minute satellite imagery over target areas when storms are expected. When thunderstorms move through Oklahoma, MPAR will also scan these storms at a rate of1-minute or less.  The LMA’s will map the location and development of of lightning channel segments over the same areas.

The first of the next generation of geostationary satellites (GOES-R), scheduled to be launched in late 2015, will be able to routinely scan at 1-minute frequency with increased spectral and spatial resolution.  It will also carry an optical lightning detection system (Geostationary Lightning Mapper) to measure total lightning (in-cloud and cloud-to ground) with high temporal and spatial resolution. The LMA measurements during these tests will be used to help assess the impact of the satellite-based lightning data when it becomes available with GOES-R.

The experiment runs from August 16, 2012 through about October 31, 2012 and is a coordinated effort between NSSL and the NESDIS Office of Satellite and Product Operations, and the NESDIS Center for Satellite Applications and Research (STAR) Advanced Satellite Products Branch in Madison, WI, and the GOES-R program office.

Real-time satellite imagery is being made available on the Web and on workstations (N-AWIPS) at the SPC:

http://cimss.ssec.wisc.edu/goes/srsor/GOES-14_SRSOR.html

http://www.ssec.wisc.edu/~rabin/goes14/loop_srso.html

Share this:

NSSL scientist teaches students about weather in Barrow, Alaska

Bob Rabin stands under whale bones in Barrow, Alaska

A team of scientists including NSSL’s Bob Rabin introduced North Slope Alaska Native students from Barrow, Alaska, and other small villages to weather and climate science through two STEM courses recently. Held on the campus of the Ilisagvik College, the classes were designed for students to explore various disciplines addressing climate change.

Students are learning to draw contour lines on weather maps

During the first session, Rabin presented remotely from Norman, Okla., to students in grades 10 and up.  Activities were designed to give students an opportunity to learn about remote observations such as satellites, and how they are used in research and weather forecasting.  Topics covered by other scientists included the carbon cycle, land cover changes, radon and permafrost, data visualization and documentation.

During the second course, Rabin presented a full day of activities in Barrow that included satellite basics, observations and weather forecasting for grades 7-9.  The students then participated in a contest based on their forecasts of temperature, pressure and wind for the following few days.  Tours and hands-on activities were provided at the National Weather Service Weather Office in Barrow (lead by Dave Anderson, Officer in Charge), and at the ESRL/Global Monitoring Division observatory (lead by Matthew Martinsen, Station Chief).

Students make observations at ESRL's site
Sea ice in Barrow

Barrow is located 500 miles north of Fairbanks. The Barrow community and the smaller villages of the North Slope of Alaska depend heavily on subsidence living. “Their connection with the environment is very strong,” Rabin said.  “There seems to be a keen awareness and concern for the effects of the weather on food supply, especially whaling and hunting caribou.”

In collaboration with local elders, Rabin hopes to help develop an online course on weather and climate of the North Slope at Ilisagvik College. The course could incorporate some of the traditional ways people predicted and understood the weather and may include installation of a simple weather station at the college.

Ilisagvik College in Barrow, Alaska

Keep scrolling for more photos.  What are the chances of you ever getting to visit Barrow?

Barrow Science Lab
The Arctic Ocean
Students look at weather models
The Ilisagvik campus
Share this:

The Tornado “Drought” of 2012

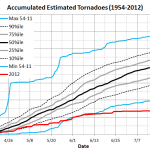
UPDATE (14-Aug-2012): Graph corrected to indicate 2006 as previous 15 Apr-31 Jul minimum.

The 2012 tornado season in the United States got off to a quick start with well-above average numbers in January, February, and March. Later, over 80 tornadoes occurred on 14 April. Since then, the number of tornadoes in the US has been unusually low. In order to understand how low, we need to look at the long-term history of tornado occurrence. The most reliable portion of the tornado data begins in 1954 but, even after that, we have to be careful in how we interpret it. Since the mid-1950s, the number of tornadoes reported has increased by an average of 14 per year. The increase has been almost entirely in the weakest tornadoes (F0) and is highly likely that the causes are non-meteorological. We can think of this increase in the same way we think of inflation in economics and estimate its impact by adjusting historical tornado counts to account for it. This process, and how it can be applied to part of the year, is discussed here.

That inflation-adjustment process allows us to look at historical data, but a problem still remains of how to look at recent reports. Preliminary, eyewitness reports of tornadoes are collected by local National Weather Service Forecast Offices and the offices then evaluate those reports and produce a list of “final” tornado reports. This process of evaluation takes a few months to complete, so it can be challenging to answer the question “how many tornadoes occurred” shortly after an event. Over the last several years, a simple relationship between the preliminary and final reports has been observed with the number of final reports being approximately 85% of the preliminary reports. As a result, when looking at the preliminary reports in recent months, we can a pretty good estimate of the final reports simply by multiplying the preliminary reports by 0.85.

Let’s look at how many tornadoes we would expect based on the inflation-adjusted tornado count and compare this year’s tornadoes to that long-term expectation. To emphasize the small number of tornadoes since the middle of April, we’ll start on 15 April and add up the number of tornadoes each year through the end of July. In the accompanying chart, we see the distribution of the accumulated number of inflation-adjusted tornadoes as we got from 15 April-31 July. The distribution is based on the period from 1954-2011. The maximum and minimum of any of those years are shown in blue (note that the year associated with the maximum and minimum can change from day to day along the way). The heavy black line is the median of the distribution, the gray lines are the 25th and 75th percentiles (half the years will be between them), and the dashed lines are the 10th and 90th percentiles (4 out of 5 years will be between them). For comparison, the estimated number of final tornado reports from 2012 are shown in red.

Accumulated number of tornadoes from 15 April-31 July from 1954-2011 with 2012 compared to it.

Through the end of May, the tornado count for the period from 2012 goes along at approximately the 10th percentile of the long-term distribution but, after that, falls well below the previous low. To put this into perspective, the estimated number of final reports from June for 2012 is approximately 100. The previous inflation-adjusted low for any previous June is 94 in 1988. (Remember that the blue line represents the fewest number of tornadoes from any of the 58 years from 1954-2011.) The median number of June tornadoes in 1954-2011 was approximately 270.

July was even more remarkable than June. Only 24 preliminary reports were received, leading to an expected number of final reports of a little over 20. The lowest number of inflation-adjusted tornado reports from 1954-2011 is 73 (1960). Even without inflation adjustment, the fewest number of tornadoes in any July in that time period is 42 (1960), emphasizing the extraordinary nature of this July. The median number of July tornado reports is about 150.

When we look at the whole period from 15 April-31 July, the median tornado count in the record is 850, compared to 2012, with a little under 300. The 850 represents almost 2/3 of the usual annual total of about 1300. One way of thinking about the late spring and early summer tornado season is that the atmosphere missed more than 40% of a typical year’s tornadoes in 3 1/2 months. Compared to 2003, the comparable period in 2012 had more than 900 fewer tornadoes. 2011 had the second highest number of tornadoes in this part of the year, so in the last two years, the US has experienced the extreme high end of the distribution of the number of tornadoes and the extreme low end of the distribution.

Share this:

Researchers plan first extensive U.S. study looking for link between cities and storms

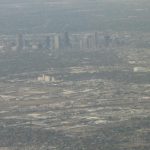
A group of researchers, including NSSL’s Dave Stensrud, recently announced they plan to study the effects of cities on thunderstorms. Looking at a number of different U.S. cities, the project hopes to clarify how urban pollution, canopy, and surrounding landscape influences the intensity and track of an approaching thunderstorm.

Stensrud is a principal investigator on the three-year $1.5 million NASA grant.

Researchers will use data from the space-borne MODIS sensors on NASA satellites to look at city shape and size, as well as pollution and other aerosols, for selected cities in the Great Plains.  These measurements, along with geographic data of the urban canopy and the vegetation of surrounding rural areas, will be combined with archived radar data of storms in high-resolution computer simulations.

“We are going to set up and run the model many times but with different variables; city or no city, pollution or vegetation,” Stensrud said.  “From this we hope to learn what size a city needs to be to have an impact on a storm.”

The information will be valuable for city and regional planners, as well as agricultural producers in surrounding areas.

The team includes weather computer modelers, radar meteorologists, landscape architects, atmospheric chemists and geographers from NSSL, South Dakota State University, the University of Oklahoma, the University of Michigan, Columbia University and the University of Minnesota.

Share this: