Oklahoma lightning mapping array now expanded

The Oklahoma Lightning Mapping Array can map up to twelve thousand points per second, and so can reveal where a flash originates and how it develops in a storm. An example of a flash is shown in this figure. The top two panels show altitude as a function of time. The second of these is a more expanded view, from 20:00.6 – 20:02.2 UT (a period of 1 minute 36 seconds). Color coding indicates elapsed time, with purple being earliest and red being latest. The bottom left panel shows the view one would have from above the storm. The panel just above it shows the view from the south. The lower-right panel shows the view, rotated on its side, one would see from the west. The tics in these three panels are labeled in kilometers from the center of the lightning mapping array, so the east and north dimensions are each 120 km.

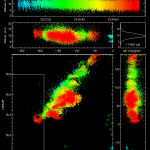
NSSL’s Field Observing Facilities Support (FOFS) team just finished installing seven new lightning mapping stations in the Oklahoma Lightning Mapping Array (OKLMA).  The new sites in southwest Oklahoma, in addition to 11 existing stations in central Oklahoma, are all now operational, just in time for the Deep Convective Clouds and Chemistry (DC3) project that began in May.

The OK-LMA provides three-dimensional mapping of lightning channel segments over west central Oklahoma and two-dimensional mapping of all lightning over most of Oklahoma. Up to thousands of points can be mapped for an individual lightning flash, to reveal its location and the development of its structure.

NSSL scientists hope to learn more about how storms produce intra-cloud and cloud-to-ground flashes and how each type is related to tornadoes and other severe weather.

The OKLMA data will complement DC3 atmospheric chemistry measurements to help estimate how much NOx, an ozone-precursor, is produced by lightning.  Real-time lightning observations also will be used by scientists to help keep research aircraft away from lightning hazards to on-board equipment and flight instruments.

Share this:

2012 Hazardous Weather Testbed Spring Experiments

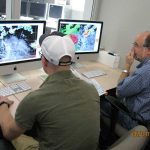
Starting today, researchers, modelers and forecasters from around the world will work together in a simulated operational forecasting environment to improve severe weather forecasts and warnings during the 2012 NOAA Hazardous Weather Testbed Spring Experiment.

Forecasters will be given a first-hand look at cutting edge forecasting strategies and applications to provide researchers and developers useful feedback before they are implemented in National Weather Service (NWS) forecast operations.

NSSL, the NOAA Storm Prediction Center, and NOAA National Weather Service Forecast Office in Norman, Okla. sponsor the project each year.  The experiment runs from May 7, 2012 through June 15, 2012 at the National Weather Center.

The NOAA Hazardous Weather Testbed (HWT) has two branches, the Experimental Forecast Program (EFP) and the Experimental Warning Program (EWP).  They each have independent but complementary goals during the five-week experiment.

The 2012 Spring Forecasting Experiment, conducted by the EFP, investigates our ability to generate skillful forecasts for thunderstorms and severe weather over the continental United States.  The focus this spring will be on accurately depicting the evolution of the environment before thunderstorms form, along with thunderstorm trends and transitions over time.  For severe weather, experimental outlook-type forecasts that include areas and probabilities of severe weather for shorter time periods than previously attempted.  In support of the Warn-on-Forecast effort, participants will address the extraction and display of relevant storm hazard information from model-generated thunderstorms. They will also develop guidance that provides uncertainty information about specific thunderstorm threats such as tornadoes, hail and wind.  Each day during the experiment, activities will include a combination of experimental forecasting, subjective evaluation, discussion, and documentation.

The EWP targets detecting and predicting severe weather hazards on a small scale: from a few minutes to a few hours and over areas the size of several counties down to the size of neighborhoods.  Participants in the 2012 EWP will test and evaluate applications geared toward NWS forecast office severe thunderstorm warning operations.  They will evaluate a real time hazardous weather analysis and detection system using data from the WSR-88D network and from model analyses and forecasts.   Multiple GOES-R applications, including lightning mapper products, and the performance and utility of an experimental forecast model will be assessed.

Also part of the EWP, the Phased Array Radar Innovative Sensing Experiment (PARISE) examines the use of adaptive, rapid-scan radar data for detection and prediction of severe weather hazards.  Participants in the 2012 PARISE will work several archived severe weather events and interact with facilitators to produce timelines of their decision processes and observed storm evolution. The timelines will be used to assess the importance of adaptive, rapid-scan data in warning decision making.

The Spring Experiment has been the cornerstone of the HWT for more than a decade, where forecasters are provided with a first-hand look at the latest research and concepts and products.  At the same time, research scientists gain valuable understanding of the challenges, needs and constraints of front-line forecasters. The end result meets another NWS goal to increase the development, application and transition of advanced science and technology to operations and services.

Share this:

Scientists launch study of thunderstorm impacts on upper atmosphere

More than 100 researchers from NOAA and 29 other organizations are collaborating on a field project this spring to discover how thunderstorms act like elevators, taking pollution and water-rich air from the surface and lofting it straight up into the upper troposphere.

The Deep Convective Clouds and Chemistry (DC3) experiment will explore the role of the displaced air in forming upper-atmosphere ozone, a greenhouse gas. Measurements made using three research aircraft, mobile radars, lightning mapping arrays, and other tools will help scientists understand more about the electrical and chemical structure of thunderstorms, including the concentration of ozone.

Ozone is created when sunlight triggers interactions between pollutants such as nitrogen oxides and other gases.  These interactions are well understood at the Earth’s surface, but they have not been measured at the top of the troposphere, where the effects of ozone are the strongest.

Pollution isn’t the only source of nitrogen oxides, however.

“We are pretty sure lightning is the largest natural source of nitric oxide,” said NOAA National Severe Storms Laboratory scientist Don MacGorman.  “It is important to know the naturally occurring contribution.”

While past field projects have focused on the thunderstorm details with only some chemistry information or on the chemistry with limited data on the storms, DC3 is the first to take a comprehensive look at the chemistry and thunderstorm details, including the air movement, cloud physics, and electrical activity.  Investigators expect the data to create the best picture yet of chemical transport, production and processing by thunderstorms.

The DC3 project runs from May 15 – June 30, and is funded by the National Science Foundation, National Oceanic and Atmospheric Administration and NASA.

DC3 investigators will collect data in northern Alabama, northeastern Colorado, and central Oklahoma. All three sites have existing weather instrumentation on the ground, including dual-Doppler research radars and lightning mapping arrays enabling the scientists to study different types of atmospheric environments and storm types.
Teams from the NOAA National Severe Storms Laboratory and The University of Oklahoma will launch balloon-borne instruments to make measurements of the storms and of the storm environment. These measurements will be combined with observations from aircraft and with information about the location, size, and frequency of lightning from lightning mapping arrays. Such measurements, MacGorman said, will improve understanding of how storms produce lightning and help with the use of lightning mapping data to improve storm forecasts and warnings.

NSSL and OU will also operate mobile Doppler radars to help researchers observe the internal airflow patterns of storms, which are important for determining how much air is transported up through the storm. Radars with dual polarization technology will provide additional information on particle shapes, for example where large raindrops occur.

NOAA Earth System Research Laboratory’s (ESRL) Owen Cooper and Jerome Brioude will use weather forecasting models to understand where the air lofted into the troposphere by a thunderstorm travels. A day later, one of the research airplanes will target that region, so the scientists can look at how the air mass composition changed: how much ozone formed, for example, and whether chemical reactions created particulate matter , too.

“Usually, things just simmer along slowly in the upper troposphere,” said ESRL’s Tom Ryerson. “These storms have the potential to crank up reaction rates to more of a boil.”

Three research aircraft will be based at Salina (Kan.) Municipal Airport, a location more central to the study areas. Each day, they will fly to the area with the most promising forecast for thunderstorms suitable for study.

The NSF/NCAR Gulfstream V research aircraft will do the bulk of the high-altitude measurements. Simultaneously, a NASA DC-8 will fly as low as 1,000 feet above the ground, measuring air flowing into the clouds at their base as well as the chemistry of surrounding air. The third research aircraft, a Dassault Falcon 20E operated by DLR, the German space agency, will join DC3 for three weeks and fly especially close to storm cores at high altitudes.

The scientists leading the project are from the National Centers for Atmospheric Research, the Pennsylvania State University, Colorado State University and NOAA.

MORE INFORMATION:
DC3: https://www2.acd.ucar.edu/dc3
NOAA National Severe Storms Laboratory: http://www.nssl.noaa.gov
NOAA Earth Systems Research Laboratory: http://www.esrl.noaa.gov

Share this: