

I ran my code over the entire 2011 HWT data set to compare the two outbreaks from 27 April and 24 May amidst all the other days. These outbreaks were not that similar … or were they?
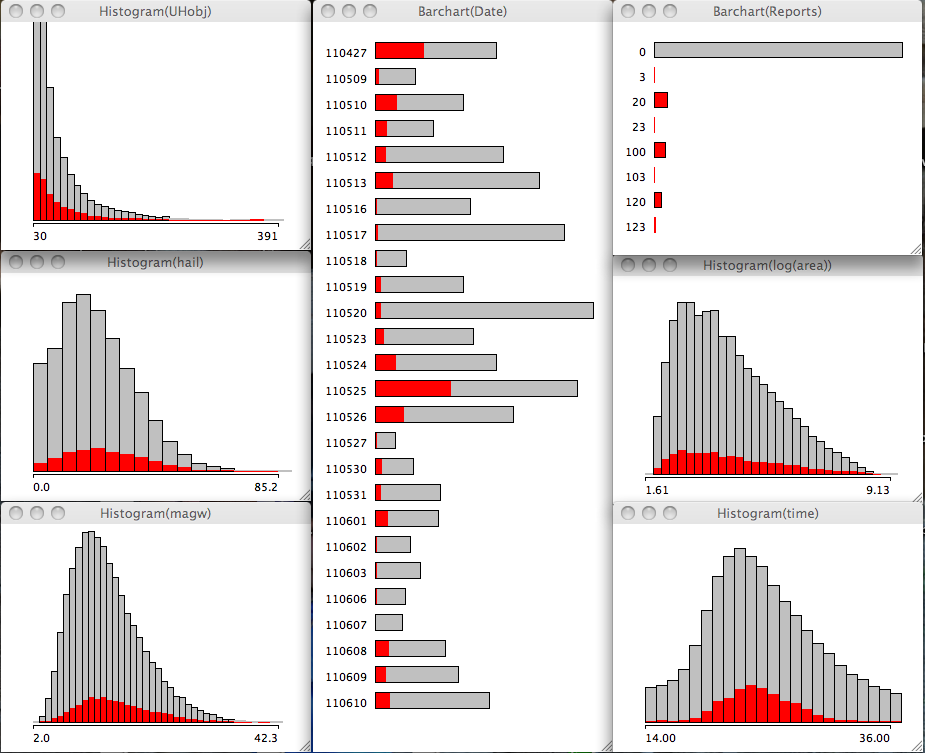
In the first example, I am comparing the model storms that verified via storm reports with 40% for 27 April and only 17% for 24 May but 37% for 25 May. 25 May also had a lot of storm reports including a large number of tornado reports. Note the distribution of UHobj (upper left) is skewed toward lower values. The natural log of the pixel count per object (middle right) is also skewed toward lower values.
[If I further dice up the data set, requiring UHobj exceed 60, then 27 April has ~12%, 24 May has 7.8%, 25 May has 4% of the respective storms on those days (not shown). ]

In the second example, if I only select the UHobj greater than 60, the storm percentages for 27 Apr are 25%, 24 May are 35%, and 25 May are 8%. The natural log of the pixel count per object (middle right) is also skewed toward higher values. Hail and Wind parameters (middle left and bottom left, respectively) shift to higher values as well.
Very interesting interplay exists here since 24 May did not subjectively verify well (too late, not very many supercells). 27 Apr verified well, but had a different convective mode of sorts (linear with embedded supercells). 25 May I honestly cannot recall other than the large number of reports that day.
Comments welcome.