Short answer: apparently not! Longer answer follows.
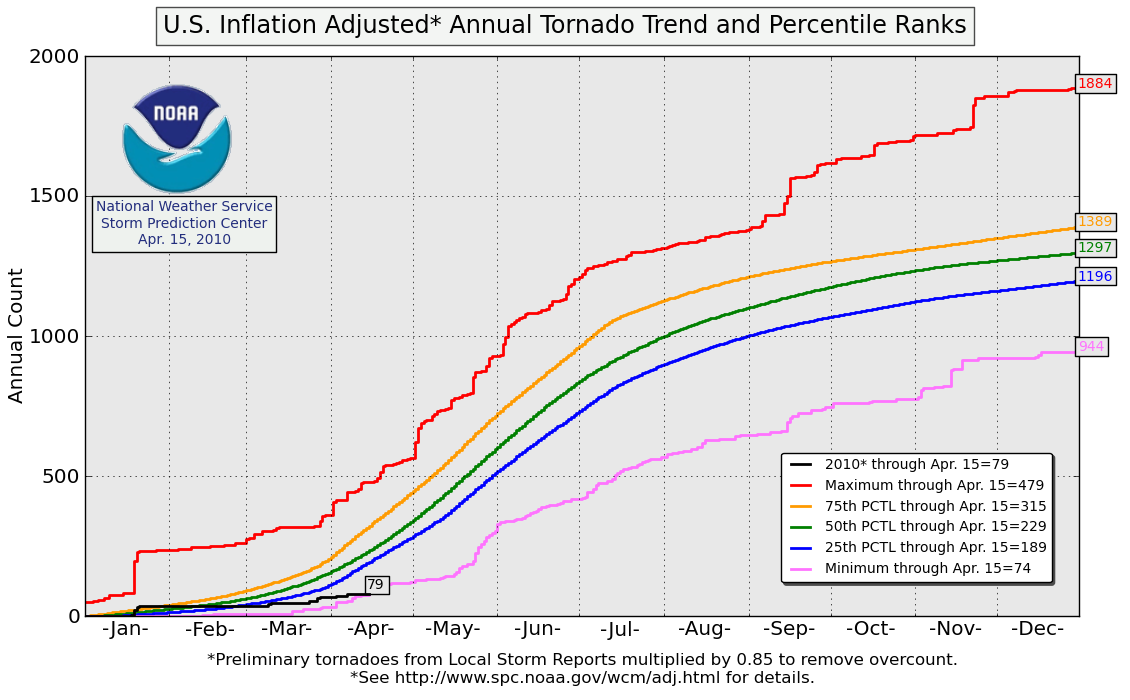
Few tornadoes have occurred to date in 2010, especially when compared to very active recent years such as 2008. The adjusted annual tornado trend shown below indicates that 2010, with 79 tornadoes (adjusted) through April 15, is rapidly approaching the minimum number of tornadoes expected through this time of year (about 75). While 2010 has not quite reached that adjusted minimum threshold yet, it looks like it may be only a matter of another day or two with few or no tornadoes.
Does the scarcity of tornadoes so far in 2010 say anything about what we can expect for tornado activity in May? Let’s review the past 30 years of tornado counts and see. Below is a chart depicting the departure from the decade’s average number of tornadoes for two periods in each year (1980-2009). The first period is the departure from the decade’s average number of tornadoes, January through April (gold). The second period is the departure from the decade’s average number of May tornadoes (light blue). In the early years of this chart (1980 through 1983), this chart would suggest that, yes, we can say that an above (below) average start to the year through April is indicative of a above (below) normal May. However, that forecast methodology falls apart in 1984, 1985, and 1986 when, in each of those years, an above normal January-April period was followed by a below normal May. In 1987 and 1988, there is a strong correspondence between a low number of tornadoes through April, and a slow (below normal) May. Then in 1989, an inverse relationship occurs when a below normal start to the year is followed by an above normal May.
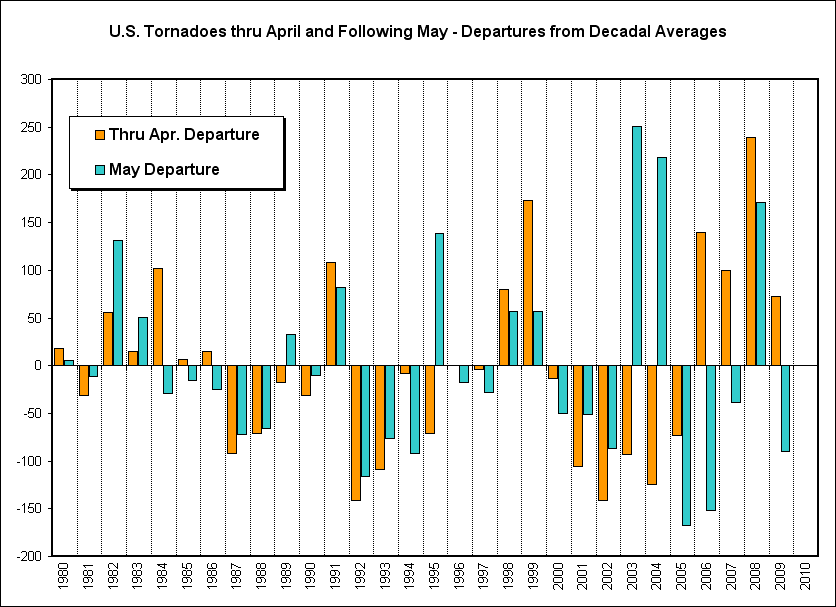
With the exception 1995, there is a remarkable 13 year stretch from 1990 to 2002 when the start of the year could possibly be used as an indicator of the May to come. During this period there were nine years when normal to below normal tornado numbers in the January through April period were followed by normal to below normal tornado activity in May. There were only three years during this period (1991, 1998, and 1999) when an above normal start to the year continued into May. If you were looking at only those years you might conclude that in 2010 we will see below normal tornado activity into May.
Trouble starts again in 2003 and 2004 when low tornado counts through the early months of the year are followed by remarkably active Mays. In fact, May 2003 and May 2004 are the most anomalously active Mays of the 30-year period and both were preceded by some of the most anomalously inactive January through April periods! Some semblance of correspondence returns in 2005 (both periods below normal) before a reversal shows up in 2006 and 2007 with above normal January through April periods being followed by below normal Mays. One is entitled to be quite flummoxed by this point in the analysis but the conclusion should be that, at least in the most recent years, making a prediction about tornado activity in May, based on the character of the season to date through April, would be a tricky bet.
Last year saw an active start through April only to be followed by a somewhat quiescent May. That situation was addressed in this blog post.
Despite the fact that the correlation coefficient (r) for this entire time series is an abysmal 0.15, there is still hope (albeit diminishing) that we can say something about the predictability of the future based on what has happened in the past. So, one last chart for all of those folks hoping to capture a tornado during the upcoming VORTEX2 field program…

The correlation coefficient on this time series for tornadoes only occurring in Texas, Oklahoma, Kansas and Nebraska is barely improved over the previous comparison for the entire United States. It’s quite possible that charts used to evaluate the stock market would exhibit a similar lack of correlation. And, perhaps it’s fitting to think of this little experiment in the same light by using an oft-quoted line from a typical mutual fund prospectus: “Past performance is no guarantee of future results.”
Stay tuned. We’ll know the answer soon enough.

")
