One of the interesting questions that comes up every year is how to compare a tornado season with previous seasons. In 2009, that question has come up particularly in light of the quiet conditions lately. One way to do this is to start by adjusting historical reports for the long-term “inflation” in reports. If we assume that the “shape” of the annual progression of tornadoes for each year is true and that only the total number would be adjusted, inflation-adjusted annual cycles can be constructed for each year.
In order to compare any particular year to the average year, we can see how far ahead or behind that year is to the average for each day of the year. In other words, if there are 500 tornadoes at the end of May, that would be about 100 behind the long-term average of about 600. If there are 700, it would be about 100 ahead of the average year. A time series of this departure through the year gives an idea of how far ahead or behind the season is throughout the year.
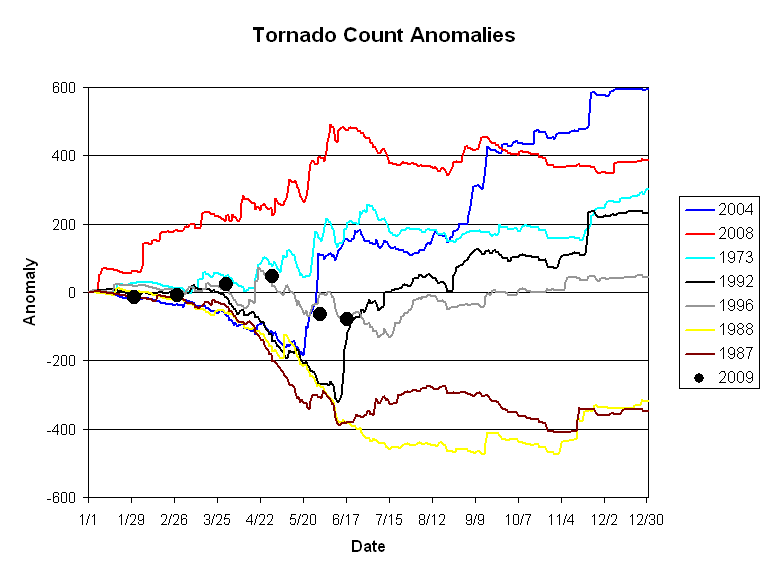
On this graphic, positive departures indicate above average and negative departures are below average. If the line is horizontal, that period of the year is exactly average. The years shown include the biggest years in the tornado record (2004, 2008) and the smallest years (1987, 1988), as well as 1973 and 1992, which demonstrate different ways that a big year can happen. In 1973, there aren’t any really large periods for tornadoes, but a steady increase ahead of normal throughout the year. In 1992, the early part of the year looks a lot like the really slow years of 1987 and 1988, reaching more than 300 below normal by 14 June. After that, a short period of frequent tornado occurrence got the season back to normal within a month and then ending up more than 200 ahead by the end of the year.
The black dots represent 2009 at the end of each month and mid-June. Reports after March 2009 have been adjusted as discussed here. The gray line is for 1996, the closest analogue to 2009, where the season was ahead of normal through early May, then fell almost 100 below normal by the middle of June before finishing about 50 ahead.
In reality, despite the slow period that coincided with the VORTEX2 field project when, for a 5-week period, there were over 100 tornadoes fewer than normal, the 2009 season has stayed within 100 of the normal throughout the year. Normally, by 22 June, more than 60% of the median 1290 tornadoes per year have occurred. We’ll have to wait to see how 2009 turns out.

")

