This year, the Spring Forecasting Experiment is focusing on the Day 1 time period more than ever before, eschewing the long lead-time forecasts that we have made in previous years in favor of honing in on timing information and allowing participants to delve into the data. Since more data than ever before is available within the drawing tool where participants draw their forecasts, we’re excited to see how participants probe the new data within the various ensemble subsets.
One short-term experimental forecast product being generated on the Innovation Desk this year are Potential Severe Timing (PST) areas, which indicate which 4-hr period severe weather will occur in over the general area of 15% probability of severe. By identifying the timing of the severe event and displaying all of the timing contours on one graphic, the end product is hoped to be valuable for emergency managers and broadcasters for their advance planning. Small groups of participants generate these forecasts around subsets of the CLUE and HREFv2 ensembles, meaning that on any given day we’ll ideally have 5 separate sets of PSTs. After the participants separate into their small groups and issue their forecasts, we ask them to come back together and brief one another on what their particular ensemble subset was doing. This way, each group of participants can delve into the data from their subset more deeply than if the activity were to take place as one large group. This briefing period also allows the participants to be exposed to different lines of reasoning in issuing their forecasts, and has thus far sparked several good discussions.
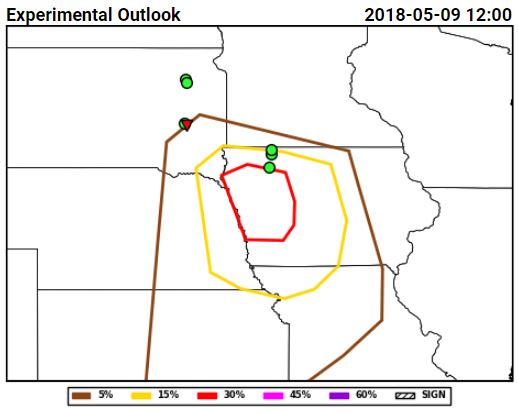
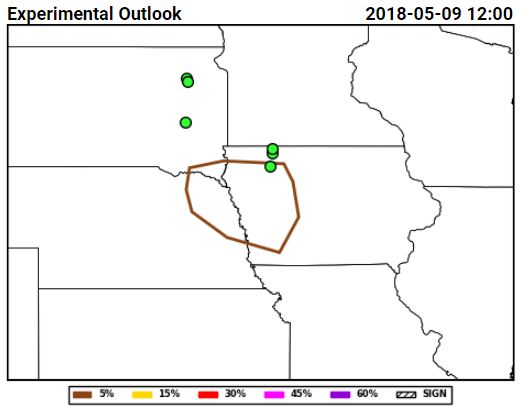
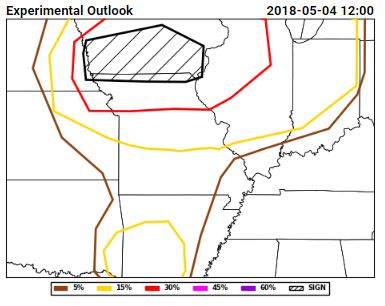
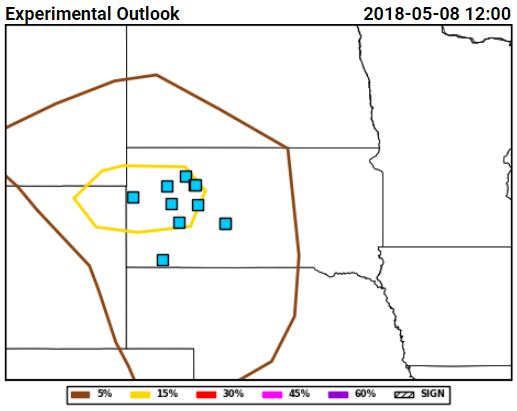
Here are the PSTs from 3 May 2017, or Thursday of last week: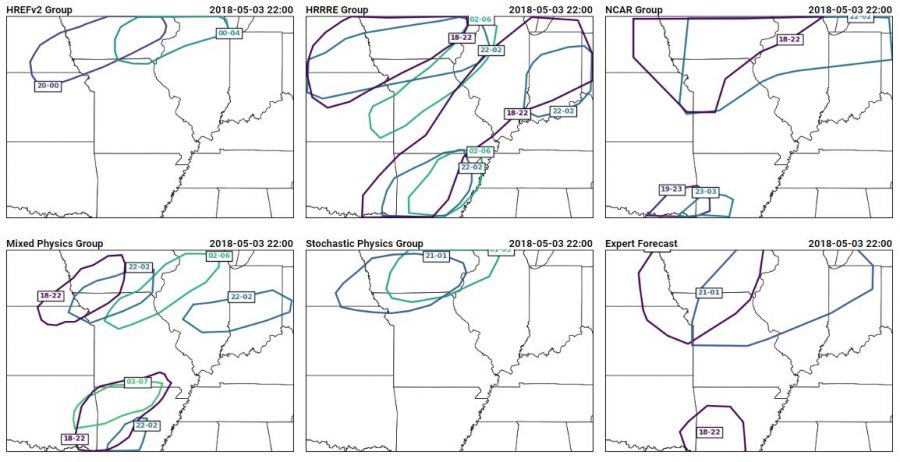 The different ensemble subset groups compose the top row and the left and middle section of the bottom row, while the bottom right hand panel shows the forecast from the expert forecaster facilitator on the Innovation Desk. Several different strategies are evident within the panels, including some groups that chose not to indicate timing areas for all of the 15% area of our full-period outlook (shown below).
 The reasoning from the groups for their different areas gave insight into the model performance as well as the different forecasting strategies employed by the different groups of people. The group using the HREFv2 decided not to use the NMMB member when generating their forecasts, because the depiction of morning convection was so poor. The HRRRE group had very large areas, which they attribute to the large spread within the HRRRE. The NCAR group decided to discount the guidance in the north of the domain, because of erroneous convection in the northern domain. Instead, they felt more confident in the southern areas where the ensemble was producing supercells. Their group thought that the thermodynamics of the northern area was less conducive to supercellular convection. The group using the mixed physics ensemble from CAPS placed their first area based on where they thought convective initiation would occur, indicating that they thought convection would quickly become severe. Their southern PST was very late to cover any severe threat overnight, but they considered that it might be more of a flood threat (which we do not forecast for in the Spring Forecasting Experiment). The stochastic physics group (another ensemble run by CAPS), on the other hand, had an ensemble which showed almost no signal in the southern area of interest. It also showed a later signal than the other ensembles, contributing to the spread in the time of the first PST.
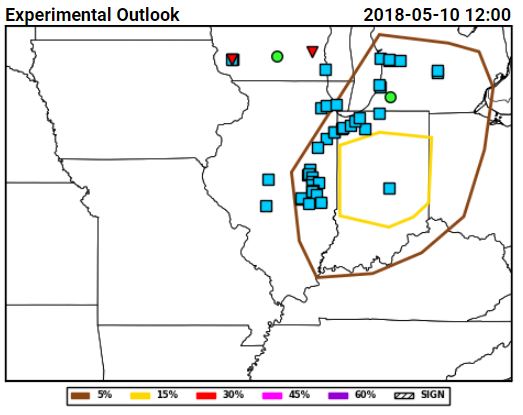
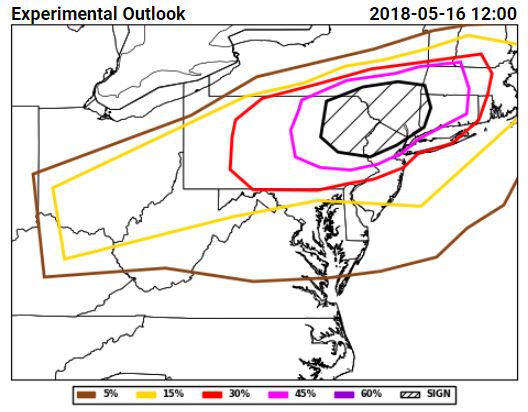
All of these details came out during the discussion of the PSTs, after participants dove into the data from their subensemble. How did the PSTs do? Here’s a snapshot of the PSTs with reports from 18-22 UTC overlaid: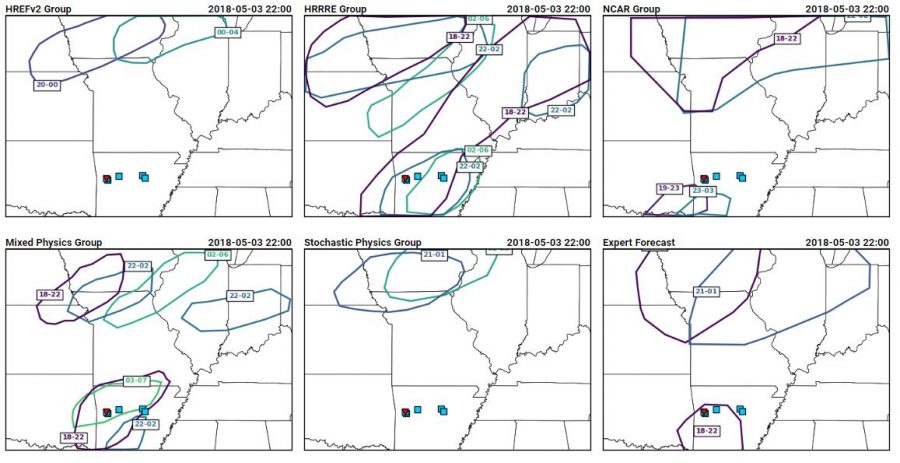 Ideally, all of the reports would fall into the 18-22 UTC contours, which mostly occurred for the expert forecaster and did occur for the HRRRE and Mixed Physics group, although both groups had large areas of false alarm. Here’s a similar image, but showing reports from 22-02 UTC:
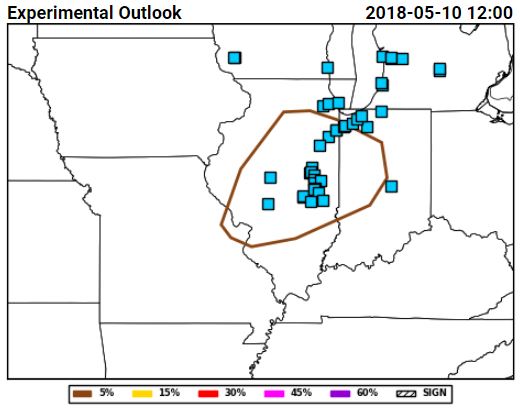
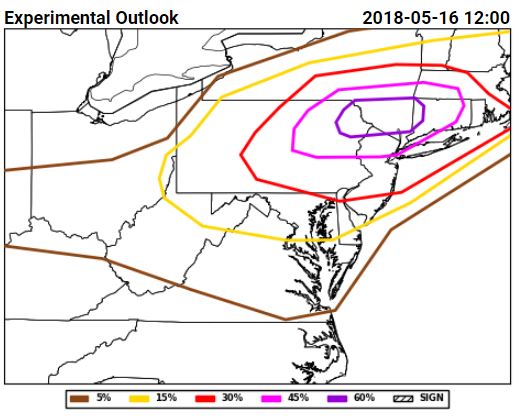
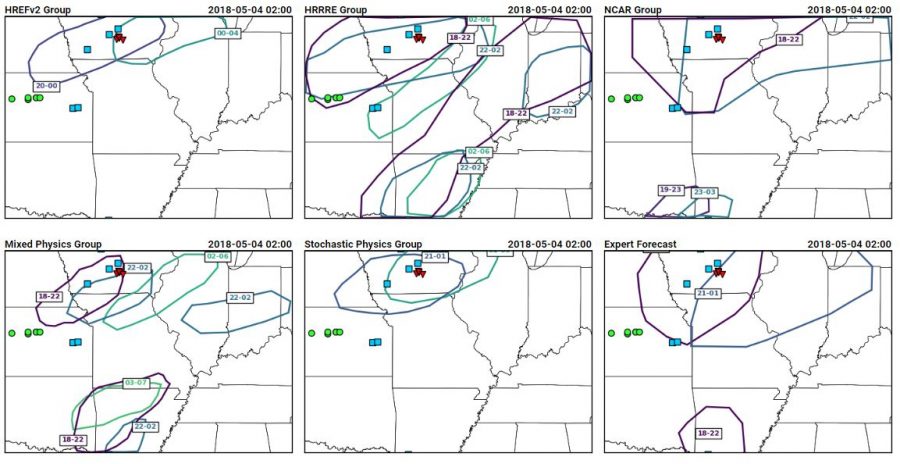 At this point in time, all groups missed the activity in Kansas, although some groups captured most of the reports within a 22-02 UTC window.
The day after the forecasts, participants are able to go through and give ratings based on the reports that have come in, and choose the group’s forecast that they thought performed the best. Who performed the best for this case? 3 votes for HREFv2, 2 votes each for the HRRRE and the CAPS Stochastic Physics ensemble, and one vote each for the CAPS Mixed Physics and the NCAR ensemble group. Clearly, the complexity of this case provided plenty of nuances to evaluate, and I would bet that more complex cases such as this are on the way….after all, we’ve only just begun Week 2 of the 2018 SFE!


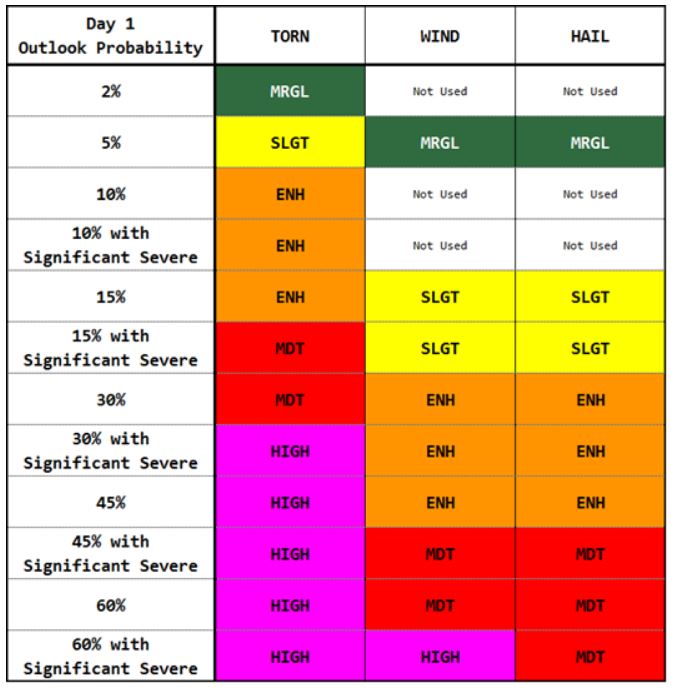
 Tuesday for total severe from the Innovation Desk (left) and for hail from the Severe Hazards Desk (right):