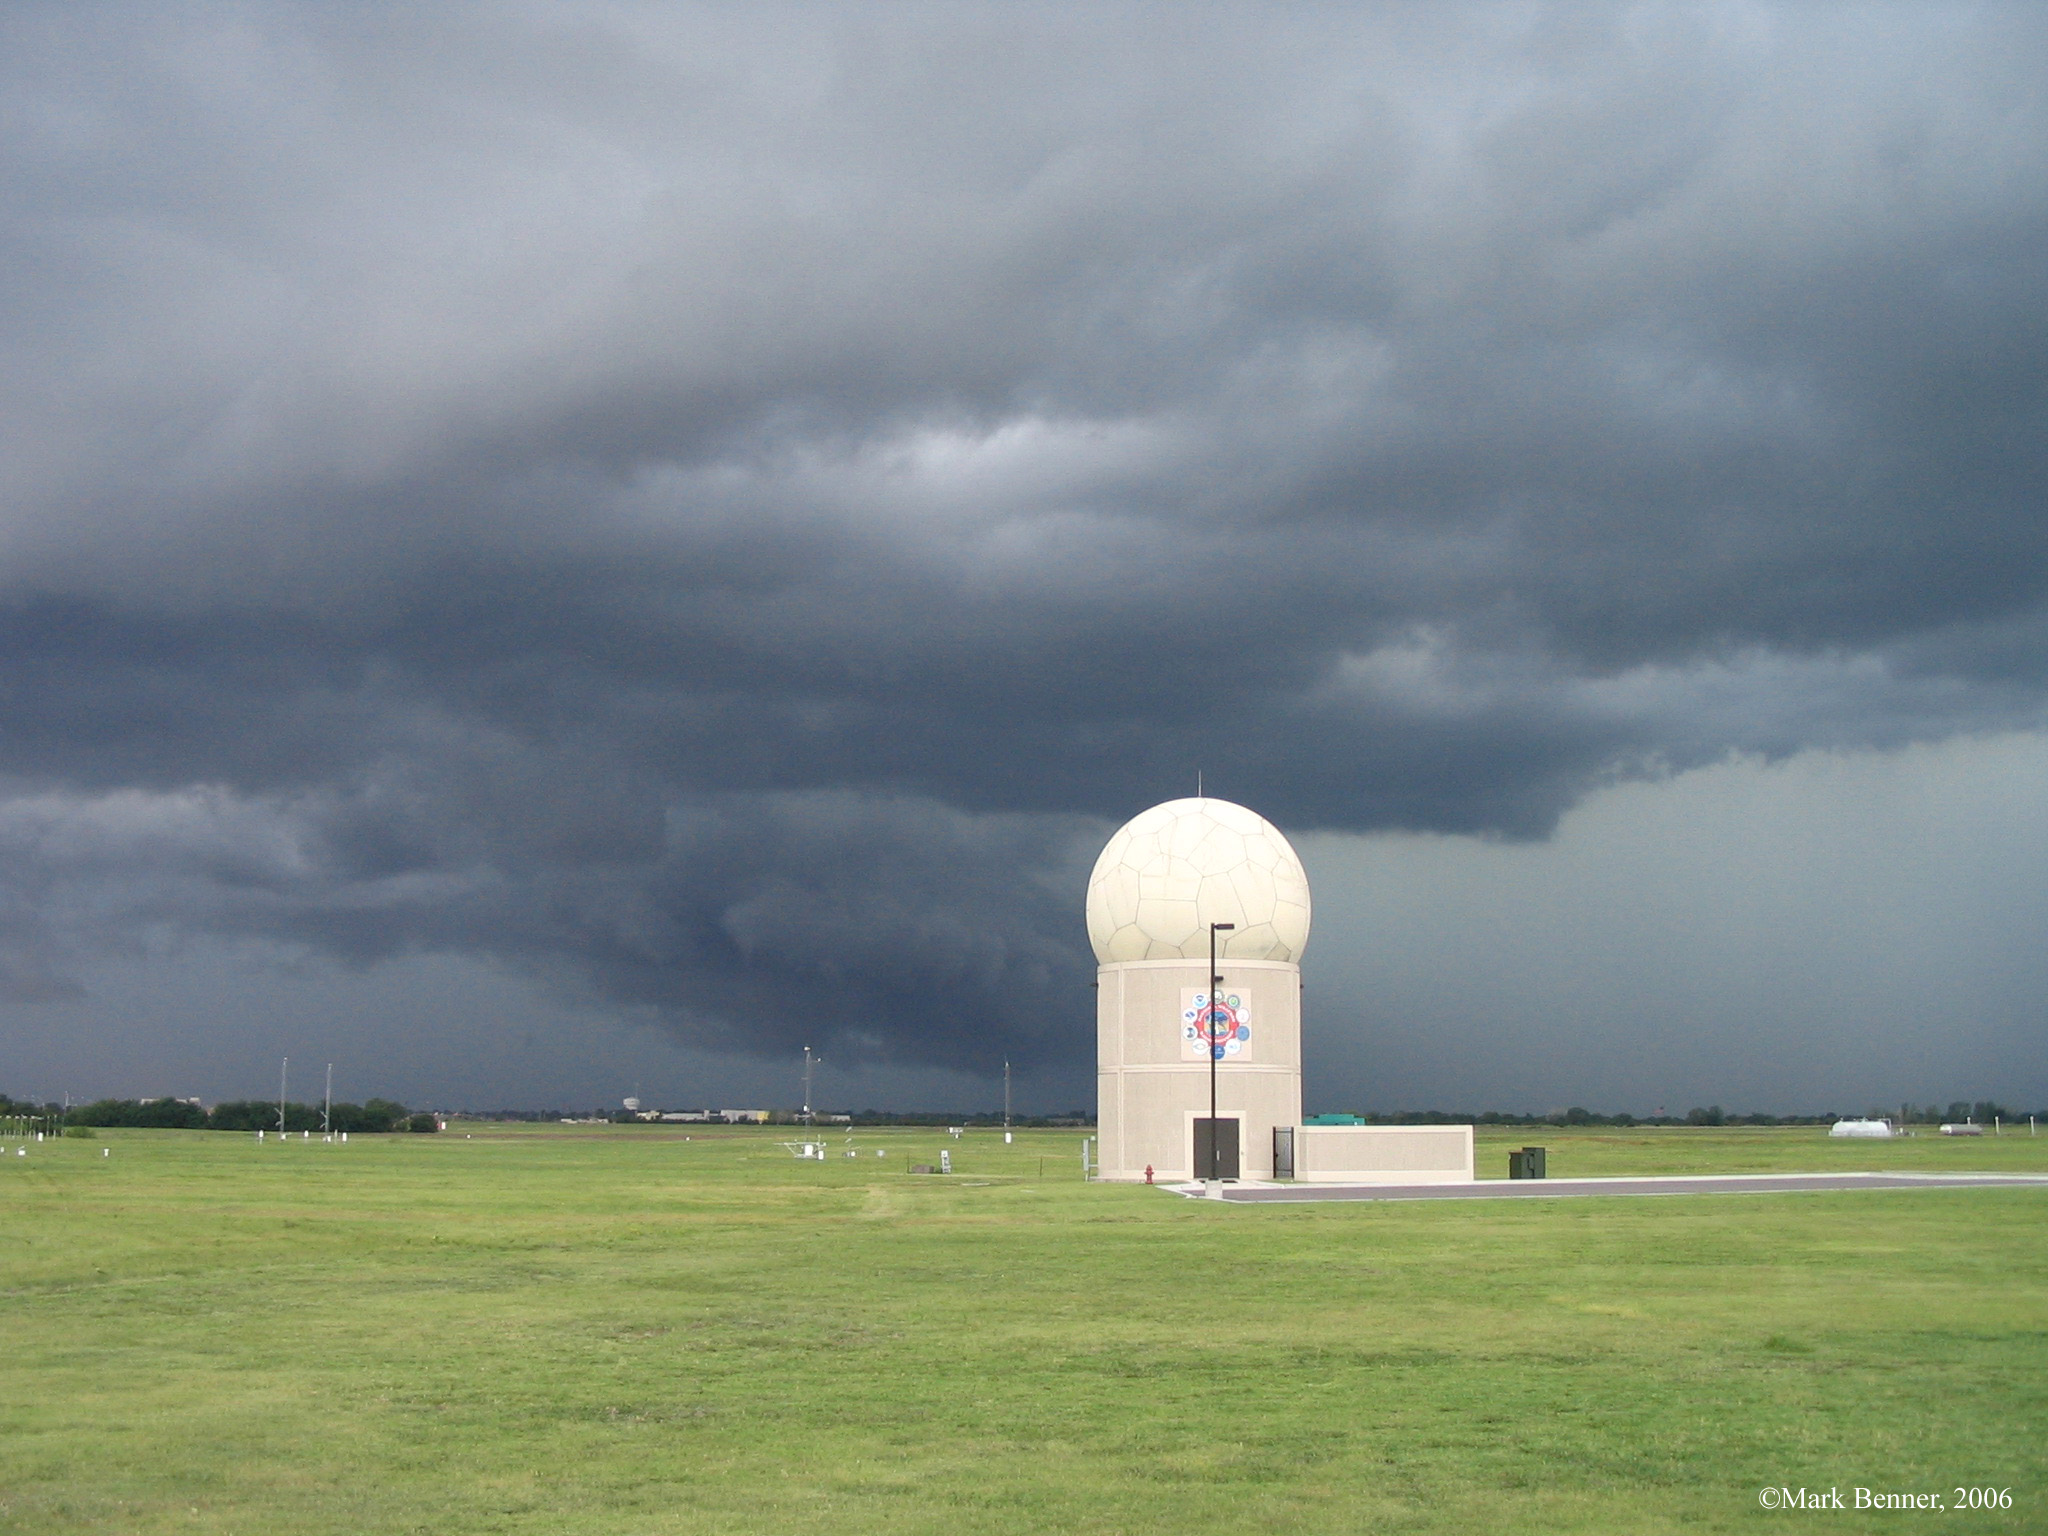
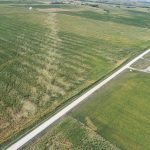
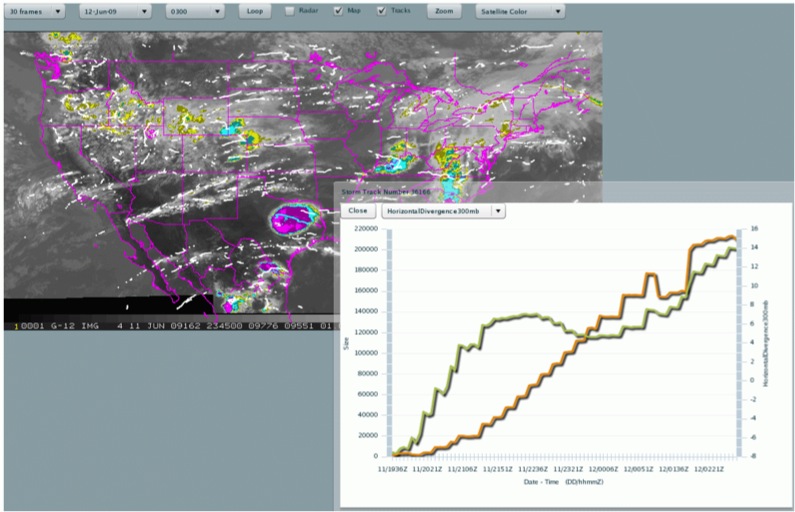
Downbursts—an area of strong winds in a thunderstorm—can damage trees and buildings, disrupt air travel, and cause loss of life. Decades of work by scientists has revealed a lot of information about downbursts including certain features seen on radar, known as precursor signatures, that can help forecasters anticipate when a downburst might develop. However, downbursts are still quite challenging to predict—especially in low-shear, summer-time thunderstorms—perhaps because the downbursts and their precursor signatures can develop quickly and be difficult to observe.
Therefore, researchers at the University of Oklahoma Cooperative Institute for Mesoscale Meteorological Studies with the NOAA National Severe Storms Laboratory decided to look into it further. They studied a dual-pol radar feature, known as a specific differential phase (KDP) core, because it could provide information about important processes that cause a downdraft to develop and get stronger. Our research shows KDP cores could be a reliable and easily observable downburst precursor signature that can help NOAA National Weather Service forecasters predict where a downburst could develop next.
Our research began one afternoon in the halls of the National Weather Center in Norman, Oklahoma, when Randy Bowers, a forecaster at the NOAA National Weather Service Norman Forecast Office (OUN) and I (Charles Kuster, a research scientist with the CIMMS working at NSSL), were having an informal discussion about a completely unrelated topic. At the end of our conversation, Randy mentioned seeing a consistent area of high KDP—the KDP core— while issuing severe thunderstorm warnings and wondered if we could do some research on it together. I had been looking for opportunities to work more with forecasters, so this topic sounded like an amazing opportunity. We jumped in and began identifying potential cases, collecting data with a research radar in Norman, and brainstorming how to best study KDP cores.
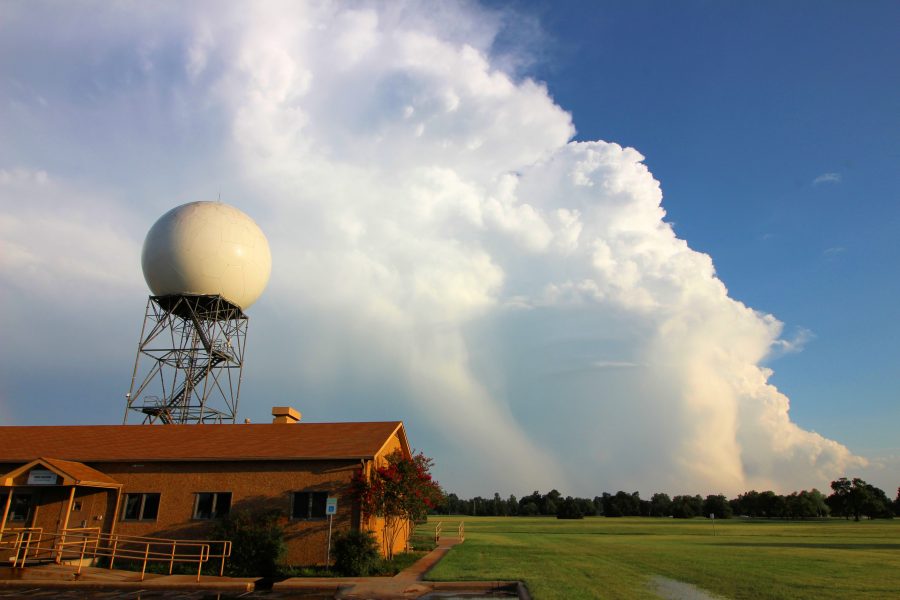
Ultimately, we selected 81 downbursts in 10 different states to analyze. I got to work on comparing the size, magnitude, and vertical changes in the KDP cores associated with strong and weak downbursts, while Randy examined atmospheric conditions and possible warning applications. We also began working with Jacob Carlin, a CIMMS research scientist also working at NSSL, who explored model simulations of downdrafts and important microphysical processes—such as melting and evaporation—that can result in a stronger downburst. Another research scientist, Terry Schuur (OU CIMMS/NSSL), also brought microphysics expertise and experience to the team while researchers Jeff Brogden (OU CIMMS/NSSL) and Robert Toomey (OU CIMMS/NSSL) provided extensive support and expertise in radar data analysis software. Andy Dean, a forecaster with the NOAA/NWS Storm Prediction Center, provided data about atmospheric conditions around the downbursts.
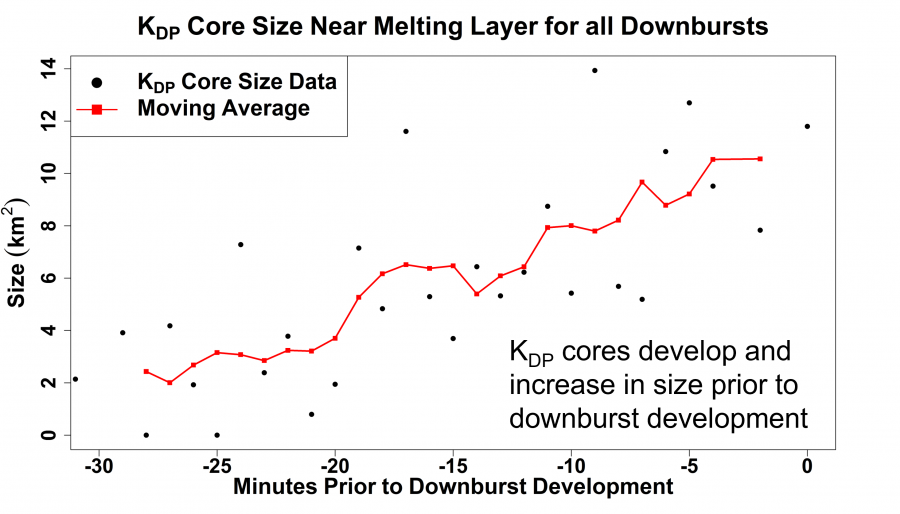
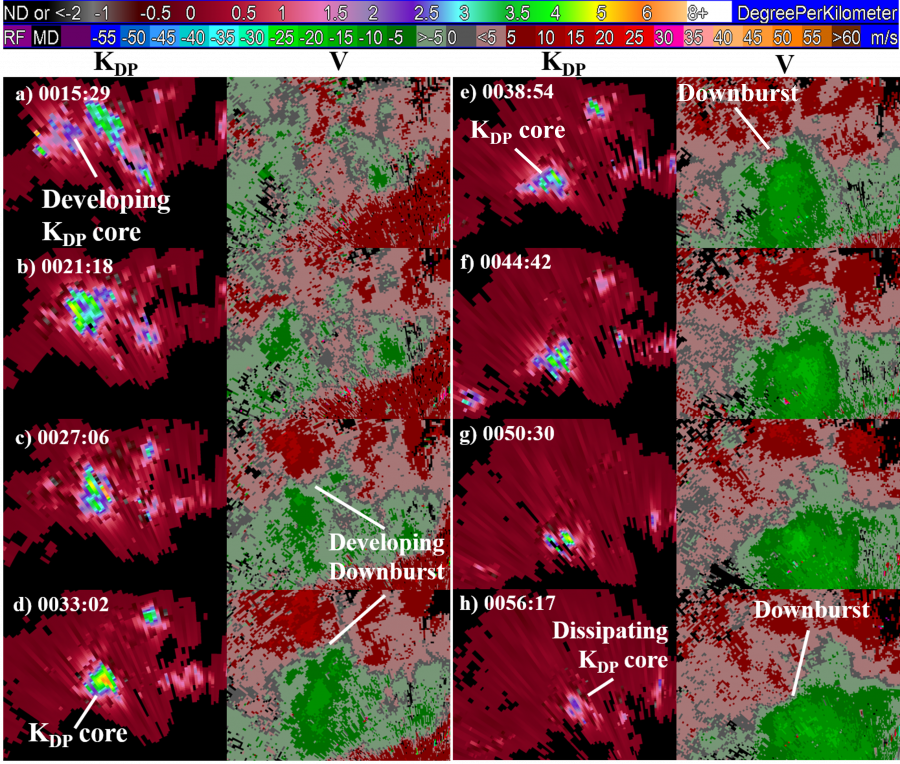
Together, we determined KDP cores were a reliable downburst precursor signature in the events we studied. All 81 downbursts were preceded by a KDP core by as much as 30 minutes. The KDP core also reached its maximum intensity, typically about 10–15 minutes before the downburst reached its maximum intensity. In addition, there were very few instances where a KDP core was observed and no downburst occurred (i.e., very few null events).
Anticipating downburst intensity using KDP cores was more challenging because there was overlap between the characteristics of KDP cores associated with strong and weak downbursts, but in general, a stronger KDP core was more likely to be associated with a stronger downburst.
We also found the atmospheric conditions during each event were very important. When atmospheric conditions were less favorable for downburst development, we observed stronger KDP cores, which likely means more melting, precipitation loading, and evaporation are needed for a downburst to develop in such conditions. Ultimately, our work showed KDP cores provide a good signal that a downburst is likely to develop soon, assuming atmospheric conditions are favorable for downburst development, and can help forecasters triage storms to determine which one has the highest chance of producing a downburst.
We would like to thank everyone who has made this research possible so far and those who continue to help push it forward. Everyone from the CIMMS and NSSL administrative staff, NSSL IT, radar engineers, NOAA National Weather Service Norman Forecast Office, and webinar organizers are very much appreciated. For any questions, please contact nssl.outreach@noaa.gov or see https://doi.org/10.1175/WAF-D-21-0005.1 for more detailed information.
