What else have we learned?  A deeper dive into emergency managers’ thoughts about Probabilistic Hazard Information (PHI)

Each emergency manager (EM) that has participated in our experiment has come with a unique lens through which they viewed and evaluated the experimental PHI.  Consequently, multiple themes and sub-themes emerged when discussing EMs’ preferences for and thoughts about PHI during focus groups.  For this analysis, the Friday (end-of-week) EM-only focus group discussions from the 2018 Spring Experiment (2 weeks), 2019 Spring Experiment (2 weeks), and 2019 Hazard Services PHI Experiment (2 weeks) were qualitatively coded for themes regarding probabilistic hazard information.  These discussions included 23 EM perspectives from various jurisdictions and geographic locations.   

Some of the major themes that have emerged are: using PHI and benefits of it, the training that will be required, concerns about putting PHI into operations, how to disseminate PHI, and how the public may use PHI.  Each of these themes will be discussed in greater detail. 


Using PHI and the Benefits

First, EMs had several thoughts about using PHI, including how they would use it and when, the benefits of using it, and their preference for looking at probabilistic information.  EMs used PHI in a variety of ways including to maintain overall situational awareness and to monitor storm histories and tracks.  Some EMs enjoyed the lightning PHI product because “we just don’t really have anything like that available right now,” while others thought PHI objects were most helpful for tornadoes. Many EMs thought PHI would not be helpful for “garden variety thunderstorms” but some did think PHI could be helpful for a general thunderstorm because, where they live, surprise thunderstorms can “pop up.”  They even noted PHI could have worthwhile applications for winter weather and flood events.  

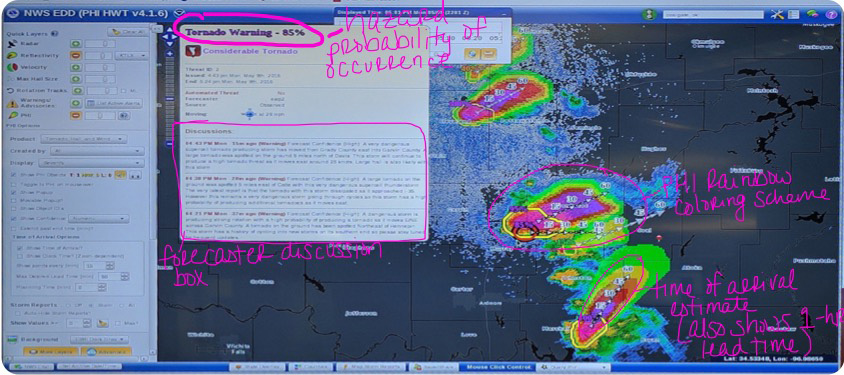
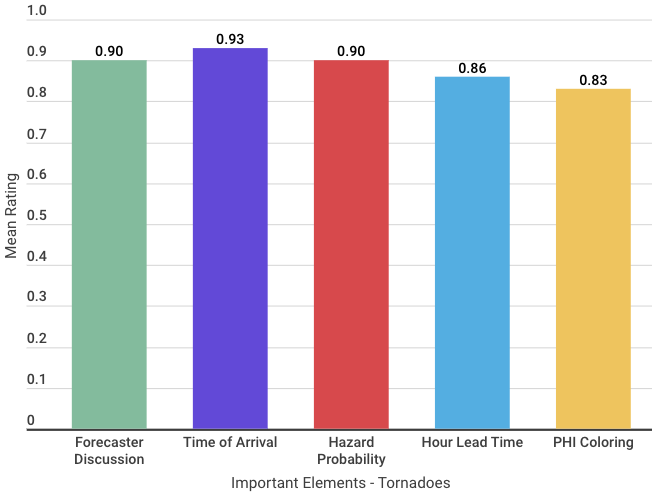
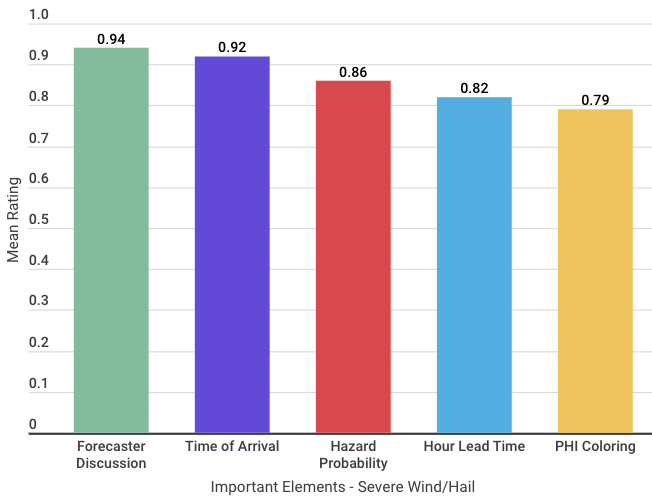
Second, EMs noted many benefits of having PHI as another “tool in their toolbox.”  One of the primary benefits of PHI, as noted by EMs, was that it gives them much more information than they currently receive and allows them to anticipate and plan ahead.  For example, “you’re talking about…being able to cancel or not cancel something that, if you didn’t have the tool, you would cancel…and you really didn’t have to; you didn’t know there was no need to [cancel].”  Many EMs noted the benefit of PHI for event planning; PHI gave EMs a heads up on storm timing, anticipated location, and potential impacts and allowed them to plan and make decisions about events and resource planning sooner than normal.  Many EMs noted that timing is everything for them and they really liked PHI for the timing information (e.g., time of arrival) it provided that is currently hard to find.

Another often-cited benefit of PHI was the specified location information. One EM described its importance as, “having the PHI with the…more narrowed down location and then the timing on top of it is just important…this clinic might get skipped over, this clinic needs to actually relocate because of a possible tornado…when you talk about moving patients, staff, and visitors and everything that goes into that, or choosing to shelter in place because the risk is too high to actually move, that makes a difference.”  Other EMs also noted that the location information offered by PHI helped specifically with deciding whether to cancel/postpone outside events or simply move them inside.

As a whole, EMs enjoyed the flexibility of the PHI for each hazard and being able to customize options in the EDD and hone in on the aspects that they were most interested in, which tended to vary based on jurisdiction.  EMs felt more confident in their decisions, indicated they were able to make decisions sooner and more accurately, and felt as though the PHI offered a greater volume of information that they could filter down to what they needed.  They enjoyed receiving the probabilities, even if they did not want the public to see these numbers (which will be discussed in greater detail below).  One EM noted that the probabilities “emphasize the area of risk a little more than generalized warnings, so you can get a sense of what the meteorologist is thinking.” Another EM noted they like the probabilities more than words because “words are subjective.”  Another EM explained that they liked the probabilities, but they still wanted the explanation to go along with it so they could make their own independent judgment.  A few EMs agreed with this notion and indicated that they would like a “hybrid” warning, which was described as a combination of the warnings typically issued today coupled with probabilities of occurrence.  As one EM put it, “I do think that [I want] traditional warnings to keep that concrete evidence…yes, this is capable of producing a tornado. Take action now. But then back that up with something like the PHI product.”


PHI Training

EMs discussed what types of training would be needed and how to go about implementing mass-training on PHI.  Collectively, they expressed the imperative need for formalized, immersive training.  Participants noted the importance of exploring the tool and all of its capabilities in their home jurisdictions to get a better, fuller sense of what it could do and how it could be fully leveraged; something that the artificiality of a simulated experiment cannot provide.  They also acknowledged that the one-day training during the experiment was not enough; as one EM noted, it was nice to get a “little bit of time before each [experiment] day [to] get your feet wet…but that doesn’t make you proficient.”  Participants did not offer an estimate of the amount of training time they would need to feel “proficient” in using PHI, but several emphasized that refresher training would need to be available as well because “if you don’t use it all day, you will absolutely forget how to use it!” There were suggestions to host training through the OK-First program, some sort of an online platform, or even regional workshops at NWS Weather Forecast Offices (WFOs). Regardless of format, EMs were clear that training needs to encompass both how to use the system (EDD, or whatever platform PHI is hosted on) and how to interpret the PHI probabilities and trends.


Concerns with Moving PHI into Operations

EMs expressed several concerns with PHI moving into operations that were centered around potential misunderstandings, misperceptions, or different interpretations of what the probabilities mean between all groups involved—forecasters, other EMs, and the public and partners.  First, EMs were concerned with different interpretations of forecasters’ intentions with probabilities.  They would frequently ask, “how do you know what it means to the forecaster?” and “ what does it mean when the probabilities fluctuate?”  A similar concern was where to “draw the line” in the probabilities for warnings and “action vs. no action.”  These questions led to heavy reliance on the forecaster discussion box, which allowed the forecaster issuing PHI to communicate their thoughts on the storm, a feature that many EMs loved because it provided additional context they were looking for.   

A second concern that was voiced concerned different decision thresholds across EMs in response to similar PHI.  As an example, many EMs noted what “50%” means to one person may not mean the same thing to the next person, which may lead to differential decisions.  As one EM stated, “I didn’t make the decision (sound the sirens) even though it was at 50% and then the next time I did make the decision based on 50%. So how do you figure that out?”  

Another concern voiced was whether PHI would confuse the public and partners.  Many EMs were concerned that it would be too much; EMs indicated that they wanted it for themselves but worried that the public would not understand it.  One aspect EMs specifically pointed out as worrisome for the public was the 2-minute update period; EMs thought that rapid update time might be confusing for some people as they may not fully understand the trending or fluctuating probabilities.  EMs were also worried that, as a product of not fully understanding the information, people may take less action in response to it. As one EM said, “we have to consider how the public would receive this,” while another EM said, “we may overestimate the public’s ability to take action with a lot of information,” a third EM said, “I think you could easily overwhelm and confuse them.”  Ultimately, more work with the public is needed to better understand their capacity to understand PHI and use it effectively for informed decision-making.

Lastly, EMs were concerned about shifting from a binary warning system to a warning system built on a probabilistic continuum.  Many EMs noted they liked the current binary system for its ease of understanding: either you are in a warning or you are not.  However, shifting to probabilistic forecasts provides people with a “continuum to determine their own risk level and whether or not they should take action. So we may lose a lot of people taking action.”  Thus, this EM recommended that while there may be a continuum of risk, the product for the public “needs to be more definite.”  Similarly, another EM noted that the binary system creates “two levels of decisions” whereas with probabilities, “you’ve got ten.”  

All in all, there have been many concerns that center on consistency of interpretations and understanding of the product.  While EMs still very much want this information for themselves, they are leery of providing it to others in its current numeric form.  However, EMs noted some hope that these concerns could be addressed by adequate training.


Disseminating PHI to the Public and Partners

Fourth, while EMs might be hesitant to make this instantly available to the public for consumption, they did discuss mechanisms through which PHI should be disseminated and what should be included in the messaging to the public and partners.  Many EMs suggested social media platforms as venues for delivering PHI in today’s society.  Other EMs suggested using pre-existing alert systems that send notifications directly to cell phones.  Other EMs suggested the information could be put on a website with links to more detailed information for people who are interested in learning more or seeking additional information.

While thinking about a paradigm where PHI is made public, EMs indicated that PHI should not come from them; they would be happy to pass PHI along but they felt strongly that it should originate from NWS.  They thought the information would be more official and more trusted if it came directly from NWS.  “It needs to be discussed with NWS and we need to follow that because they are the ones who are putting this out and we are just passing on the information,” and, “there still has to be a message to the public that should not be filtered through us.  We can relay messages and that sort of stuff and so can the broadcast media, but ultimately when the NWS issues that PHI plume, that’s going to mean something.”

EMs also remarked on what should be included in public messaging. Some EMs noted that specificity is critical.  Other EMs noted that impact should be included.  Another EM suggested the information should be formatted as bullet points instead of summary text.  Many EMs agreed that messaging, in whatever form it is delivered, should be concrete and definitive; “gray” or uncertain information should not be sent out.  In particular, an EM said, “there’s a bit of anxiety from an emergency manager about providing them too much gray.”  EMs also stressed making the information personalizable; Zulu or UTC times should be eliminated in favor of local times, and location information is essential and should be provided when possible.  EMs thought this would help make the information more easily digestible for the average person.

Regardless of what gets conveyed to the public and how it gets sent out, EMs were in consensus that they did not want the public-at-large to have to interpret PHI on their own and make their own decisions.  They were collectively worried about that leading to a decrease in the number of people taking appropriate protective actions when needed.


Opposing thoughts on the Public’s Use of PHI

Lastly, some emergency managers thought the public might use PHI.  Many EMs suggested that while they really did not want the public to see PHI, they also believed it would become public anyway.  “People are going to get this information wherever they are. There’s so many different blogs out there that people do have access…” “Let’s face it, they (the public) see stuff and they get apps and they can look at it…” were comments shared by two EMs but endorsed by many others.  Other EMs expressed that they were somewhat okay with making PHI public because they do not believe people will go seeking the information.  One EM said, “The public’s not really going to seek out that information unless there’s a reason to.” As another EM put it, “I don’t believe the everyday citizen is going to wake up in the morning and turn on the PHI and see what the weather’s going to be like today.” Another EM also conveyed this point by saying, “I don’t believe the public is going to seek out this information on a daily basis.”  Because people may not use this information often, EMs stressed the importance of also having a strong public education campaign on how to use and interpret PHI.

Taken together, not every EM agreed with giving PHI to the public, but many EMs believed that the public would find a way to get the information.  Thus, a centralized plan on how this information would be delivered to the public should be developed for consistency and trust in the information.

We have gathered very rich information from participants over the years, and this blog post provides a high-level overview of some key themes that have emerged in the 2018 and 2019 experiments with a particular focus on PHI. Stay tuned for more updates and information about other aspects of the Experiment and other data collected!

Tags: None

What have we learned? A quick glance at emergency managers’ use of Probabilistic Hazard Information (PHI)

The Emergency Manager (EM) experiment has hosted over 40 emergency managers since its inception in 2016, including 19 EMs in 2019!  Before coming to the NOAA HWT housed in the NOAA National Severe Storms Laboratory in Norman, OK to participate in the Experiment, EMs completed a pretest questionnaire.  In particular, they answered questions about their demographics, weather product use, and decision-making styles.  

As a whole, our EMs have been predominantly white (91%), male (71%), college graduates (75%), with degrees ranging from Associate degrees to Doctoral degrees, who work primarily for government agencies (86%).  The majority of participants indicated working as EMs for more than 10 years.  They represent a variety of jurisdictions and services—cities, counties, state governments, hospitals, utilities, and federal agencies—from across the US.

EMs completed various questions assessing their decision-making styles and preferences.  One measure, the Subjective Numeracy Scale (Fagerlin et al. 2007), assessed EMs’ self-reported abilities and preferences for working with numbers over words.  Sample questions included, “How good are you at working with percentages?” and “When you hear a weather forecast, do you prefer predictions using percentages (e.g., ‘there will be a 0% chance of rain today’) or predictions using only words (e.g., ‘there is a small chance of rain today’)?”  Thirty-nine EMs answered these questions.  As a whole, EMs self-reported high numeracy, Mean = 4.48 (out of 6), Standard Deviation (s) = 0.98, which seemed to be driven by a preference for receiving numerical over verbal information, M = 4.66, s = 0.99 more than self-reported ability for working with numbers, M = 4.30, s = 1.36.

For a more detailed description of the Experiment, please see our previous posts here and here.  Let’s dive right into the good stuff!

Was PHI useful?  EMs overwhelmingly reported that PHI was useful for their decisions, M = 6.84 (out of 7), s = 0.99, n = 19.  Specifically, it delivered information quickly, M = 6.78 (out of 7), s = 0.43, n = 18; made EMs more confident in their decisions, M = 6.72 (out of 7), s = 0.58, n = 18; delivered pertinent information, M = 6.60 (out of 7), s = 0.70, n = 10; and was easy to use, M = 6.28 (out of 7), s = 0.75, n = 18.  Through discussions, EMs elaborated that one of the nice aspects of PHI was the ability to pinpoint where the most damaging impacts could be expected and give people more time to prepare.  Their warnings and communications could be more nuanced in that they were better able to indicate which areas should take immediate shelter, which areas should stay on high alert and be ready to shelter soon, and which areas had a bit of time before they could see potential impacts.

What is it about PHI that is most important/useful?  Does that depend on the hazard to which they were responding?  For both tornadoes and severe thunderstorms (high wind/hail in particular), similar elements of the PHI and the Enhanced Data Display (EDD; i.e., the tool used to deliver PHI to EMs; see below)

This is a picture of what the Enhanced Data Display (EDD) tool looks like from the user’s perspective

emerged as highly important: the forecaster discussion box, time of arrival estimate, hazard probability of occurrence, having one-hour lead time, and the PHI plume coloring scheme.  Of these elements, two were significantly different in their importance across hazards.  First, the importance of hazard probability of occurrence for understanding and communicating about tornadoes (M = .90) was significantly higher than for severe thunderstorms (M = .86), t(39) = 2.48, p = .02.  Second, the importance of the PHI plume coloring scheme for understanding and communicating about tornadoes (M = .83) was significantly higher than for severe thunderstorms (M = .79), t(39) = 2.70, p = .01.  The graphic below depicts these elements in the EDD and the data tables depict the differences in these PHI and EDD elements.

This is another view of the EDD tool with clear labels of the featured elements (e.g., the Forecaster Discussion box and Time of Arrival estimate).
This graph depicts participants’ ratings of the importance of each PHI element to their understanding and communication of Tornado hazards
This graph depicts participants’ ratings of the importance of each PHI element to their understanding and communication of Severe Thunderstorm hazards.


Can EMs successfully manage all of the different types of probabilistic information that were presented to them?  This research aim was unique for the 2019 Experiments because EMs were presented with multiple products along the continuum of severe weather events, each conveying different probabilistic information.  On a scale of 1 (extremely easy) to 5 (extremely difficult), EMs found it very easy to interpret all of the different kinds of probabilities they received for each case, M = 1.36, s = 0.51, n = 11.  In discussions, EMs would note that even though the probabilities differed in the ways in which they were derived (e.g., climatology based vs. storm based) or what they were communicating—among other dimensions—, they “all made sense together” and “told a complete story.”  EMs said having the complete picture helped, and having all of the probabilistic information helped them be more confident in making some decisions sooner while holding off on some other decisions.

So, after immersion in our probabilistic information world, did EMs walk away preferring probabilistic information?  Well, EMs actually had an overwhelming preference (95% of those asked; n = 20) for a combination of probability and text information.  Even among those not asked this question in the posttest survey, discussions revealed support for this preference.  In particular, EMs noted that, while they may prefer receiving probabilistic information for their own personal use (to help with interpreting the incoming storms), they would not want to pass probabilistic information on to their constituents (e.g., their bosses, their publics, their peers, etc.).  Therefore, they would also need textual information that is ready to pass on to others for their consumption.

Lastly, a really cool feature of the EDD is the user’s ability to customize the different layers that are shown (e.g., radar, map, PHI plumes) based on their personal preferences.  These layers included the color schemes used for the PHI plumes and the particular hazard plumes that are displayed.  Participants predominantly (70% of those asked) preferred a monochromatic color scheme over a rainbow color scheme; this color scheme separated each hazard by color with varying probability levels displayed as gradients of the assigned color.  For example, tornado PHI objects were red, where higher probabilities were represented by deeper/darker shades of red and lower probabilities were represented by fainter/lighter shades of red.  Severe wind/hail PHI objects were yellow with the same probability coloring concepts.  EMs noted the monochromatic plumes were “less cluttered/confusing,” “easy to discern on the map,” and “[didn’t] blur out the radar.”  They also noted the rainbow-colored PHI plumes were “too busy,” “distracting,” “[easily] confused with radar.”  EMs noted difficulty trying to tell differing hazard plumes apart when they were all rainbow-colored.  Thus, the monochromatic plumes were preferred because it was easier to distinguish between threats and ostensibly easier to discern the probabilistic information.

This picture depicts the monochromatic PHI coloring scheme; the red coloring is used for Tornado PHI objects.
This picture depicts the rainbow PHI coloring scheme; PHI objects are depicted with rainbow colors similar to radar.


The findings discussed here only briefly touch on a few of the concepts that were tested and evaluated over the years of the EM Experiment.  Taken together, our EM sample reported relatively high numeracy and a preference for receiving numerical (over textual) information.  This preference was expressed in their responses to PHI; they found PHI provided important information and improved their decision-making.  Further, they had an overwhelming preference for the PHI visualization that made it easy to distinguish hazards and probabilities of occurrence, i.e., the monochromatic color scheme.  Unfortunately, our sample is small.  We don’t have the variability in our EMs numeracy scores to speak to whether these preferences change as a function of self-reported numeracy, but that is a great long-term goal for future research!  Stay tuned for more updates and information about other aspects of the Experiment!

Tags: None

The 2019 Emergency Manager Experiment Unwrapped! Insight Into This Year’s Experiment and Product Innovations

The Spring 2019 Emergency Manager (EM) Experiment hosted eight EMs across two weeks in May.  The EMs hailed from a variety of jurisdictions and services–city, county, and state governments, as well as utilities and hospital networks–and represented several different states, including New York, Colorado, Kentucky, Florida, Oklahoma, and Ohio.  

In the experiment, EMs worked archived cases with the help of  experimental forecast products under development at NSSL, CIMMS, and SPC.  The products have been generated as part of the Forecasting a Continuum of Environmental Threats (FACETs) program, which seeks to improve the communication of Probabilistic Hazard Information (PHI).  The new products all represented forecast uncertainty in different ways, offering deeper insight into forecaster thinking about storm likelihood, timing, and location.  EMs first received longer-range forecasting products that were issued days before the event, and worked their way to products issued at the warning time scale, covering a fuller “continuum” of forecast information.  The archived cases encompassed a variety of severe weather threats, e.g., severe thunderstorms, QLCS storms, and supercell tornadoes that occurred across the continental US.  

Each day, the participants began with long range SPC Convective Outlooks–Day 4, Day 3 and Day 2.  Then, depending on the issue time of each product, participants saw Day 1 outlooks, Mesoscale Convective Discussions, and Watches.  Interspersed with these products, participants received an experimental Potential for Severe Timing (PST) product, experimental Warn-on-Forecast (WoF) output, and/or experimental hazard timing graphs from SPC.  Periodically throughout the case, participants completed micro-surveys asking about trends they were noticing, details they were keying in on, and decisions/actions they were taking based on the information received.  There were also mini focus groups at each time step to discuss the same topics in more detail.  As the week progressed, participants received more of the experimental products.  On Tuesday, only the PST was given; on Wednesday, participants saw the PST and WoF; and, on Thursday, participants saw the SPC timing products and WoF.  At the end of each case, at the warning timescale, participants received warning-scale PHI.  Then at the end of the day, a wrap-up survey and focus group evaluated how participants viewed the information and forecast evolution in light of what occurred.  

What are these experimental products I just mentioned? 

Sample Potential for Severe Timing (PST) Product

The PST is a product that specifies the 4-hour window(s) for the areas where severe weather is most likely to occur (see graphic to the left).  Ideally, the PST would be issued with the 11:30 Day 1 Outlook and would be valid until the end of the convective day.  This tool is meant to help provide early and specific timing information to users to help facilitate their planning during severe weather days (e.g., should schools be closed, extra staffing brought in, shift scheduled temporarily modified). 


Sample Warn-on-Forecast (WoF) Product

The WoF output provided to EMs is a timing product that identifies areas where convection is most likely to develop over the next few hours, and the associated probabilities that it will (see graphic to the left).  Further, the output updates every hour.  The SPC Hazard Timing Graph takes the Day 1 Outlook and breaks it into four-hour windows of time, allowing participants to see when hazards are most likely to occur in their area within a 24-hour period.  Ideally, this graphic would automatically update with updates in forecast guidance. This tool would help users know, for example, when a storm is expected to reach the “moderate risk” threshold and for how long.

The last day of the experiment consisted of extensive debriefing and reflecting.  EMs completed post-week surveys and a focus group interview which asked for their deep evaluations of the tools and products they used.  We wanted to know what they liked/did not like, what worked, what was impossible to figure out or use, and their views on how PHI could be implemented in operations.


Ok, so what’s next?

Right now we are in the preliminary stages of analyses.  As a research team, we have met to discuss how to best utilize the wealth of information we gained from the new methodology used this year and rich feedback we received.  Analysis plans have been formed and are underway.  Product development is being informed by observations and early observable trends to continue moving toward operational status.  We are also planning the Fall 2019 Hazard Services PHI experiment for an integrated warning team–forecasters, broadcast meteorologists, and emergency managers working together.  The emergency managers’ portion of the Fall experiment will again feature many of these products, but within a new platform: Hazard Services.

Tags: None

Week 1 is underway!

Week 1 of this year’s Spring EM Experiment kicked off yesterday!  EMs were able to get a first look at some of the new experimental products, and they began to work PHI in the Enhanced Data Display (shown on the screens).  In the coming days we’ll add even more new products.

EM round table discussion
EMs’ first looks at new experimental products.
EMs working PHI in the Enhanced Data Display (EDD).
Tags: None

This year’s experiment is about to kick off!

Spring is buzzing around the building and we are excited to have this year’s EM experiment just around the corner! It’s PHI-nally here!

We have Emergency Managers coming from all over the country–Colorado, Florida, Kentucky, New York, Michigan, Ohio, and Oklahoma–representing a variety of jurisdictions, such as cities, counties, states, hospital networks, utility companies, and more!  We’ll be switching things up a bit this year so stay tuned for pictures and updates of the action.  Week 1 starts next week, May 13, and Week 2 starts right after that on May 20.

Tags: None

What IS the PHI-EM experiment and why is it being run?

Since 2015, an ever growing and evolving team of researchers at CIMMS/NSSL have been collaborating with academic researchers from around the country to host annual springtime Emergency Manager (EM) experiments, including the Probabilistic Hazard Information (PHI)-EM experiment.  These experiments were designed to elicit feedback directly from EMs about new technologies under development at the lab. The PHI-EM experiments have specifically focused on gathering feedback about a new technology called Probabilistic Hazard Information.


The PHI developed at NSSL is meant to help all parties in the communication chain make more informed decisions about impending weather threats.  This new PHI includes the probability of a storm to produce tornadoes, severe thunderstorm hazards (including high wind and hail), and lightning in the next hour.  It also updates rapidly, and is most commonly viewed as a plume of probabilities projected ahead of a storm (see picture below). PHI plumes are created by a forecaster using a suite of tools and algorithms.  The forecaster makes decisions about the probabilistic trend of the storm based on his/her tools (e.g., radar, ensemble model data). After creation, PHI plumes are delivered to EMs and Broadcast Meteorologists through the Enhanced Data Display (EDD).  In addition, the EDD offers other useful information about timing, severity, and the anticipated storm track. EMs and Broadcasters then use the PHI plumes to make decisions for their jurisdictions such as sounding sirens or canceling events (EMs), and whether to run a crawl or cut into on-air programming for live coverage (Broadcasters).  


EM feedback is invaluable to the evaluation process.  While PHI may constitute a huge breakthrough on the forecasting end of the chain by conveying richer and very localized forecast information, if the displays are hard to understand or not providing meaningful and needed information on the users’ end of the chain, then more work needs to be done!  Thus, EMs have been brought in as participants to help assess the viability of this new information and product. Specifically, EMs have been asked for their feedback on the types of PHI that have been created thus far as well as the EDD interface to view them. They have been asked to comment on which aspects of PHI are most/least helpful and easy/difficult to use and understand.  Overall, as researchers, we are trying to ascertain the feasibility of the PHI and EDD and move them toward operations!

Tags: None

2019 Spring EM Experiment Recruitment has started!

Hi everyone!  It’s that time of year again!  That’s right, the call just came out and applications are rolling in for the 2019 Spring EM Experiment!  More details can be found on the Recruitment Page for the project!  Take a look through the details when you get a chance.  We hope all of the Emergency Managers out there will consider applying!

Tags: None

We’re Back!

Hello everyone!  My name is Cassandra Shivers-Williams and I am currently a post-doc researcher at CIMMS/NSSL within the Societal Impacts Group (SIG).  I have been working with Emergency Managers (EMs) in the Hazardous Weather Testbed experiments since 2016!  My wonderful colleague Kodi Berry started this blog as a way to talk about all of the awesome EM research happening here!  Well…I’m picking it up and taking it over! (You may have noticed the site facelift =)  )

This blog will be highlighting lots of fun with EMs and the Probabilistic Hazard Information (PHI) Experiment, sprinkled with some other ongoing social science research within the SIG!  Our sister entity, KPHI TV, also conducts social science research, but primarily with Broadcaster Meteorologists.  That work is blasted on the KPHI TV Blog!   I encourage everyone to check out that blog for more fun with PHI!

This website has been updated with some background information about the work we do and the research team, opportunities for EMs to participate in testbed research, presentations/publications of our EM work, and some alumni!  Take a look around and check back in periodically to see the latest and greatest updates from the SIG!

Tags: None