
The Spring 2019 Emergency Manager (EM) Experiment hosted eight EMs across two weeks in May. The EMs hailed from a variety of jurisdictions and services–city, county, and state governments, as well as utilities and hospital networks–and represented several different states, including New York, Colorado, Kentucky, Florida, Oklahoma, and Ohio.
In the experiment, EMs worked archived cases with the help of experimental forecast products under development at NSSL, CIMMS, and SPC. The products have been generated as part of the Forecasting a Continuum of Environmental Threats (FACETs) program, which seeks to improve the communication of Probabilistic Hazard Information (PHI). The new products all represented forecast uncertainty in different ways, offering deeper insight into forecaster thinking about storm likelihood, timing, and location. EMs first received longer-range forecasting products that were issued days before the event, and worked their way to products issued at the warning time scale, covering a fuller “continuum” of forecast information. The archived cases encompassed a variety of severe weather threats, e.g., severe thunderstorms, QLCS storms, and supercell tornadoes that occurred across the continental US.
Each day, the participants began with long range SPC Convective Outlooks–Day 4, Day 3 and Day 2. Then, depending on the issue time of each product, participants saw Day 1 outlooks, Mesoscale Convective Discussions, and Watches. Interspersed with these products, participants received an experimental Potential for Severe Timing (PST) product, experimental Warn-on-Forecast (WoF) output, and/or experimental hazard timing graphs from SPC. Periodically throughout the case, participants completed micro-surveys asking about trends they were noticing, details they were keying in on, and decisions/actions they were taking based on the information received. There were also mini focus groups at each time step to discuss the same topics in more detail. As the week progressed, participants received more of the experimental products. On Tuesday, only the PST was given; on Wednesday, participants saw the PST and WoF; and, on Thursday, participants saw the SPC timing products and WoF. At the end of each case, at the warning timescale, participants received warning-scale PHI. Then at the end of the day, a wrap-up survey and focus group evaluated how participants viewed the information and forecast evolution in light of what occurred.
What are these experimental products I just mentioned?
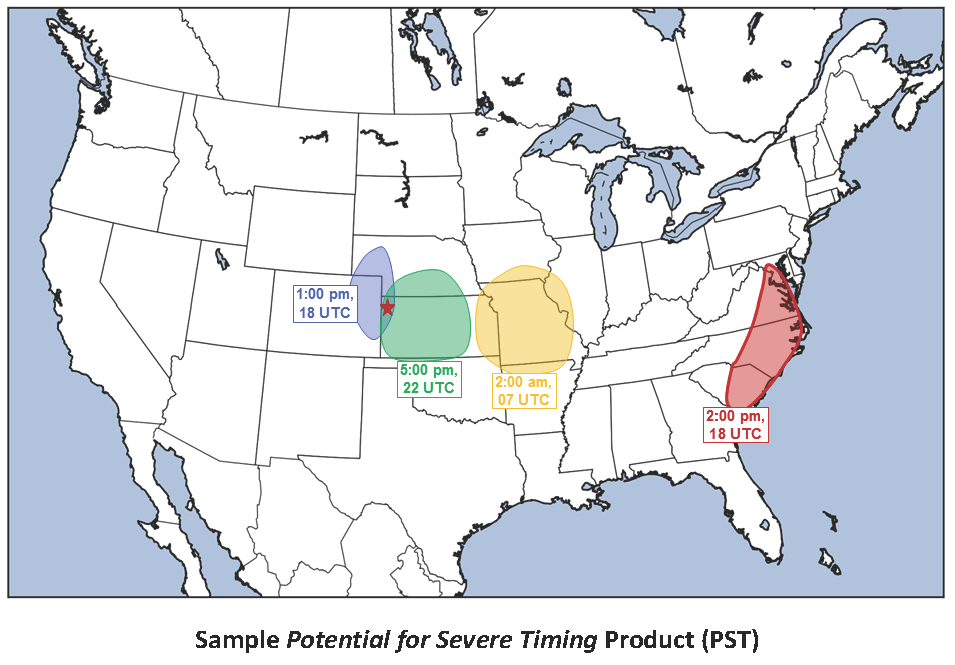
The PST is a product that specifies the 4-hour window(s) for the areas where severe weather is most likely to occur (see graphic to the left). Ideally, the PST would be issued with the 11:30 Day 1 Outlook and would be valid until the end of the convective day. This tool is meant to help provide early and specific timing information to users to help facilitate their planning during severe weather days (e.g., should schools be closed, extra staffing brought in, shift scheduled temporarily modified).
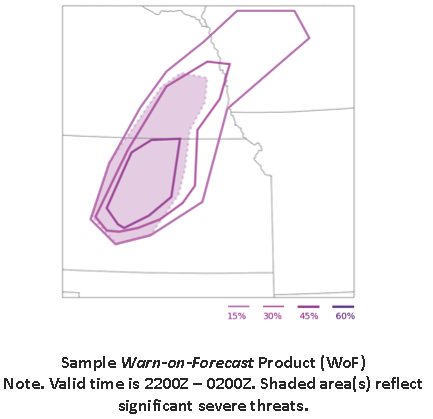
The WoF output provided to EMs is a timing product that identifies areas where convection is most likely to develop over the next few hours, and the associated probabilities that it will (see graphic to the left). Further, the output updates every hour. The SPC Hazard Timing Graph takes the Day 1 Outlook and breaks it into four-hour windows of time, allowing participants to see when hazards are most likely to occur in their area within a 24-hour period. Ideally, this graphic would automatically update with updates in forecast guidance. This tool would help users know, for example, when a storm is expected to reach the “moderate risk” threshold and for how long.
The last day of the experiment consisted of extensive debriefing and reflecting. EMs completed post-week surveys and a focus group interview which asked for their deep evaluations of the tools and products they used. We wanted to know what they liked/did not like, what worked, what was impossible to figure out or use, and their views on how PHI could be implemented in operations.
Ok, so what’s next?
Right now we are in the preliminary stages of analyses. As a research team, we have met to discuss how to best utilize the wealth of information we gained from the new methodology used this year and rich feedback we received. Analysis plans have been formed and are underway. Product development is being informed by observations and early observable trends to continue moving toward operational status. We are also planning the Fall 2019 Hazard Services PHI experiment for an integrated warning team–forecasters, broadcast meteorologists, and emergency managers working together. The emergency managers’ portion of the Fall experiment will again feature many of these products, but within a new platform: Hazard Services.